ApexSQL Monitor 2016 R2 has been released
Type: Medium feature, medium fix release
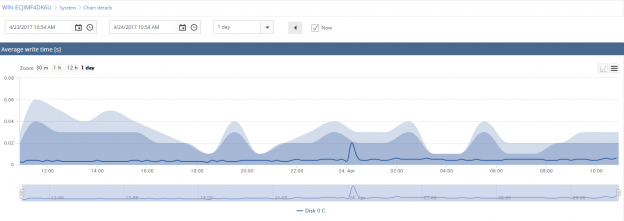
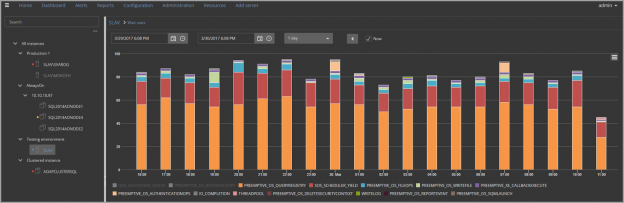
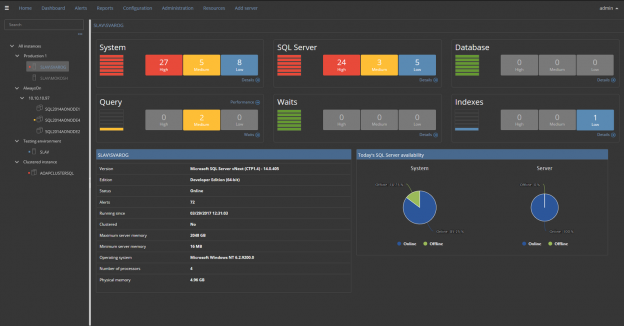
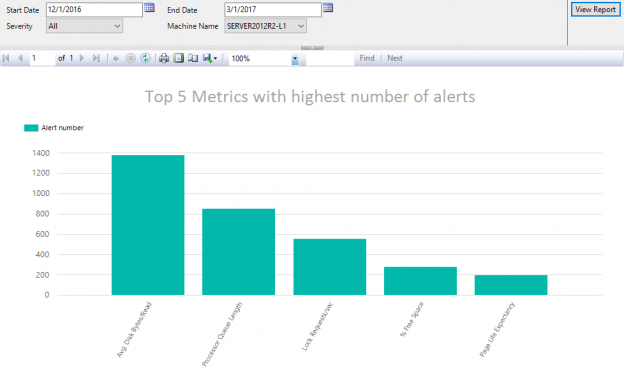
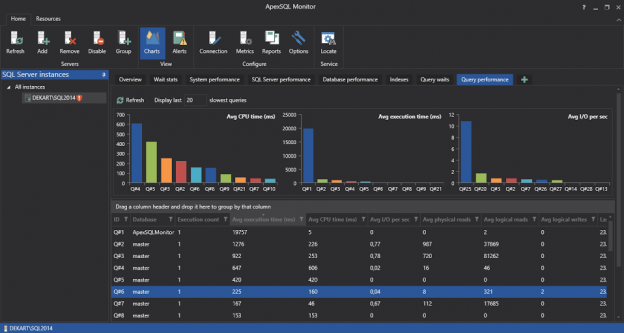
About ApexSQL Monitor: ApexSQL Monitor is a Windows and SQL Server monitoring tool with a wide range of monitored metrics. It tracks Windows, SQL Server instance, and database metrics on multiple local and remote machines and SQL Server instances. It monitors the most important SQL Server statistics, memory, buffer, and page metrics – batch requests per second, user connections, target and total server memory, buffer cache hit ratio, batch requests, page life expectancy, page reads and writes per second, and more. ApexSQL Monitor also tracks SQL Server wait statistics including the individual queries wait statistics. Monitoring these metrics enables you to identify and troubleshoot performance problems, establish trends, and set baselines.
August 15, 2016