


The new release of ApexSQL Monitor is out. ApexSQL Monitor monitors more than 30 system, SQL Server, and database performance counters in real time. In ApexSQL Monitor 2014 R2, we introduce better performance, new features, and improved usability and quality.
Improved performance
In the previous version of ApexSQL Monitor, graphs were not displayed immediately after selecting the measurements tab. There was a certain time delay between the selecting the wanted measurement tab and displaying the graphs. This delay could be up to several minutes when larger amount of data was stored in repository database.
In ApexSQL Monitor 2014 R2, we introduce a new graph implementation and new engine that supports them and the delay is reduced to minimum. Compared to ApexSQL Monitor 2014 R1, the time needed to display the charts, with repository database loaded with data collected for 20 days, is improved by 2,500%.
Charts history navigation via the date/time picker or navigation arrows
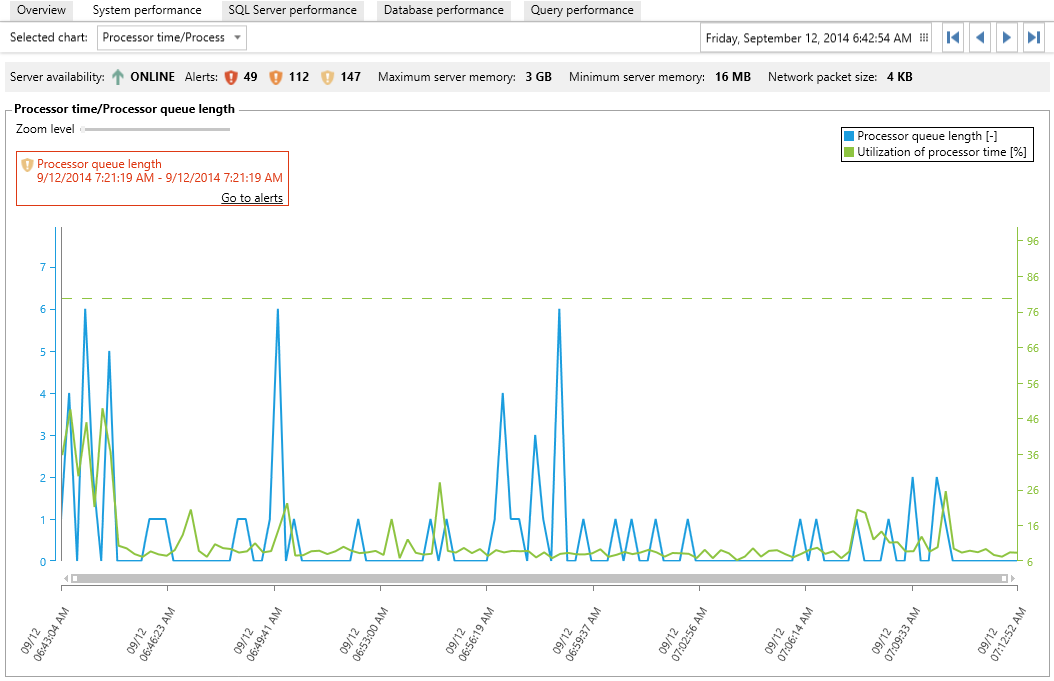
Each chart now displays 30 minutes of data and allows quick and easy navigation through the data history. Users can jump directly to the desired date/time in a graph via the new date/time picker or browse through the collected data history by scrolling through the chart history. This allows users to have immediate insight into all measurements for the selected category. Also, the drop-down charts list is added for each metric category to allow quick access to the desired chart. Because of these changes, the History ribbon, utilized in the R1 version, became obsolete and thus it is removed from R2
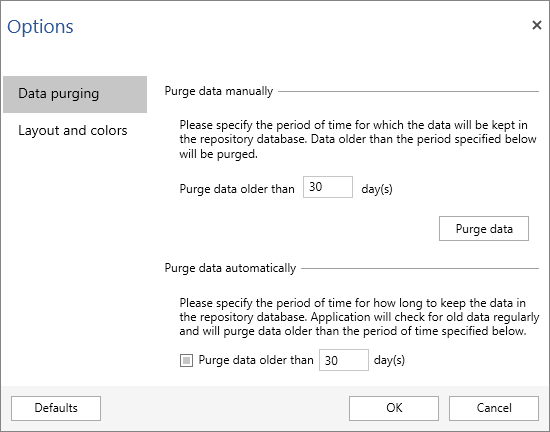
Automatic data purging
ApexSQL Monitor continuously stores a significant amount of data in the repository database that can lead to a situation where repository database could use all hard disk space. To prevent this, ApexSQL Monitor can be set to check for old data regularly and purges data older than the time specified automatically. This allows users to decide how much data they want to keep in the repository database according to the available storage resources or according to the specific period of time in which the collected data are deemed to still be valid.
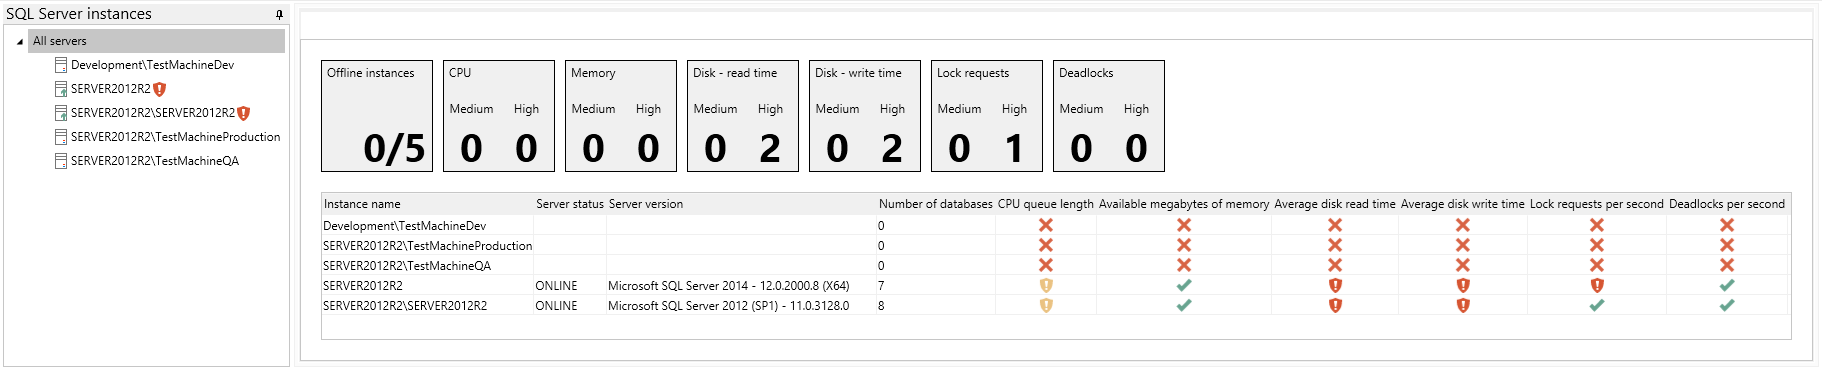
Improved dashboard displays and server overview tab
In ApexSQL Monitor 2014 R2 we introduced a more detailed dashboard which displays aggregate server information and status of the most important alerts for the following metric: CPU, Memory, Disk-read time, Disk-writ time, Lock requests and Deadlocks. As an addition to aggregate information, all monitored SQL Servers with the most critical information are listed to allow instant access and more detailed information on each individual instance
Query performance monitoring
Users can define the number of slowest queries to be displayed. Besides the table, the five slowest queries by I/O, by CPU time, and by the Execution time are displayed in the appropriate graphs.
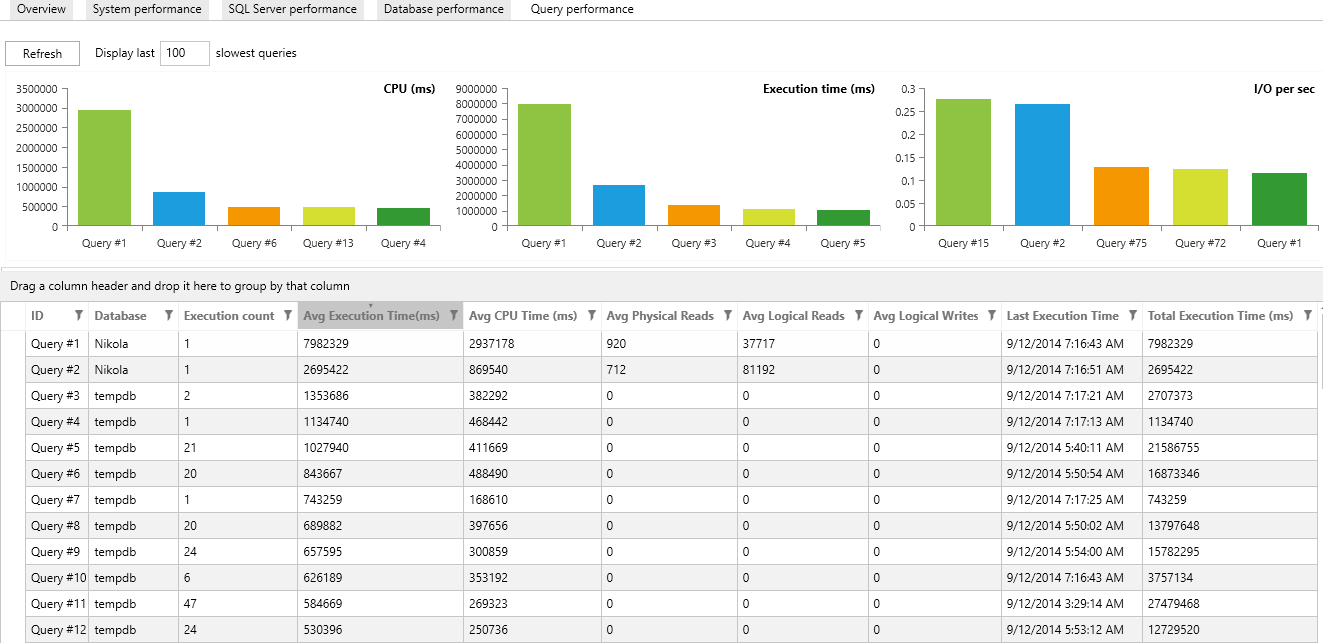
Users are allowed to define the number of slowest queries to be displayed in the slowest query table that shows:
- Database
- Execution count
- Average execution time
- Average CPU time
- Average physical reads
- Average logical reads
- Average logical writes
- Query statement
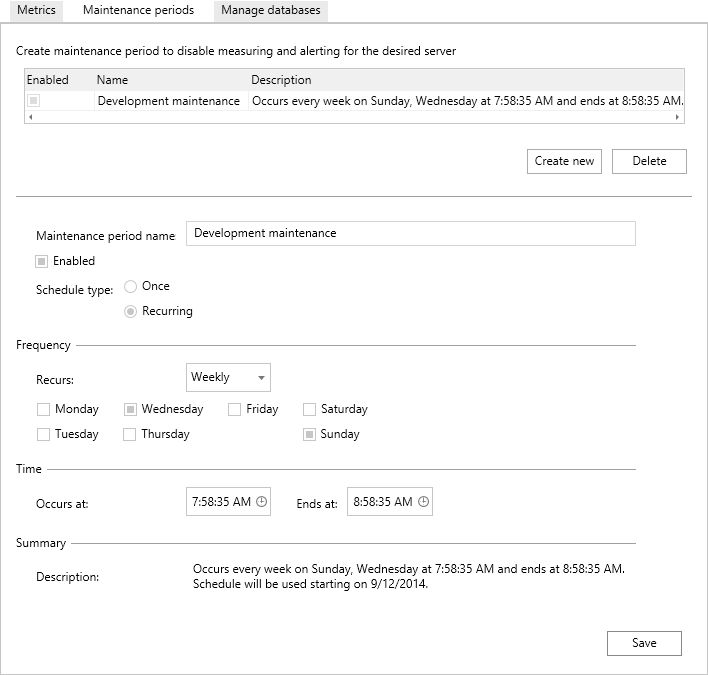
Maintenance periods
ApexSQL Monitor R2 now allows users to schedule maintenance time periods, during which measurement and alerting is disabled for selected SQL instances. When the maintenance period is on, all measurements are disabled and thus no alerts are triggered. The measurements and alerting resumes once the maintenance period has ended. The maintenance period can be configured and scheduled according to user needs. Maintenance periods can be scheduled to occur on daily, weekly or monthly basis, or on for a single specified time:
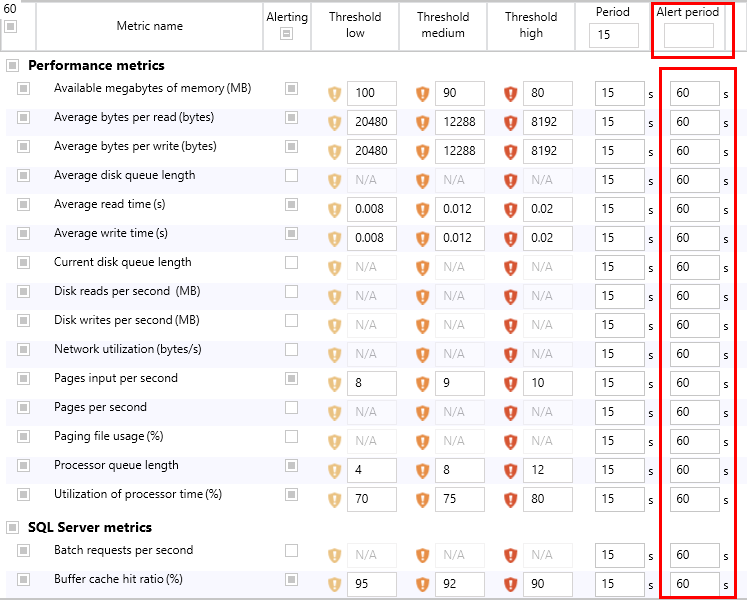
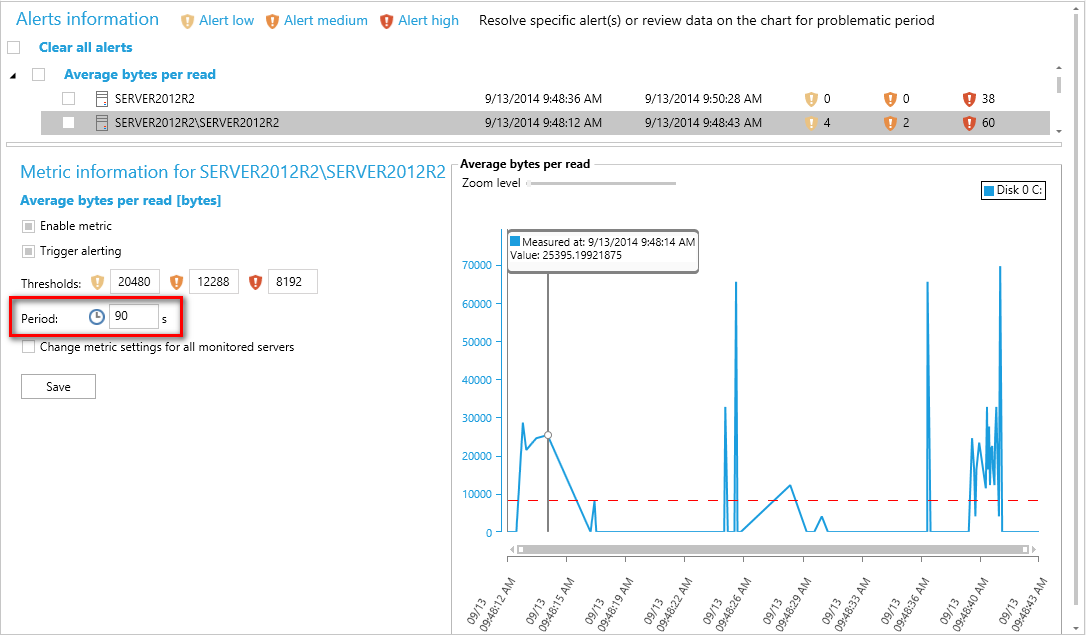
Alert suppressing
Alert suppressing functionality allows the user to define the length of time for which a value must exceed the threshold before the alert is triggered. This is designed to reduce the “noise level” caused by short duration spikes from some metrics.
The Configure metrics window allows configuring alert suppression by entering the time period in seconds for all the available metrics at once or individually for each metrics. In this way, user can ensure precise adjusting and thus tightly control the quantity of alerts
The alert suppression period can be also set in the Alerts window. If users want to change the suppression period for alerts that are triggered too often, they can select the desired alert from the list and change the associated value for the Period field
September 18, 2014


