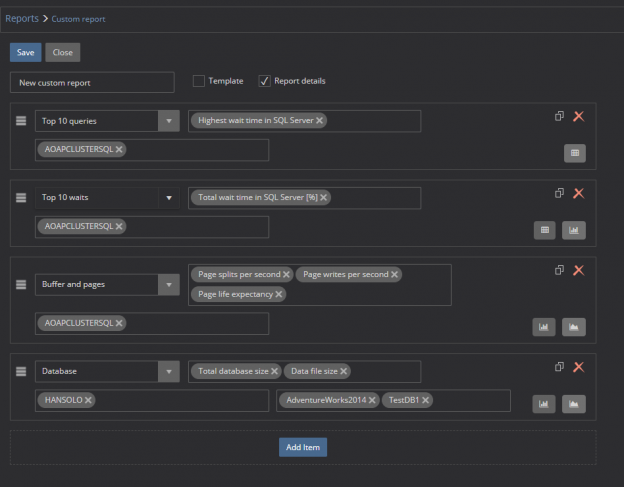
We at ApexSQL are proud to present a redesigned ApexSQL Monitor’s custom reports feature
February 23, 2018


We at ApexSQL are proud to present a redesigned ApexSQL Monitor’s custom reports feature
February 23, 2018
ApexSQL Monitor 2018 has been released
About ApexSQL Monitor: ApexSQL Monitor is a Windows and SQL Server monitoring tool with a wide range of monitored metrics. It tracks Windows, SQL Server, AlwaysOn Availability Group and Failover Cluster instances, and database metrics on multiple local and remote machines and SQL Server instances. It monitors the most important SQL Server statistics, memory, buffer, and page metrics – batch requests per second, user connections, target and total server memory, buffer cache hit ratio, batch requests, page life expectancy, page reads and writes per second, and more. ApexSQL Monitor also tracks SQL Server wait statistics including the individual query wait statistics. Monitoring these metrics enables you to identify and troubleshoot performance problems, establish trends, set baselines, and generate built-in or custom reports.
January 16, 2018
ApexSQL Monitor 2017 R6 has been released
About ApexSQL Monitor: ApexSQL Monitor is a Windows and SQL Server monitoring tool with a wide range of monitored metrics. It tracks Windows, SQL Server, AlwaysOn Availability Group and Failover Cluster instances, and database metrics on multiple local and remote machines and SQL Server instances. It monitors the most important SQL Server statistics, memory, buffer, and page metrics – batch requests per second, user connections, target and total server memory, buffer cache hit ratio, batch requests, page life expectancy, page reads and writes per second, and more. ApexSQL Monitor also tracks SQL Server wait statistics including the individual query wait statistics. Monitoring these metrics enables you to identify and troubleshoot performance problems, establish trends, set baselines, and generate built-in or custom reports.
December 21, 2017
ApexSQL Monitor 2017 R5 has been released
About ApexSQL Monitor: ApexSQL Monitor is a Windows and SQL Server monitoring tool with a wide range of monitored metrics. It tracks Windows, SQL Server, AlwaysOn Availability Group and Failover Cluster instances, and database metrics on multiple local and remote machines and SQL Server instances. It monitors the most important SQL Server statistics, memory, buffer, and page metrics – batch requests per second, user connections, target and total server memory, buffer cache hit ratio, batch requests, page life expectancy, page reads and writes per second, and more. ApexSQL Monitor also tracks SQL Server wait statistics including the individual query wait statistics. Monitoring these metrics enables you to identify and troubleshoot performance problems, establish trends, set baselines, and generate built-in or custom reports.
November 27, 2017
ApexSQL Monitor 2017 R4 has been released
About ApexSQL Monitor: ApexSQL Monitor is a Windows and SQL Server monitoring tool with a wide range of monitored metrics. It tracks Windows, SQL Server, AlwaysOn Availability Group and Failover Cluster instances, and database metrics on multiple local and remote machines and SQL Server instances. It monitors the most important SQL Server statistics, memory, buffer, and page metrics – batch requests per second, user connections, target and total server memory, buffer cache hit ratio, batch requests, page life expectancy, page reads and writes per second, and more. ApexSQL Monitor also tracks SQL Server wait statistics including the individual queries wait statistics. Monitoring these metrics enables you to identify and troubleshoot performance problems, establish trends, set baselines, and generate built-in or custom reports.
October 5, 2017Our goal is Day 1 support for SQL Server 2017 which will be made generally available on October 2.
September 26, 2017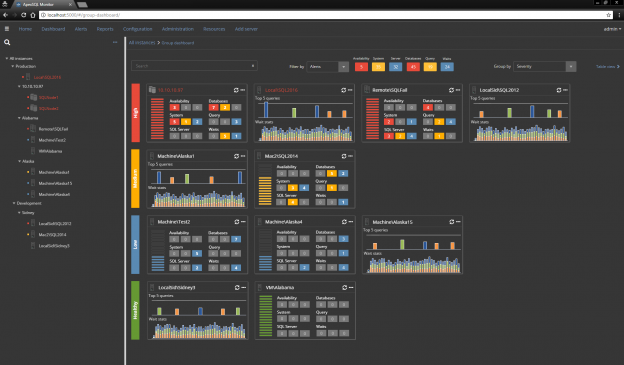
We are excited to announce a new dashboard page redesign including a new panel view for the release of the ApexSQL Monitor R4 which is scheduled for September 2017.
August 24, 2017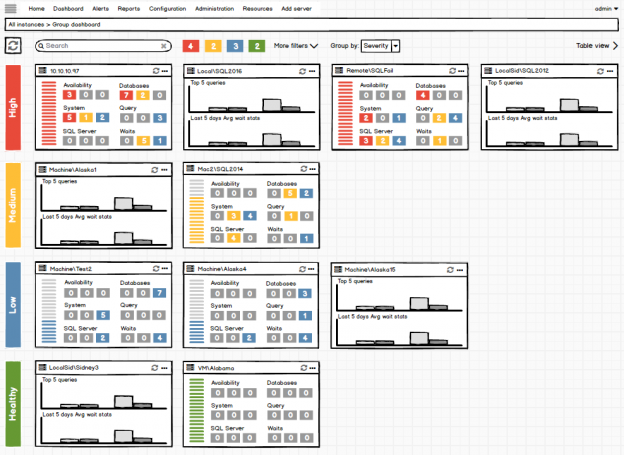
We are proud to announce a brand-new look of the ApexSQL Monitor dashboard that will be part of the upcoming release, in September.
July 25, 2017
ApexSQL Monitor 2017 R3 has been released
About ApexSQL Monitor: ApexSQL Monitor is a Windows and SQL Server monitoring tool with a wide range of monitored metrics. It tracks Windows, SQL Server, AlwaysOn Availability Group and Failover Cluster instances, and database metrics on multiple local and remote machines and SQL Server instances. It monitors the most important SQL Server statistics, memory, buffer, and page metrics – batch requests per second, user connections, target and total server memory, buffer cache hit ratio, batch requests, page life expectancy, page reads and writes per second, and more. ApexSQL Monitor also tracks SQL Server wait statistics including the individual queries wait statistics. Monitoring these metrics enables you to identify and troubleshoot performance problems, establish trends, set baselines, and generate built-in or custom reports.
July 12, 2017
ApexSQL Monitor 2017 R2 has been released
About ApexSQL Monitor: ApexSQL Monitor is a Windows and SQL Server monitoring tool with a wide range of monitored metrics. It tracks Windows, SQL Server, AlwaysOn Availability Group and Failover Cluster instances, and database metrics on multiple local and remote machines and SQL Server instances. It monitors the most important SQL Server statistics, memory, buffer, and page metrics – batch requests per second, user connections, target and total server memory, buffer cache hit ratio, batch requests, page life expectancy, page reads and writes per second, and more. ApexSQL Monitor also tracks SQL Server wait statistics including the individual queries wait statistics. Monitoring these metrics enables you to identify and troubleshoot performance problems, establish trends, set baselines, and generate built-in or custom reports.
June 5, 2017


© Quest Software Inc. ALL RIGHTS RESERVED. | GDPR | Terms of Use | Privacy
