


We are glad to announce that ApexSQL Plan 2017 R2 has just been released. In this version we added many new features and major improvements related Query store support and Stored procedure analysis along with other minor features.
Extended Query store
The Extended Query store is an upgraded version of the Query store feature in previous version of ApexSQL Plan. This means that the Query store is not separated into three different tabs with specific uses.
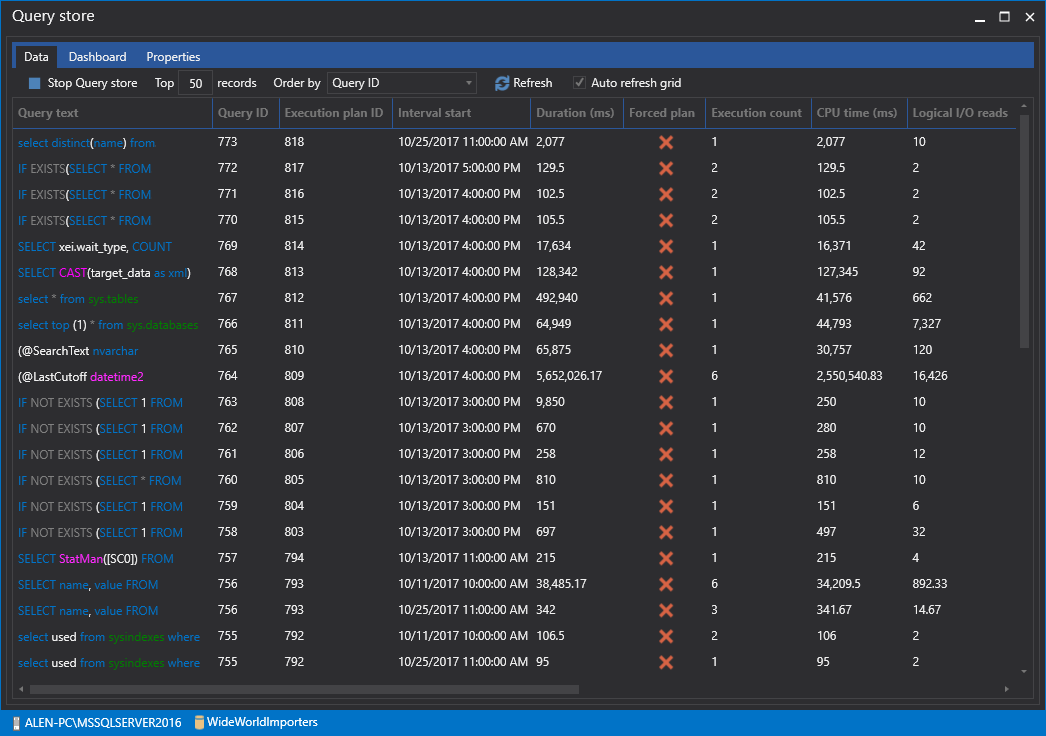
Data tab
This tab resembles the complete Query store feature in the previous version of ApexSQL Plan, but now as a separate tab, allows users to view specific Query store results using their predefined criteria. The main enhancement of the Data tab is that the Query store is now available to users that haven’t yet migrated to SQL Server 2016 or higher. This means that besides the original support of Query store for SQL Server 2016, previous versions of SQL Server from 2008 to 2014 are also supported. This includes all editions (Express, Standard, Enterprise).
Dashboard tab
Diagrams, who doesn’t like them? The new Extended Query store contains an additional tab reserved only for diagrams and charts that can provide visualization, deep insight and analysis of the data inside Query Store.
The following graphical representation elements of the Query store dashboard are implemented:
- Top 10 queries based on average duration in the last hour
- Top 10 queries based on execution in the last hour
- Number of unique queries executed in the last hour
- Execution plan diversity in the last hour
- Worker time consumption last 8 hours grouped by intervals
- Logical reads & writes last 8 hours grouped by intervals
- Elapsed query time last 8 hours grouped by intervals
- Queries with multiple execution plans
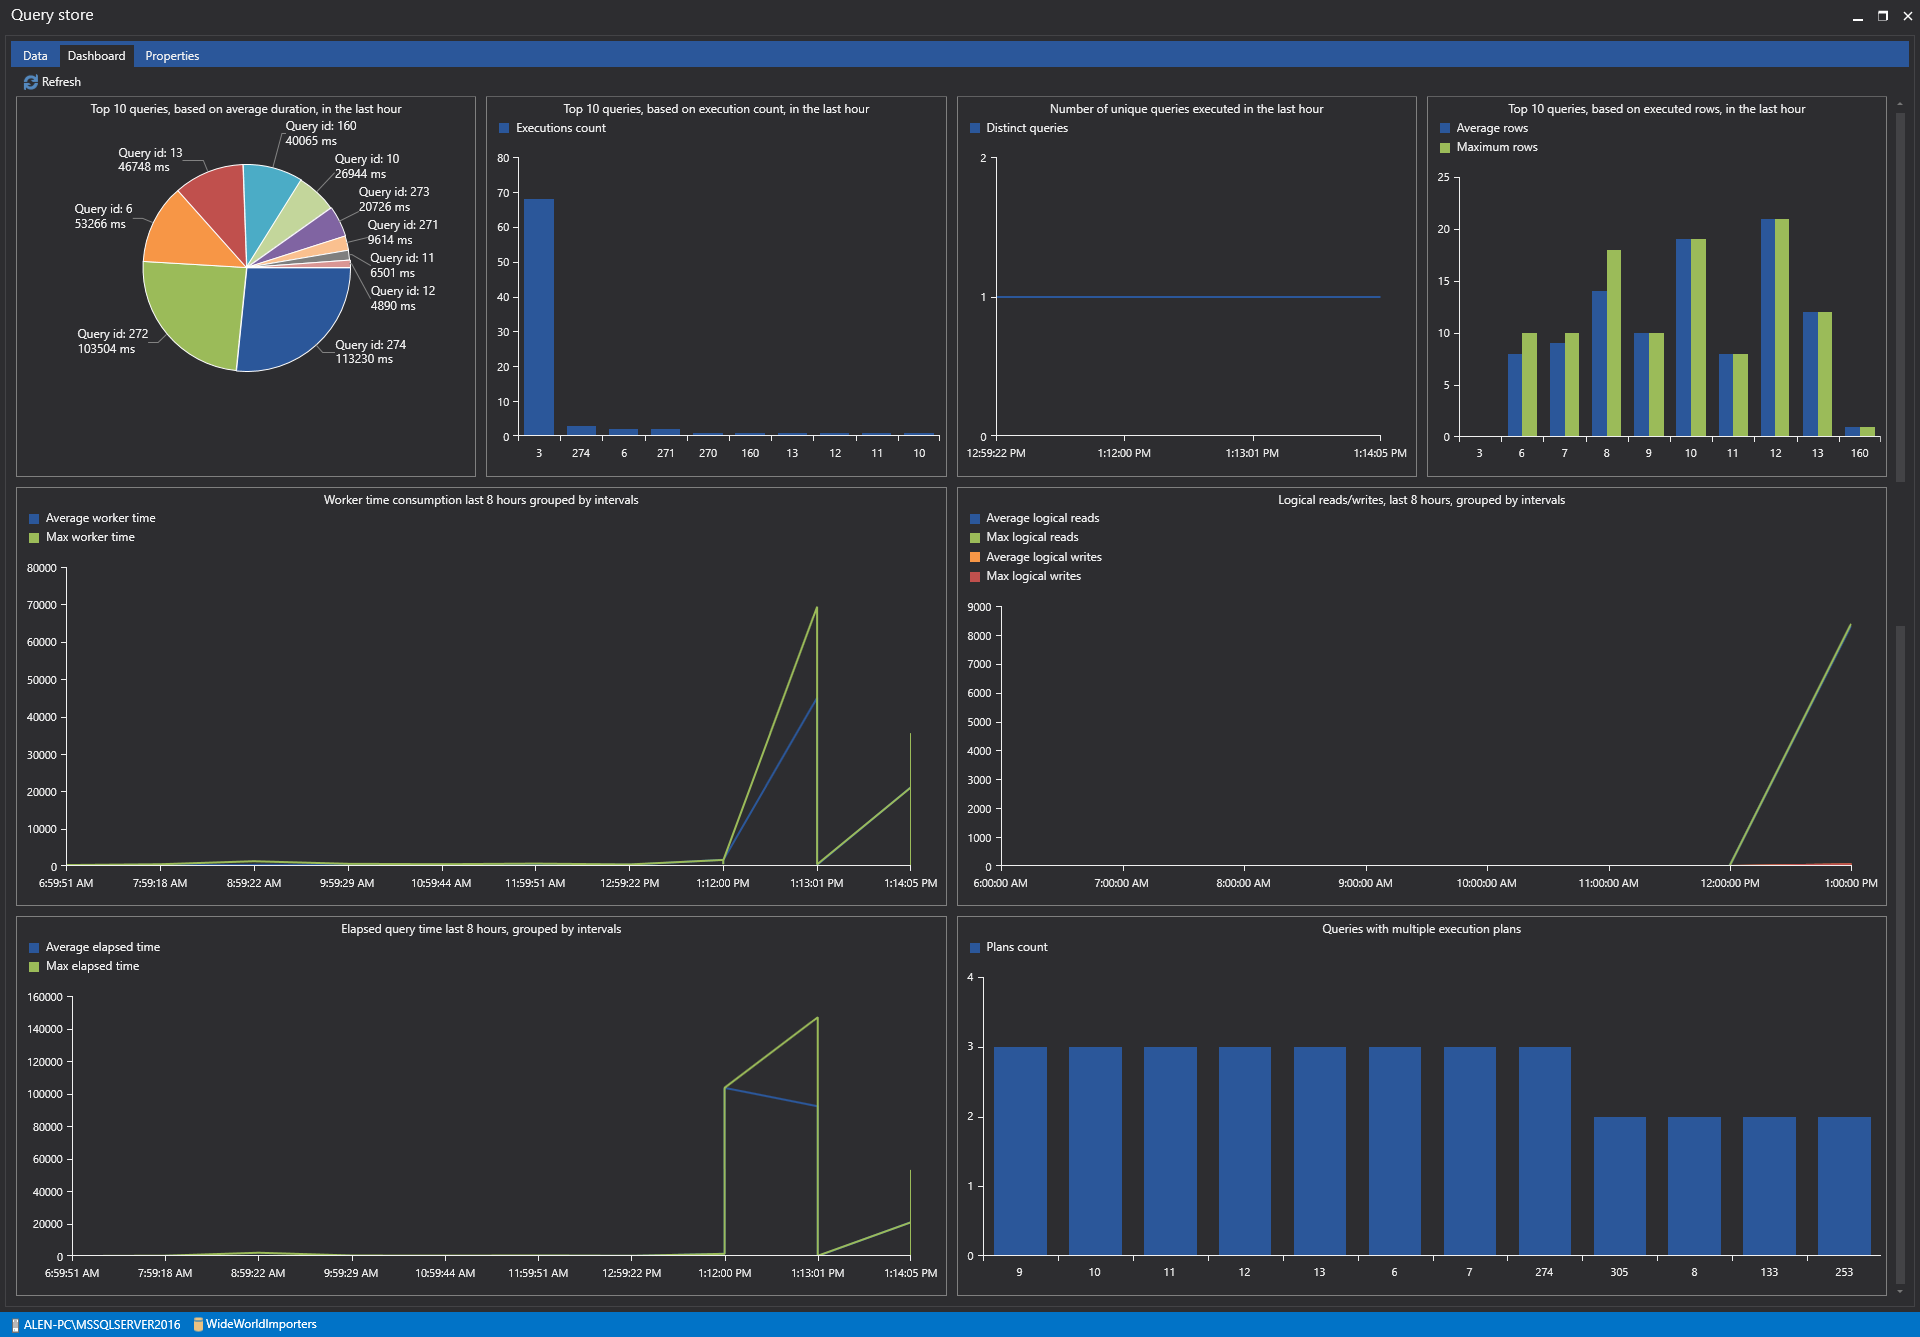
The displayed visual diagrams are available for exporting as an image containing all diagrams or each diagram separately in JPG, BMP and PNG output formats.
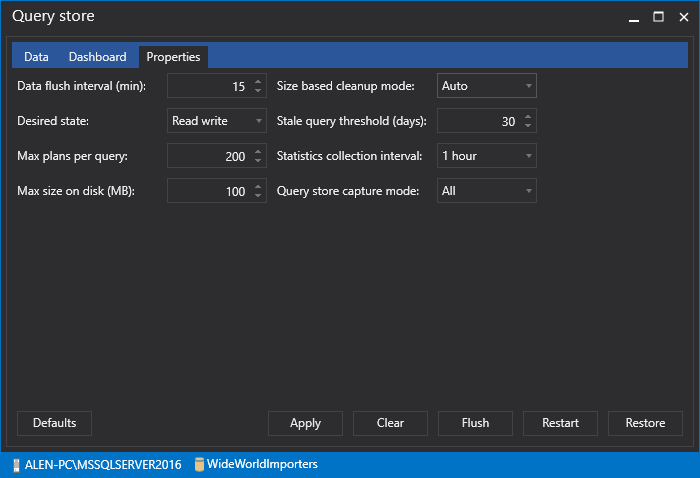
Properties tab
The Extended Query store comes with another tab containing the following Query store properties:
- Data flush interval (minutes)
- Statistics collection interval
- Max size on disk (MB)
- Query store capture mode
- Size based cleanup mode
- Stale query threshold (days)
- Max plans per query
Beside the mentioned enhancements the Properties tab contains action buttons that allow the user to:
- Restart Query store
- Restore Query store settings to default values
- Clear Query store content
- Apply properties to SQL Server Query store
- Flush collected data to disk
Stored procedure analysis
This feature allows users to load a specific stored procedure from a database and perform detailed analysis for potential issues with that procedure.
The selection of the desired stored procedure, is possible by selecting “Profile” or “Lazy profile” buttons from the Stored procedure analysis group in the main ribbon bar.
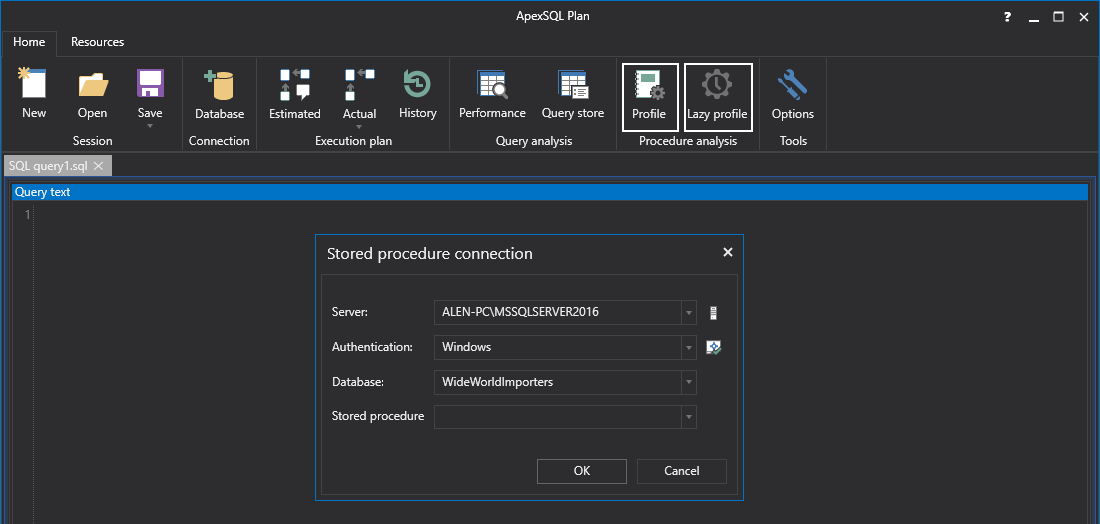
After pressing the OK button in Stored procedure connection window, a new dialog window will appear where the user needs to enter the values for all the following parameters:
- Parameter (Parameter name taken from the stored procedure or function)
- Data type (Data type taken from the stored procedure or function)
- Value (Specify the parameter value or select the default value)
- Use default (Select to use the default value as defined in the profiled object. If the default value has not been defined, it must be entered manually)
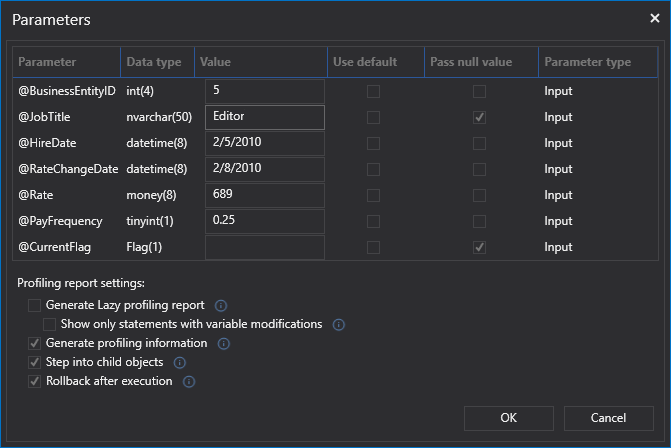
Along with the aforementioned options, additional Stored procedure options are added in this window:
- Generate lazy profiling report (Generate a lazy profiling report when generating profiling information)
- Show only statements with variable modifications (Suppress variables which values don’t change during execution from the report)
- General profiling information (Show general profiling information)
- Step into child objects (Include profiling information from called objects)
- Rollback after execution (Rollback any changes caused by the execution of the procedure)
Among all the aforementioned options is the Generate lazy profiling report option. Using this option, the profiling results will be exported after the code has been profiled. Profiling results are available for exporting in MS Excel or PDF file formats.
Once the parameters are added and the options are selected the stored procedure analysis results will be displayed in the following tabs:
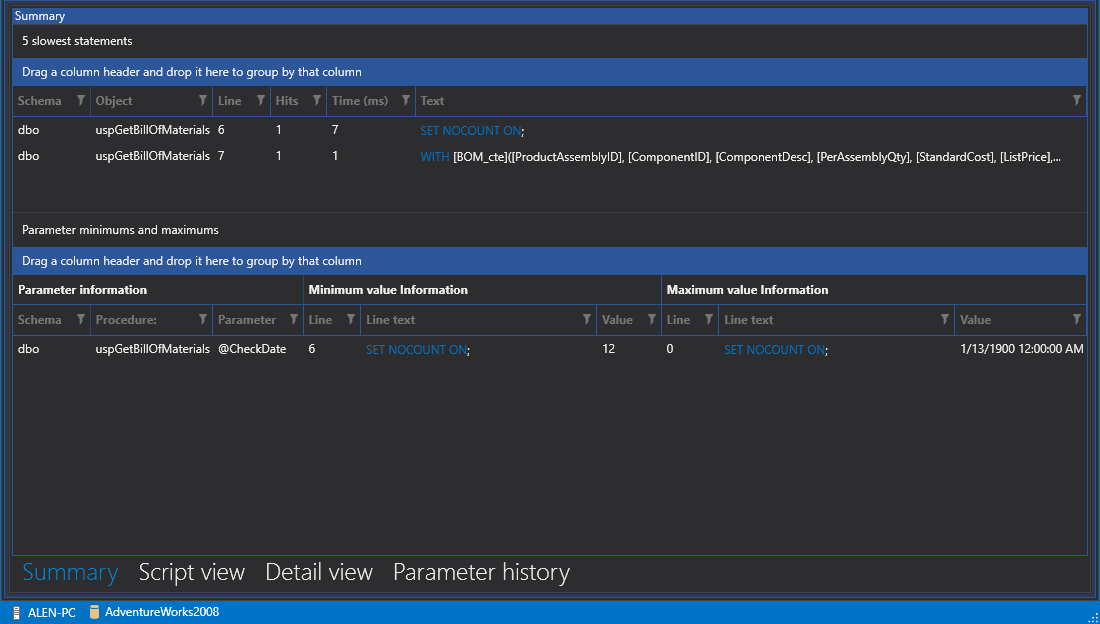
Summary
The Summary tab shows the slowest statements and any child objects that were called. The min/max parameter values and where they occurred will also be shown in the Summary tab in the separated grid with the column names “Parameter information”, “Minimum value information” and “Maximum value information”:
Script view
The Script view tab shows the profiled object and any child objects that were called as well as a visual indication of how long each statement execution took compared to the entire execution time. It also shows how many times a particular statement was executed.

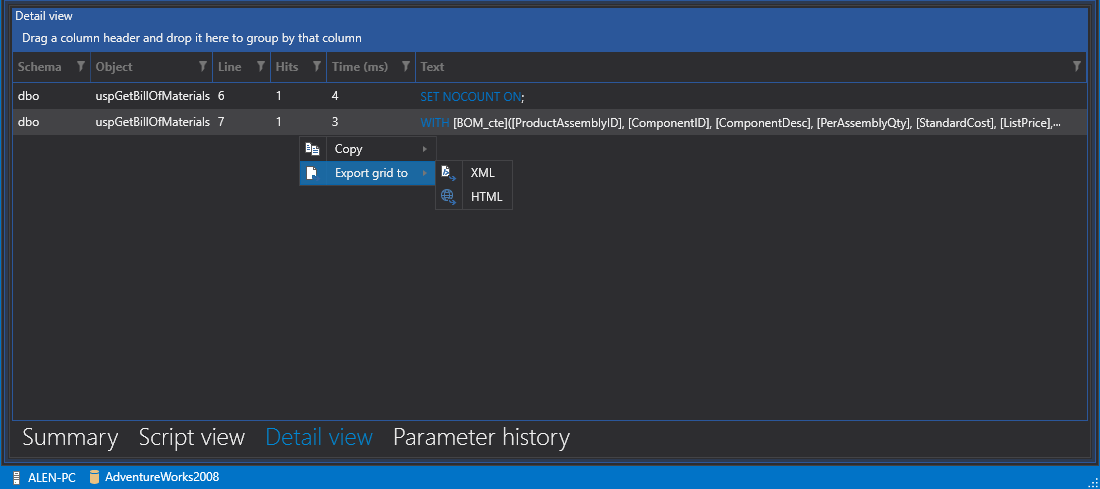
Detail view
The Detail view tab shows every statement that was executed, how long each execution took and the number of times a statement was executed:
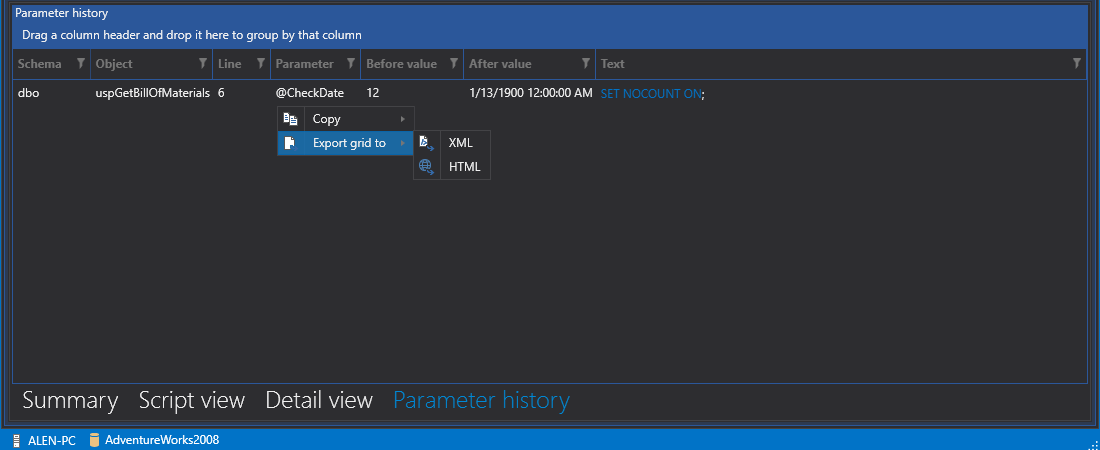
Parameter history
The Parameter history tab shows a list of every parameter that had a value change and where that change occurred along with the previous value:
History statistics comparison
With this new feature analyzing execution history of a query becomes a lot easier. This feature allows comparing previously executed queries in the Execution plan history grid. The comparison process is possible by selecting the desired version of previously executed queries and clicking the Compare button.
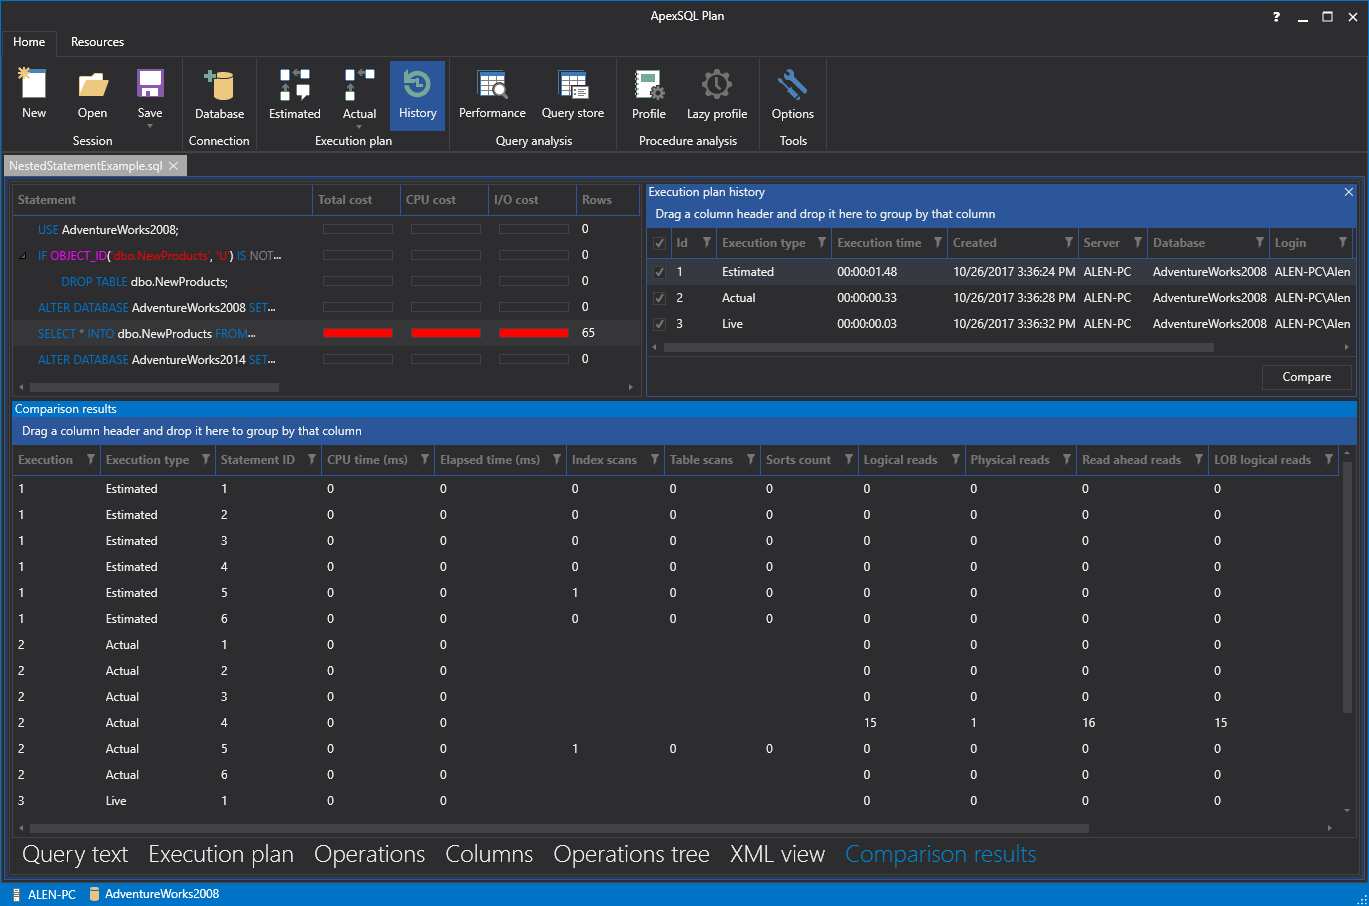
Once the comparison process is done, data by I/O statistics will be shown as a result.
Save and open XML plans
With this feature, query execution plans can be saved in XML format or opened in the same format for performing further query execution plan analysis.
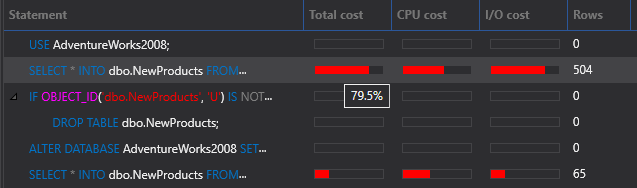
Performance profiling
The Profile bars feature provide a faster and easier insight to the user and their results that are related to cost columns (Total cost, CPU cost, I/O cost). Tooltips are included for each bar that shows the percentage value of the newly implemented bars. This addition is available in the Statements grid.
To keep appraised of new features please see What’s next and the individual product roadmap
October 26, 2017


