


In our most recent performance tests, along with our SQL database comparison tool ApexSQL Diff 2012, we included the same type of application made by one of our competitors. Both were run through the same tests, mounted side-by-side on the same test platform. We ran these performance tests as a part of the ongoing performance improvement efforts, since we understand that performance is a critical factor for customers using our software
The test procedures and ApexSQL Diff 2012 test results were achieved by careful optimizations that created across-the-board improvements. In addition to improvements of core application components, high-performance subsystems are also included
Performance testing and results
We have selected a set of objective metrics, which provide a comprehensive and realistic indication of the areas in which comparison and synchronization applications may affect performance for end users. Our metrics test the application’s impact on common tasks that end users would perform regularly. These tests highlight different performance areas of ApexSQL Diff 2012 and its leading competitor
ApexSQL Diff application performance was researched in three main areas: objects comparison, objects synchronization, and GUI. For testing purposes, a SQL database with 100,000 objects was used as the testing database. The number of SQL objects within the database was based on two main criteria:
- Most ApexSQL Diff users have databases with no more than 100,000 objects. In case the application works well and fast with a given number of objects, fewer objects will not present a problem
- This number of objects allows measuring the real working time in each test and discarding all pre-requisite and post-requisite actions that could be performed by any part of the comparison and/or synchronization processes
We used 20 object types and 5,000 objects of each type: Stored Procedures, Tables, Views, Types, Schemas, Functions, Assemblies, Rules, Xml Schema Collections, Message Types, Contracts, Queues, Services, Routes, Remote Service Bindings, Full Text Catalogs, Partition Functions, Partition Schemes, Roles, and Database Triggers
All tests were done on a local PC. No concurrent sessions or applications were running. MSSQL Server was installed on the local machine. Therefore, no network traffic usage was affecting the performance test.
For each main test category, the following subtests were performed:
- General tests
- Object comparison
- Results display
- Select all/deselect all comparison results
- Object filtering
- Live database
- Complete Comparison
- Complete synchronization
- Backup to live database
- Complete Comparison
- Complete synchronization
- Script folder to live database
- Complete Comparison
- Complete synchronization
- Source control to live database
- Complete Comparison – Source control
- Complete synchronization
Each test was performed three times, and the average was used as the final result. All measurement results are displayed in seconds
General tests
- Object comparison
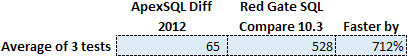
The object comparison test involved comparing loaded objects. This process was optimized additionally in the new ApexSQL Diff 2012, which contributed to its considerably better performance, compared to the opponent’s application
For the purpose of this test, a database with 100,000 objects was used against itself, which resulted in 200,000 objects loaded and compared
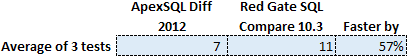
- Results display
This metric measures the amount of time that the application requires to display results in the main grid. Results displaying is generally launched at the start of the comparison process, adding an additional amount of time and delaying the process completion. Shorter results display times indicate that the application has less impact on the comparison and synchronization processes
For the purpose of this test, a database with 100,000 objects was used against an empty database, which resulted in 100,000 different objects populated in the main grid. Time was measured from the moment the comparison process had completed until the main grid was populated and all objects displayed
Stay tuned for more performance results in part 2 that will include: results display, select all/deselect all comparison results, dependencies processing, object filtering, live databases, backup to live databases, script folder to live databases, and source control to live databases
Disclaimer: All product and company names are trademarks™ or registered® trademarks of their respective holders. ApexSQL is not affiliated, associated, authorized, endorsed by, or in any way officially connected with them or any of its subsidiaries or its affiliates
April 19, 2013


