


We are announcing the release of a new SQL Server tool – ApexSQL Monitor that monitors system, SQL Server, and database performance in real time through more than 30 counters
Monitor SQL Server performance
ApexSQL Monitor tracks SQL Server performance on multiple local and remote SQL Server instances. It monitors the most important SQL Server statistics, memory, buffer, and page metrics – batch requests per second, user connections, target and total server memory, buffer cache hit ratio, batch requests, page life expectancy, page reads and writes per second, and more. Monitoring these metrics enables you to identify and troubleshoot performance problems, establish trends, and set baselines
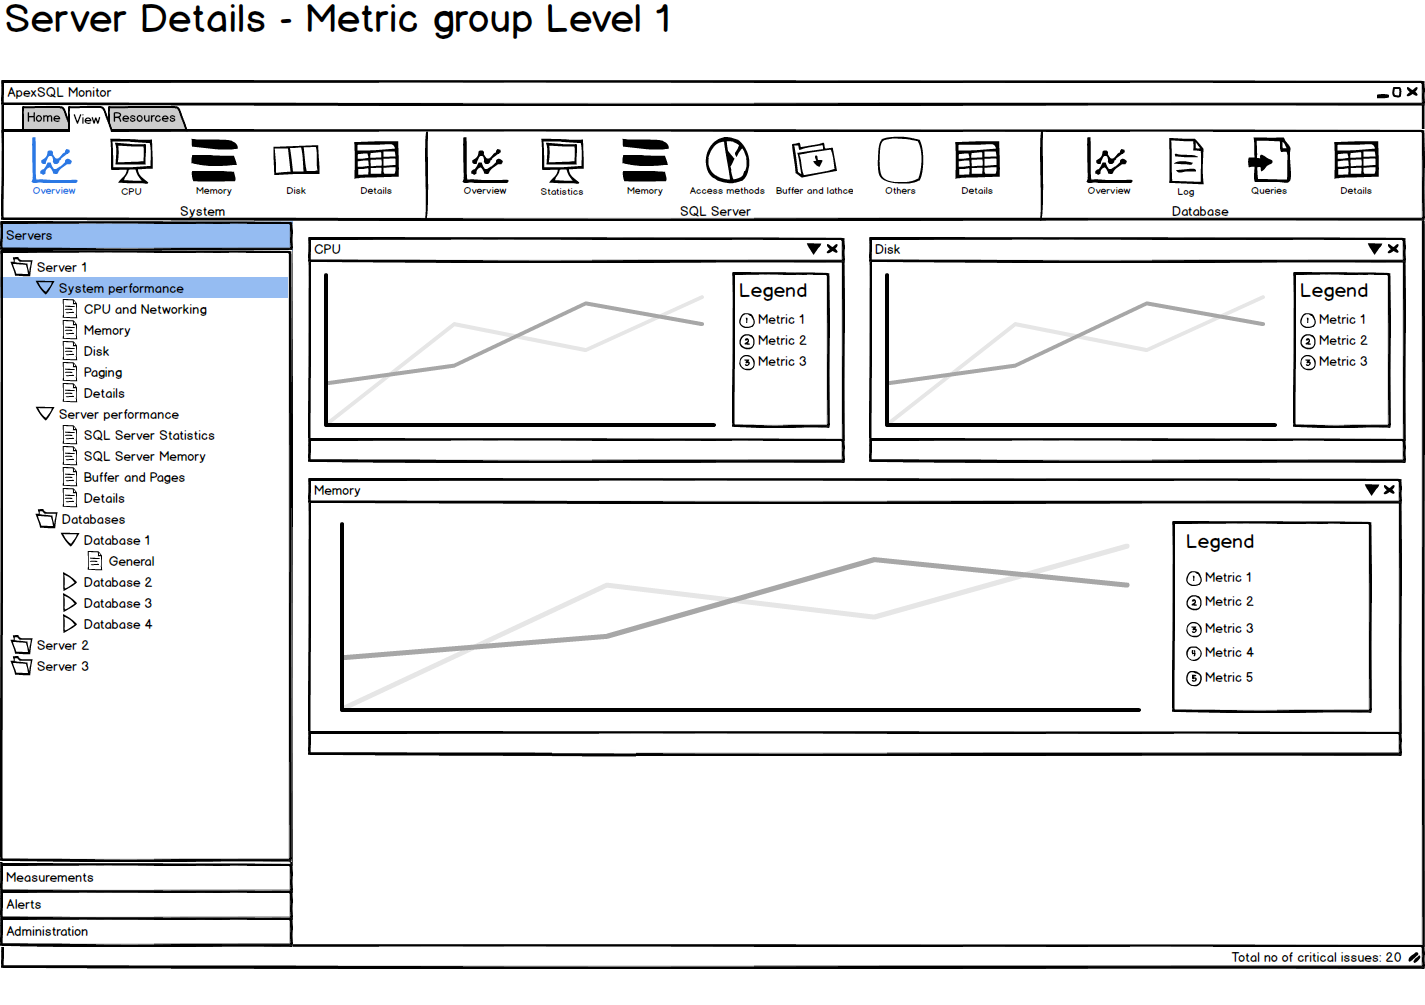
Monitor system performance
ApexSQL Monitor tracks Windows metrics that indicate processor, memory, disk, paging, and network performance, such as processor time, processor queue length, pages per second, average disk bytes per read and write, available megabytes of memory, and more. These operating system metrics provide information needed to identify and fix performance bottlenecks and deadlocks
Monitor SQL database performance
Another important performance counter category consists of database-related counters. ApexSQL Monitor can track SQL Server database metrics on multiple local and remote SQL Server instances. It enables you to watch data file (MDF) and log file (LDF) size changes, log file growth and total database size changes. Tracking file size trends can help you plan hardware capacities to avoid insufficient free space situations
Real-time monitoring
Real-time monitoring provides the current values of monitored performance metrics. The values are updated as soon as a change occurs. Watching performance metric changes in real-time enables you to be up to date with server state and ready to act if needed
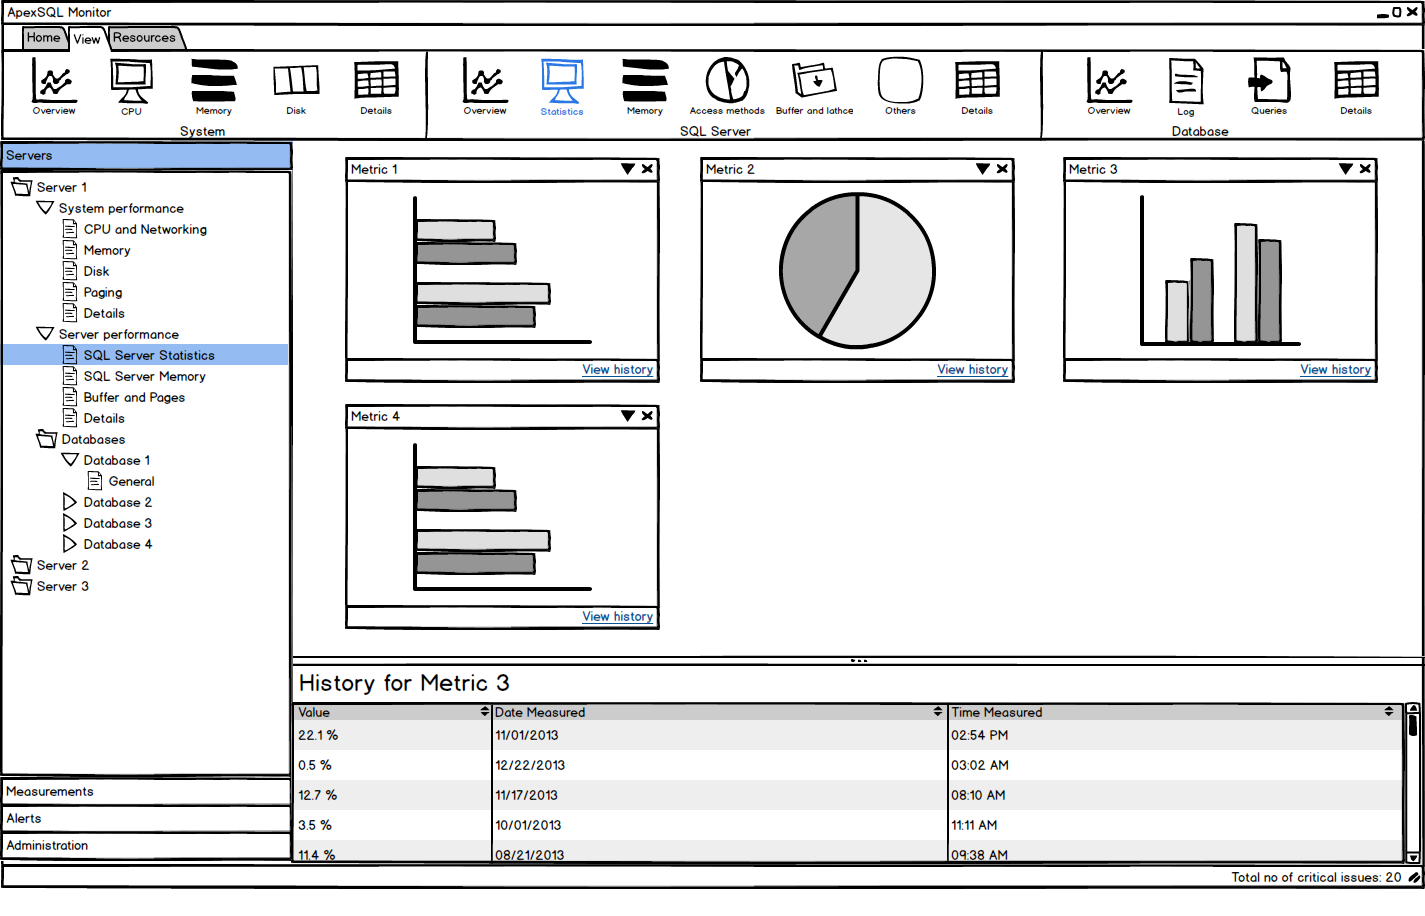
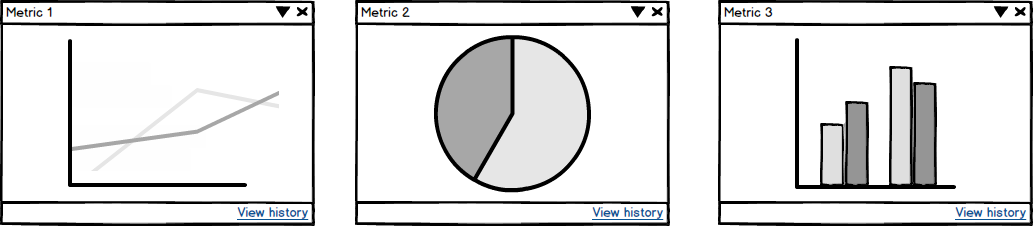
Comprehensive dashboard
All monitored SQL Server performance parameters are presented in user-friendly and easy to read graphs. Depending on the metric type and information that it presents, the metric is presented in a column, line, or pie chart. The most important metrics for a SQL Server instance can be presented in a single window, which enables watching multiple metrics at the same time
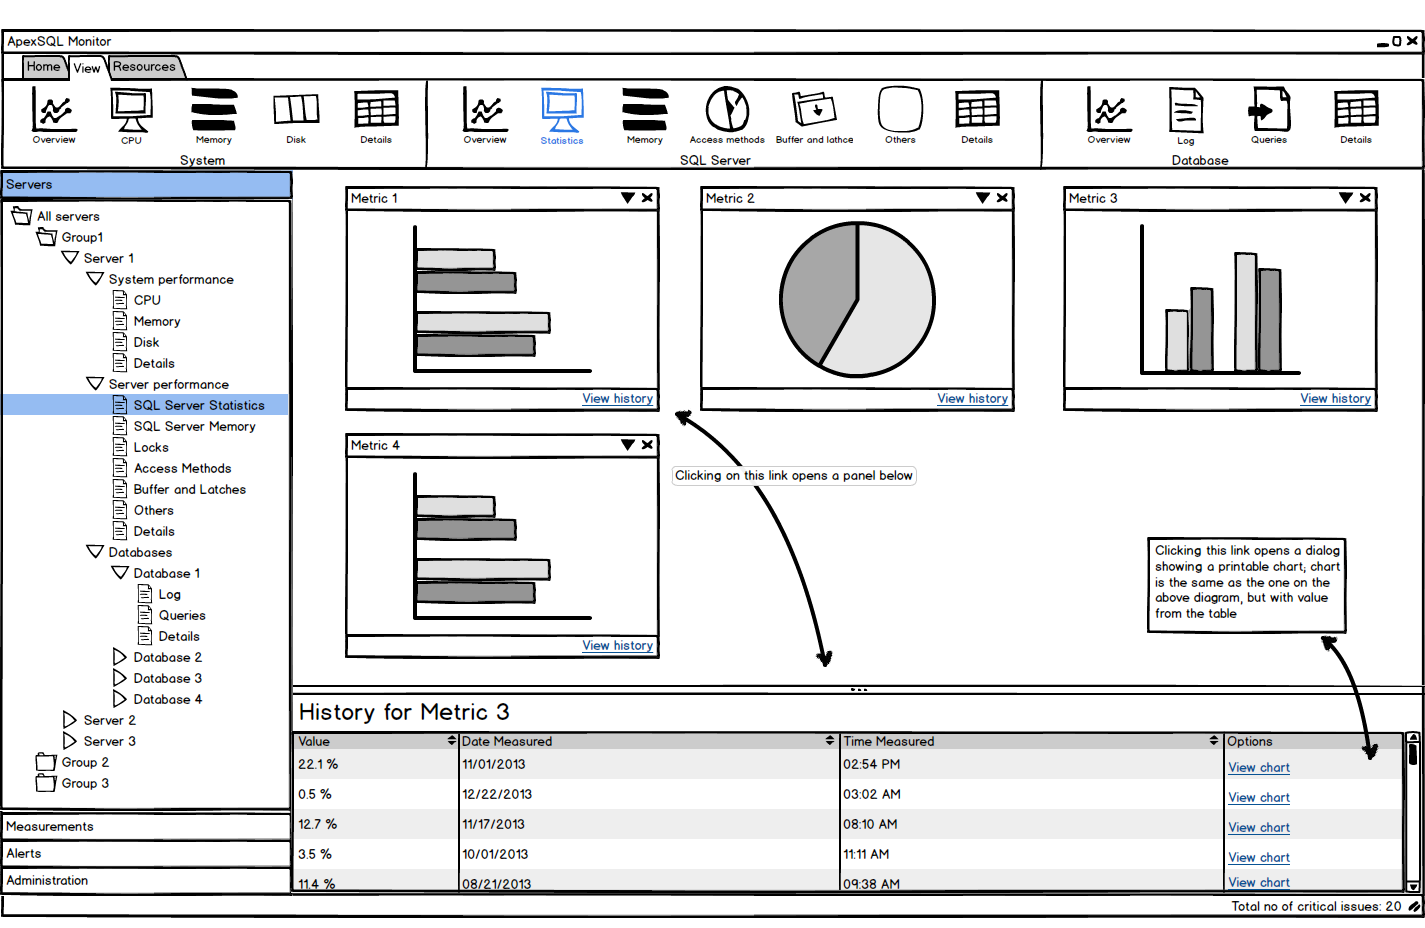
Metric history
Besides real-time monitoring, ApexSQL Monitor saves all monitored parameter values in a repository. These values can be viewed and analyzed at any time. Historic data can help you identify specific behavior in the past, behavior patterns, values for peak and normal operation, off-peak hours behavior. For the metrics that don’t have a specific threshold, analyzing metric history is necessary for setting a metric trend and baseline
Central repository
All captured metric values are automatically stored in a central database repository – a single SQL Server database, despite the number of SQL Server instances, system, and databases monitored. The central repository provides easier data maintenance, backup creation, and protection, as well as querying of all saved values using T-SQL scripts
The central repository is also used to store all configuration data and options
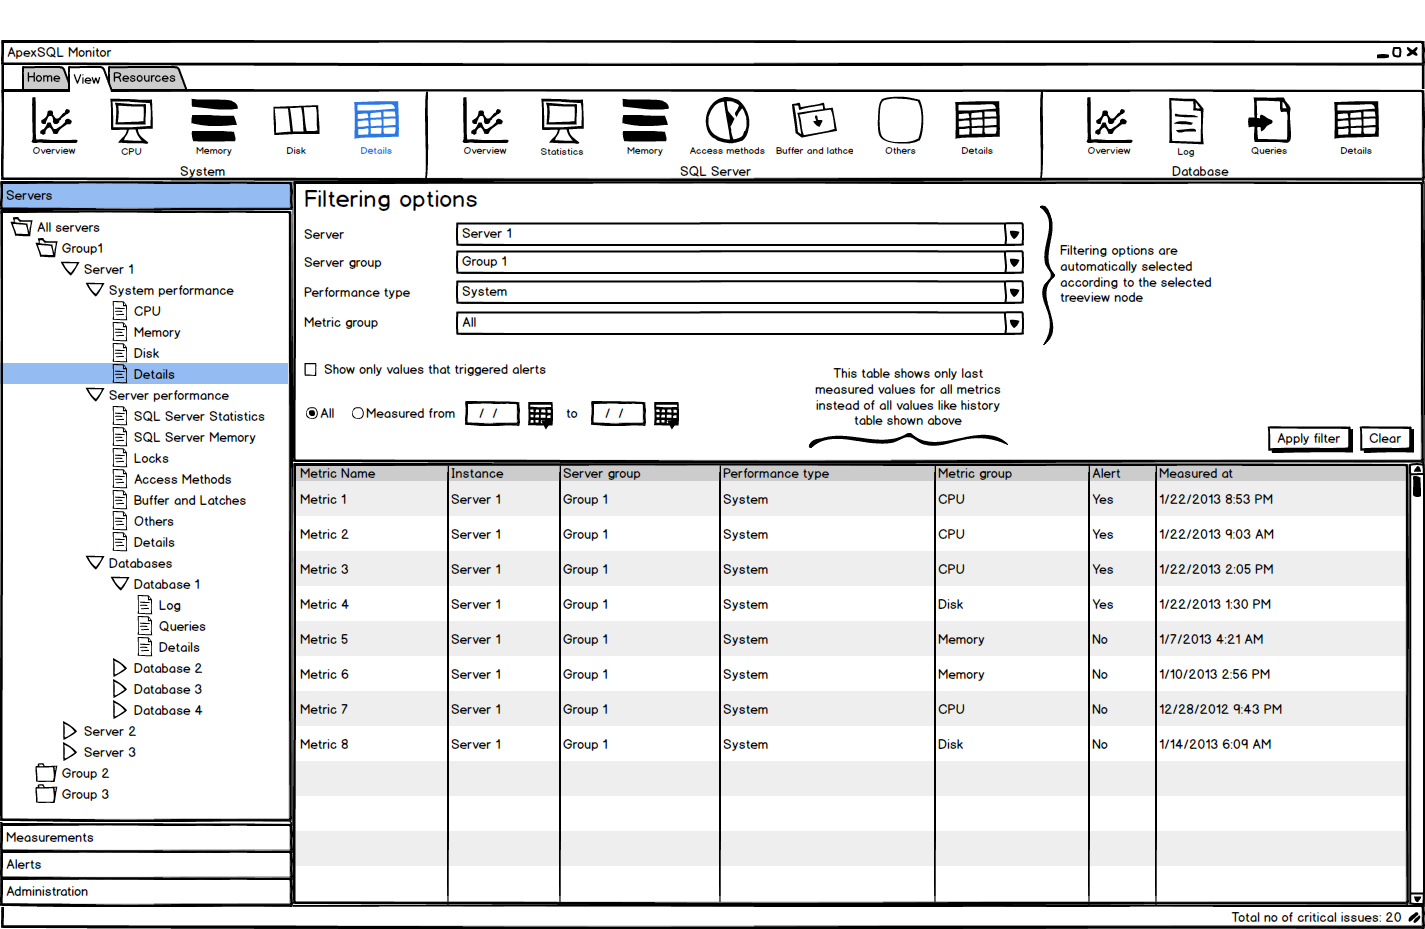
Metric filtering
All performance metrics can be organized into groups for easier referencing and managing. Additionally, they can be filtered by a component category – processor, disk, memory, etc. This provides easier analysis and drills down to a specific metric
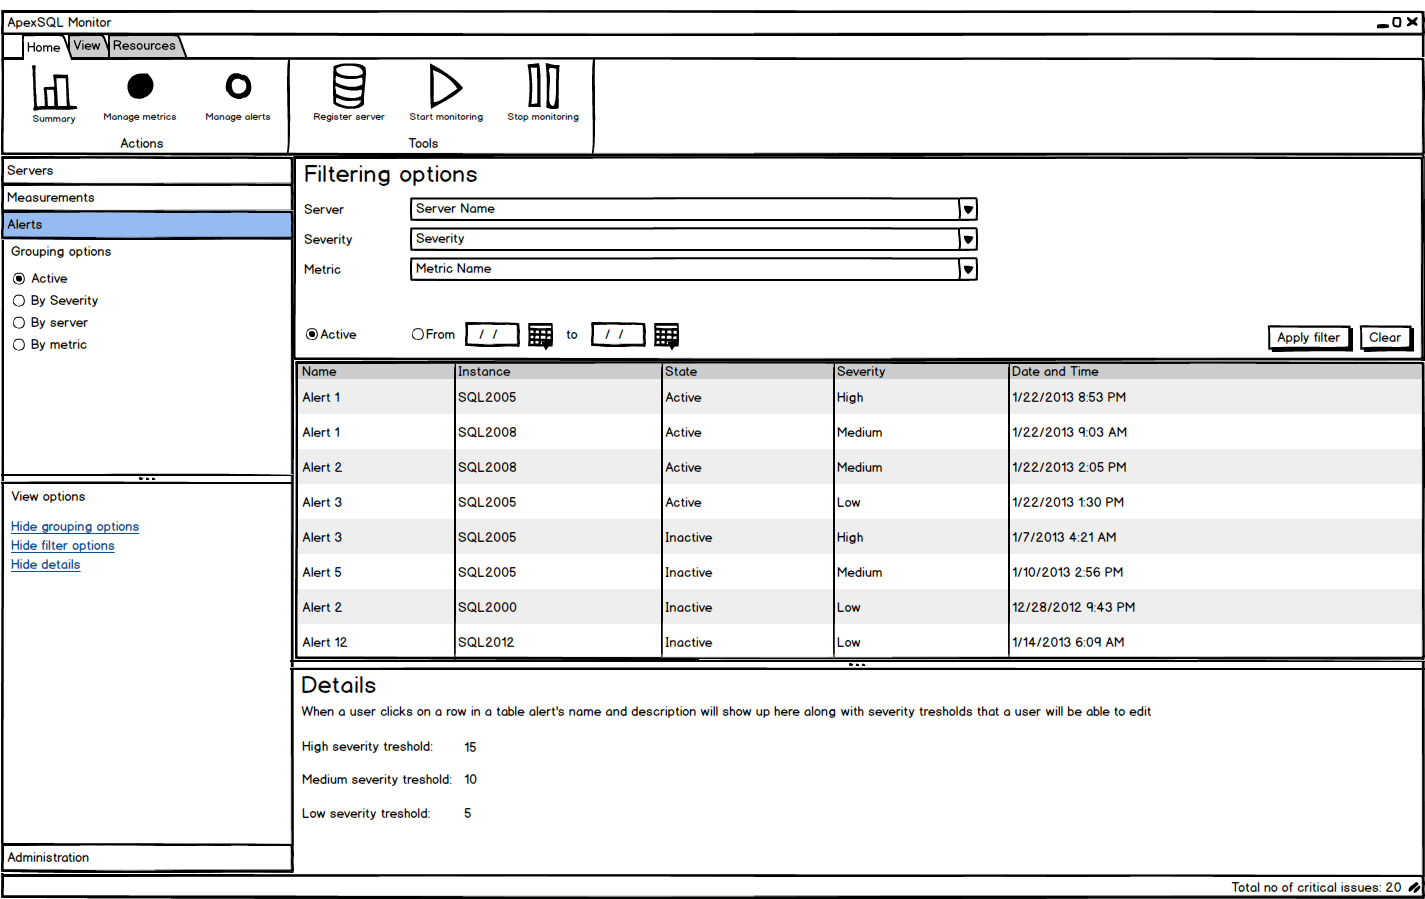
Alerting
Whenever a metric exceeds or falls under a predefined threshold value, ApexSQL Monitor will create an alert notifying you about the critical issue. Such on-time information enables quick and efficient troubleshooting actions. Similar to monitored metrics, filtering and grouping are available for alerts. Alerts can be grouped by severity (low, medium, and high), server, and metric name
Agentless monitoring
ApexSQL Monitor doesn’t install any agents to collect performance metric values. The data is collected using the tools already available in the operating system and SQL Server. This approach eliminates the need for installation of any additional agents, thus avoiding the situation when agent installation is not possible due to insufficient permissions and company policies
Supported SQL Server versions
Full support for SQL Server 2012, 2008 R2, 2008, and 2005
January 21, 2014


