


ApexSQL Monitor has a great web based UI with a lot of value added features, e.g. graphs, alerting, etc but the majority of the IP associated with this product is underneath the hood, primarily the engine algorithms that curate performance monitoring data. The result of this is manifest in the data collection repository.
The great ApexSQL Monitor UI notwithstanding, for various reasons some teams might want to query and even report against this repository directly. Thankfully, the ApexSQL Monitor team has made this very easy to do. This article will walk you through a turn-key system for direct reporting against the repository
Background
ApexSQL Monitor as a SQL Server performance monitoring tool is capable of track almost any system, SQL Server and database performance metrics including the real-time alerting and all the performance data collected are stored in the central repository database Considering the amount and variety of data collected and processed, the structure of the ApexSQL Monitor repository database is quite complex and the data it contains wasn’t originally designed to be directly queried, aka human readable
Solution
They ApexSQL Monitor team has created a collection of over 15 queries and SSRS reports to cover the most popular reports including reports on System/SQL Server metrics, Statistical reports on SQL Server Agent status, alerts and indexes statistic and state, Wait statistic etc.
In addition to that we’ve created an extensible system where queries and reports can be easily customized and even new reports can be created from scratch. This can be accomplished via a layer of “helper” functions, the team has created, to translate repository data into reportable information and otherwise facilitate rapid report creation.
The following articles are presented to help users to get the needed data displayed as reports without having to know and/or understand the repository database structure, data correlations and forms within the repository database and finally, one doesn’t even have to be an advanced user to implement reports provided in articles
How to create custom SQL Server performance reports – Part 1 (Performance and status metrics)
How to create custom SQL Server performance reports – Part 2 (alerts, Indexes and databases)
To make reporting as easier as possible, we have created two sets of SQL functions, Helper and Reporting functions
Helper functions are designed to allow the user to perform conversion of system data stored in the repository (like uniqueidetifier data) to a human readable format and vice versa.
For example, helper functions will decipher data stored in a numerical form (i.e. database state 3) into a readable information (e.g. “Recovery pending”). And inventory and description of helper functions can be found in the article ApexSQL Monitor ad hoc reporting Helper functions inventory, descriptions and examples
Here is an example of a report that will return the specified metric value and time when that value is collected suitable for displaying in charts, and on this example it is easy to notice the difference between using and not using a helper function
Query without the helper function which requires the use of a value. The highlighted part is the guid, the value, that identifies the specific metric in the repository database
SELECT X ,Y –-X is time and Y is value of the metric
FROM
[ApexSQL].[MeasuredValueLineChart](ApexSQL.SourceNameToId(@ServerName), ‘99CAE97A-5ABE-4C18-972e-6463114 FC4F9’, @StartDate, @EndDate, 0)
Next we’ll show the sub-section of the query with the helper function which allows for the use of a literal
ApexSQL.SourceNameToId(’ % OF Processor time’)
The highlighted part is the regular metric name, the literal, that can be used when with the helper function
Reporting functions are designed to eliminate the user from having to learn the database schema and structure of the data dependencies within the repository database. Reporting functions will get all the needed data from the adequate tables and perform necessary calculations on behalf of the user
Here is an example of the report where the reporting functions is used
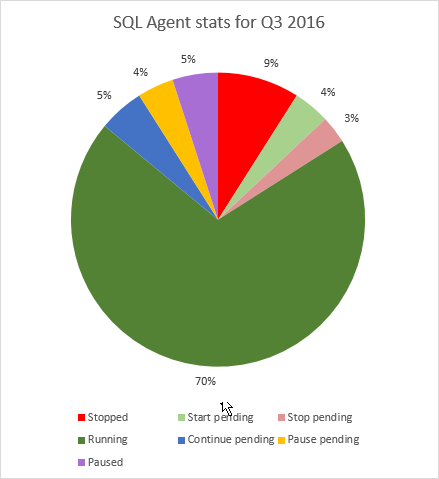
SELECT ApexSQL.AgentStateTypeConverter(X) AS STATUS
	,Y
FROM [ApexSQL].[MeasuredValuePieChart](ApexSQL.SourceNameToId(@ServerName), ApexSQL.MetricNameToId('SQL Server agent status'), @StartDate, @EndDate)
The ApexSQL.MeasuredValuePieChart function is called here and it will retrieve all the necessary data related to the SQL Server Agent status from the repository database, then recalculate those data to be presented as the percent of the total value for all states of the SQL Server Agent. As its name states, it is particularly suitable for displaying the data in the pie chart form
All that user has to do here is to replace the parameters with appropriate values (usually handled via reporting application or SSRS):
@ServerName – Enter the SQL Server name for which the report is
@StartDate, @EndDate – Enter the start date and end date for defining the period to be represented in report
For more details on Reporting functions, see the ApexSQL Monitor ad hoc reporting functions inventory, descriptions and examples article
Reports
The team has created SSRS reports for all of the popular monitoring queries
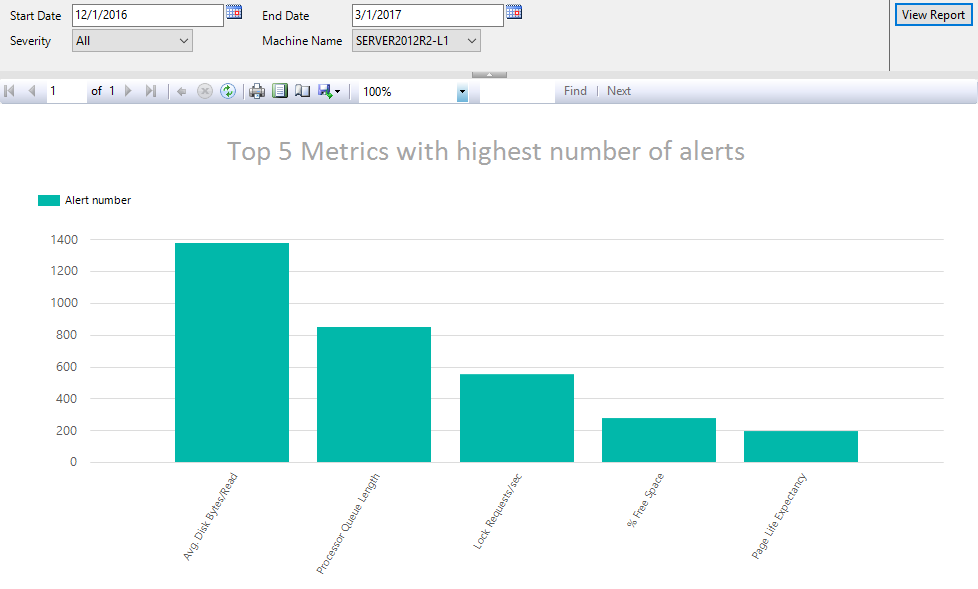
The provided SSRS reports are customized in a user-friendly manner by providing users the needed parameters to be selected from the list of valid parameters from drop-down menus, including some validation
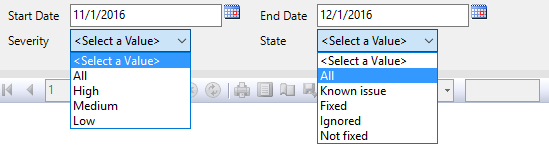
Here are some examples of the reports

Downloads
Please download the script(s) associated with this article on our GitHub repository.
Please contact us for any problems or questions with the scripts.
February 14, 2017


