


In the next release of ApexSQL Monitor 2015 R3, a new feature capable to generate various monitoring reports will be implemented.
Reports are divided in the three main sections, with their subsections:
- Statistics
- Summary
- Health

Below, some shots for each report type are presented
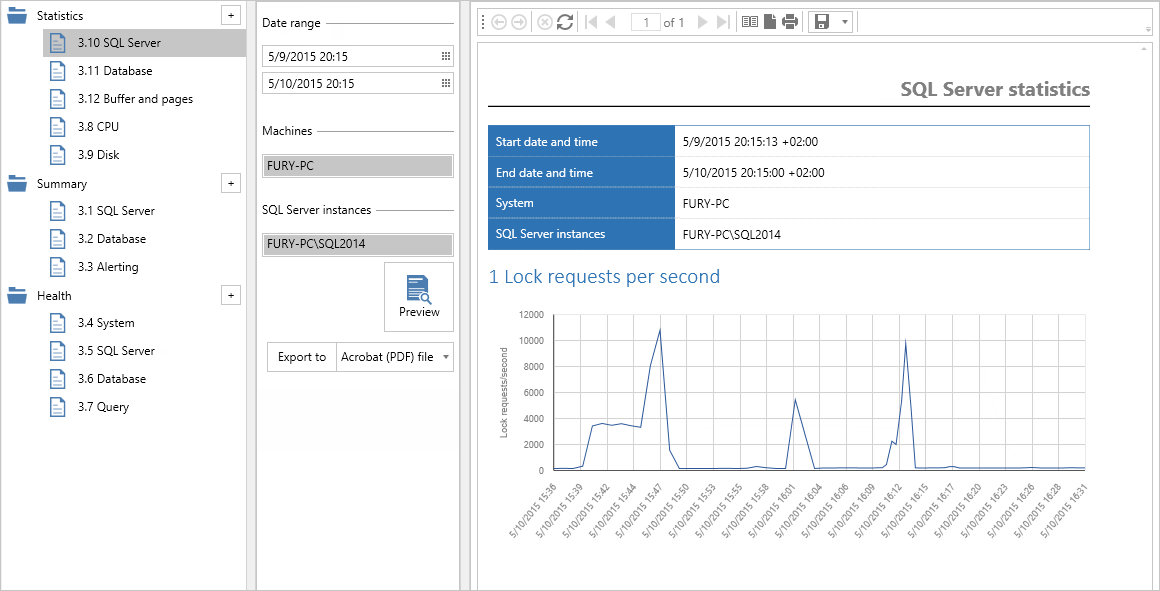
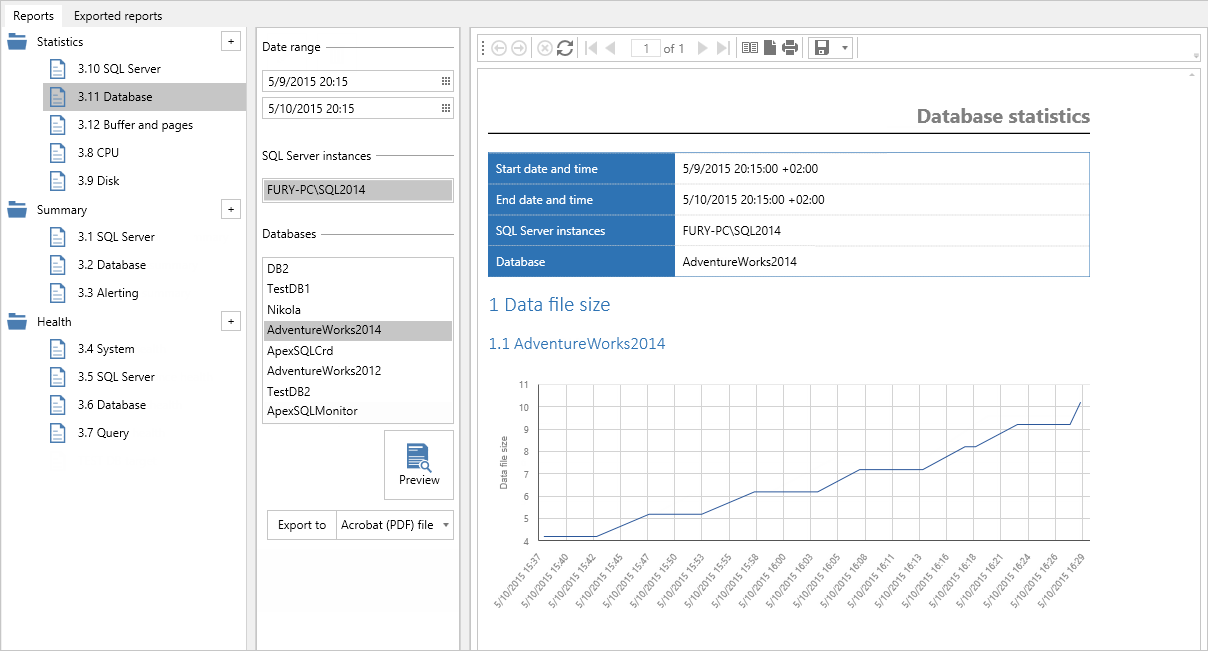
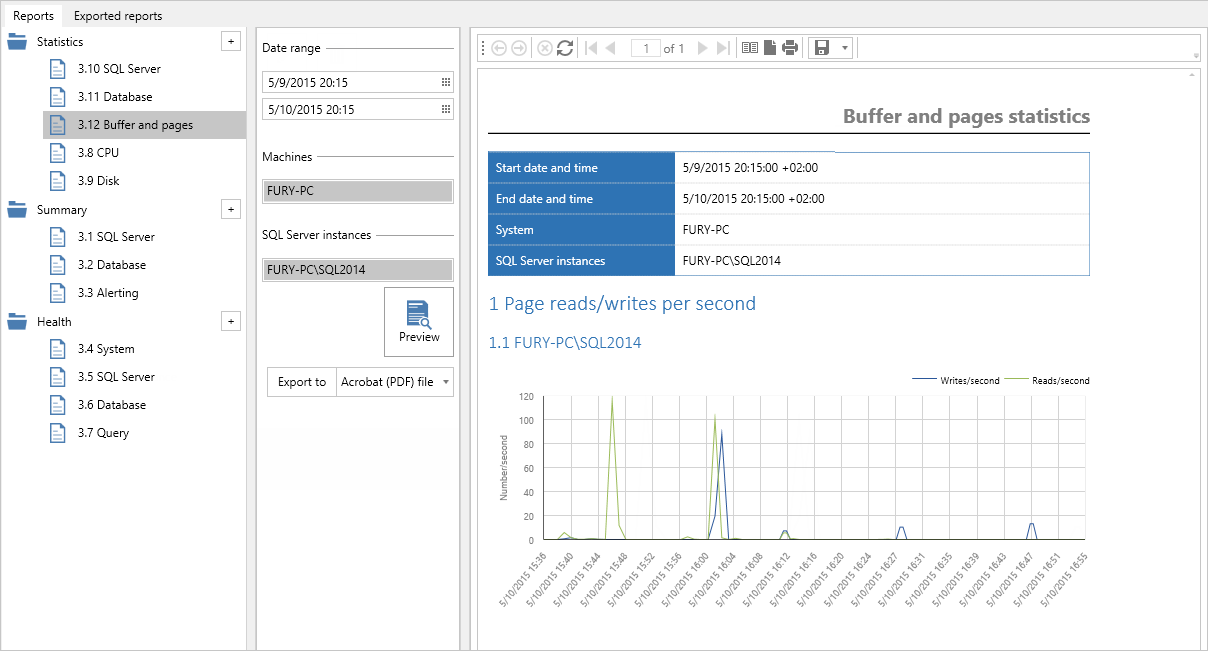
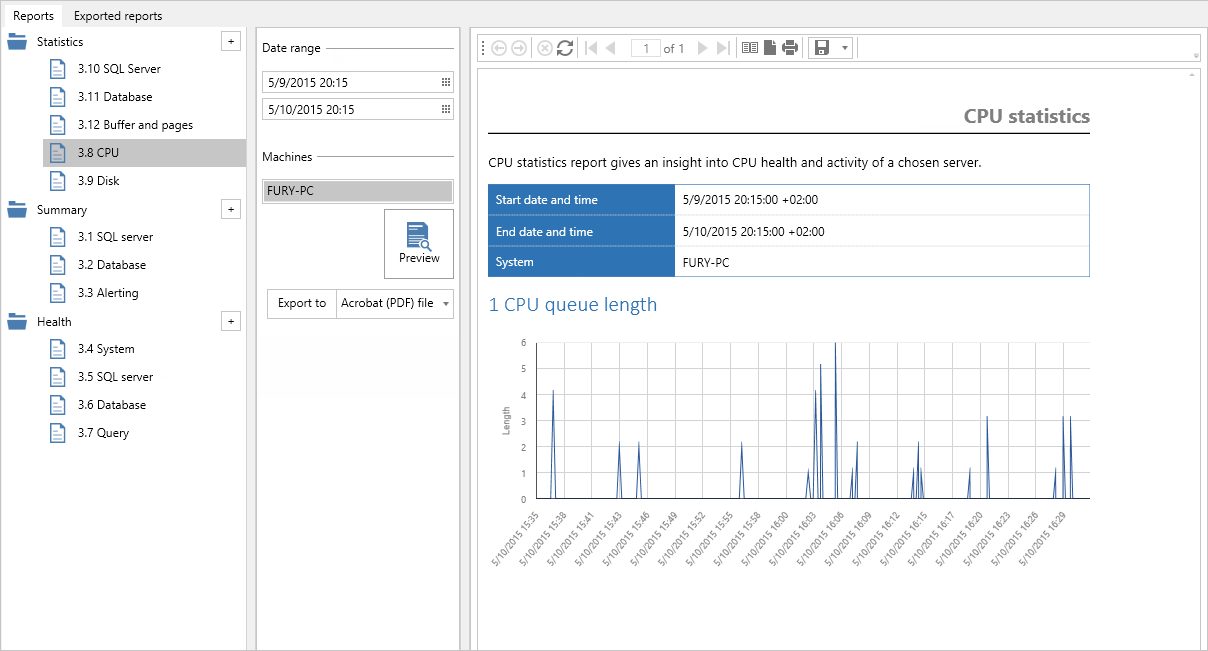
The Statistics section is focused on statistical report types related to the SQL Server, Database, Buffer and pages, CPU and Disk reports
SQL Server
Database
Buffer and pages
CPU
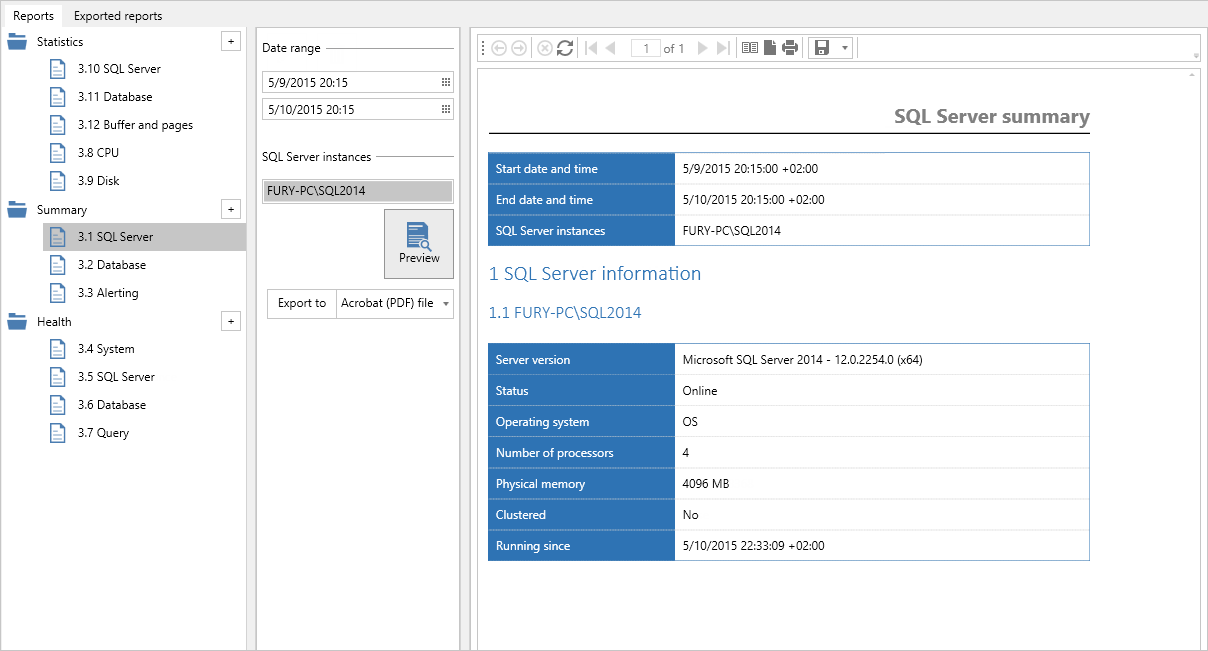
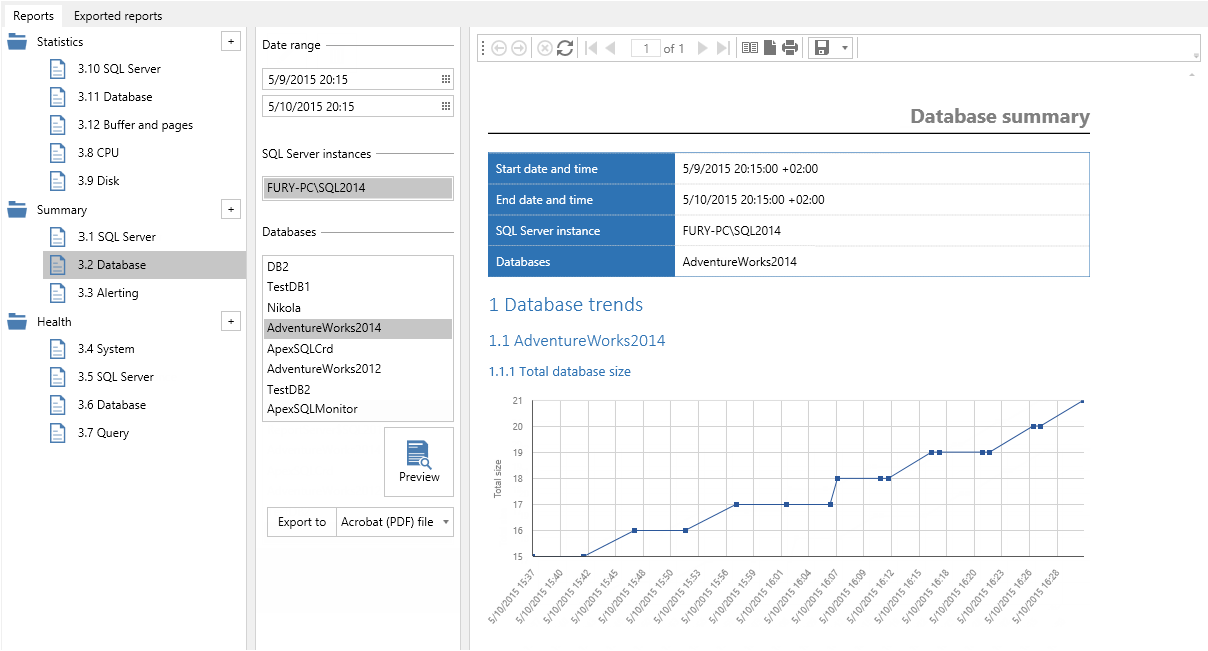
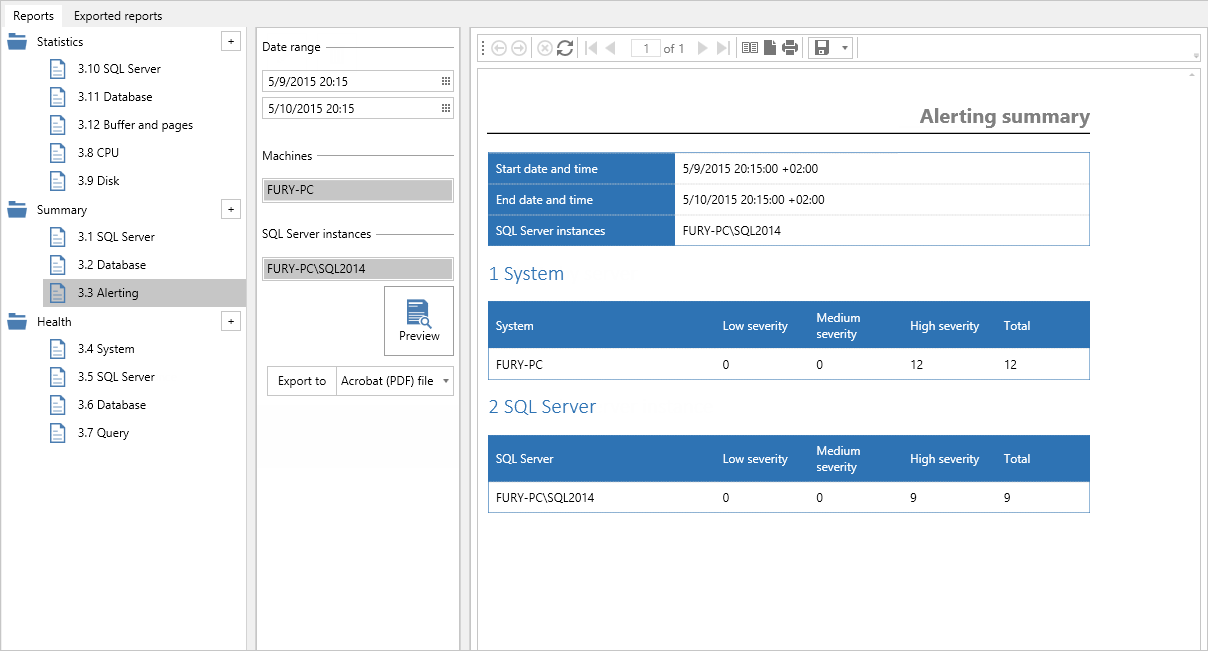
The Summary section is focused on basic summary information presented via the SQL Server, Database and Alerting reports
SQL Server
Database
Alerting
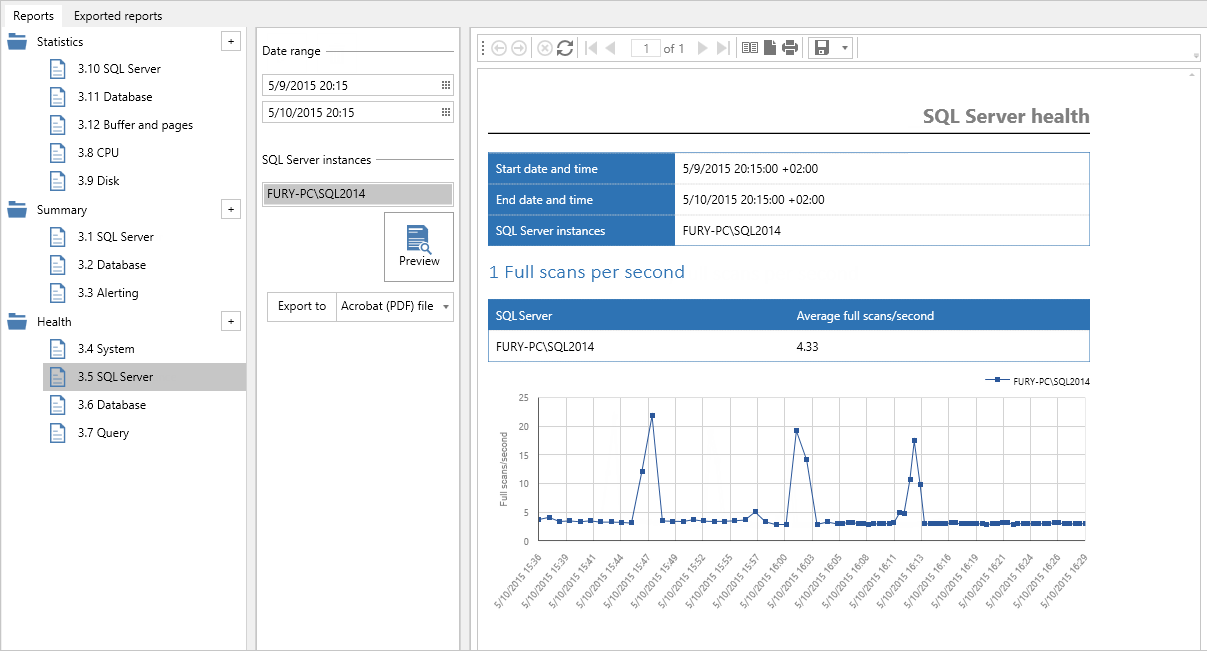
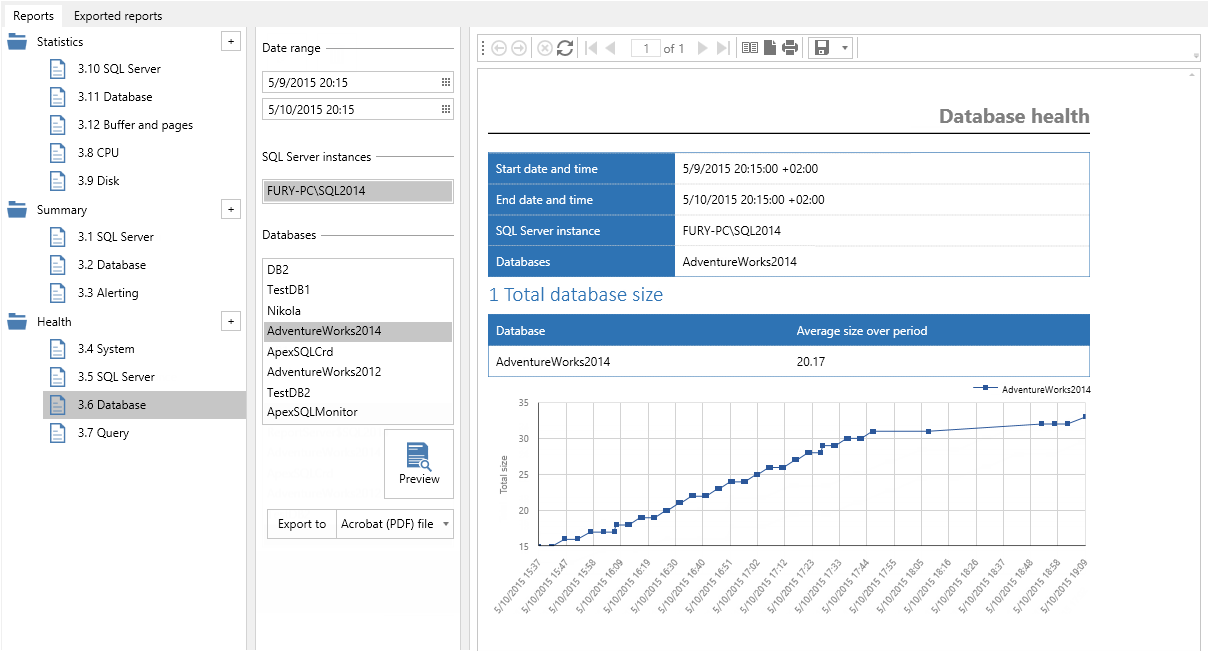
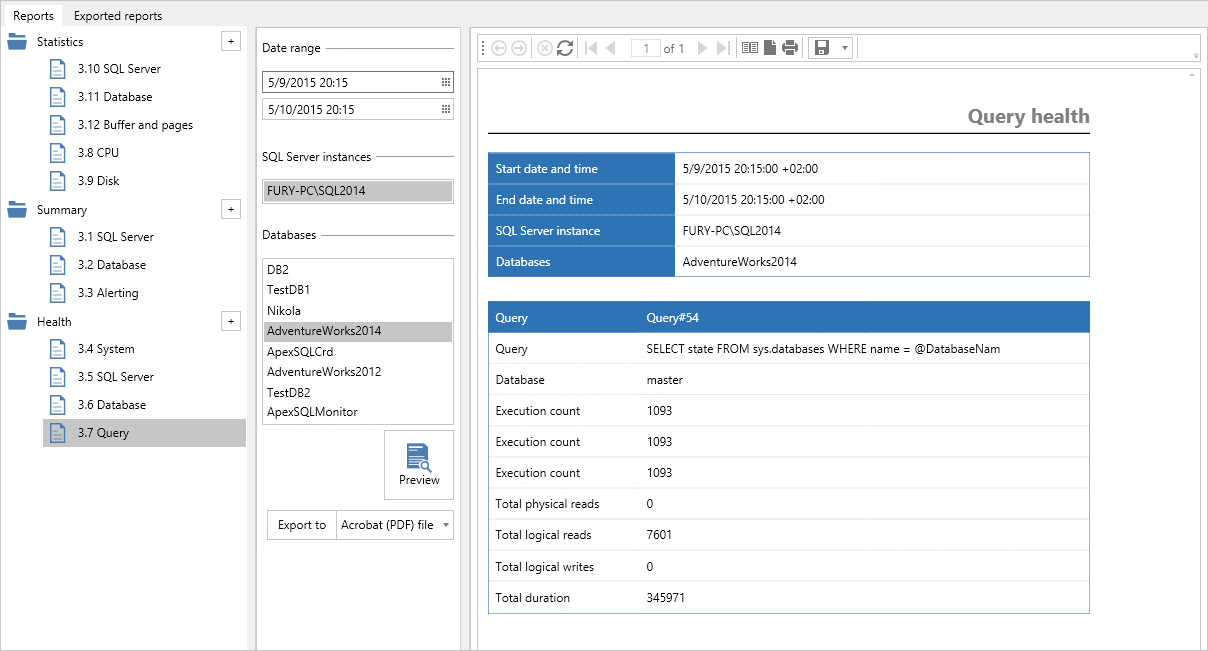
The Health section provides reporting for the System, Server instance, Database and Query health status
SQL Server
Database
Query
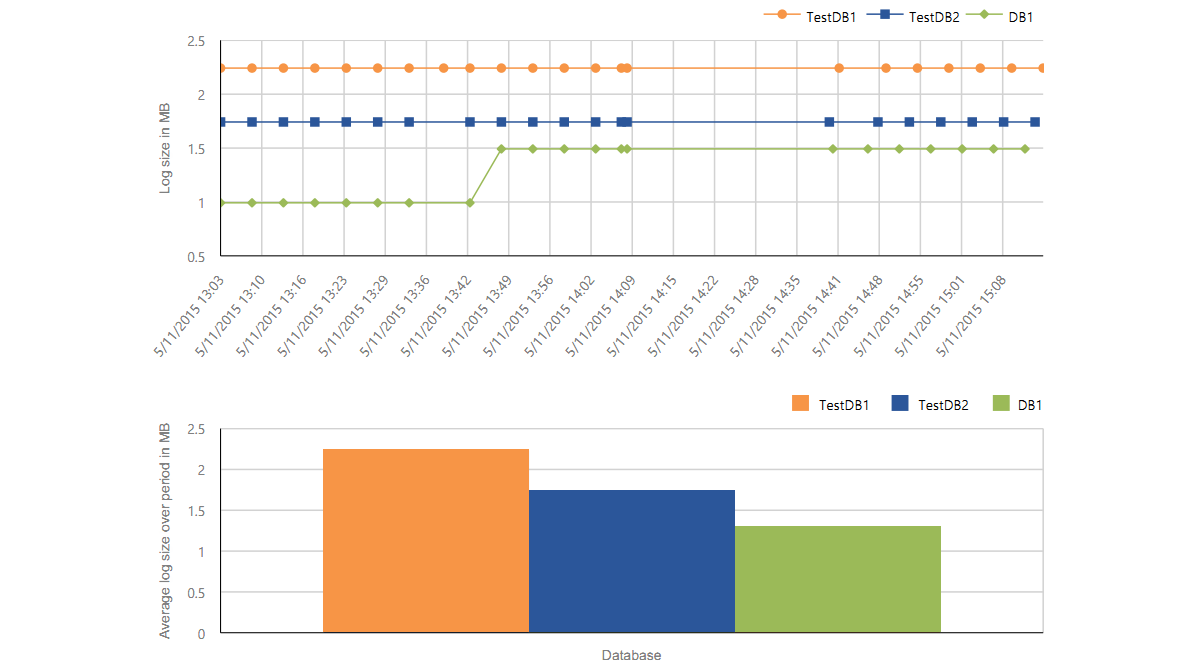
All reports contain charts for graphical representation of specific data documented in the report. Here is an example from the Database health report which shows transaction log file size and average transaction log file size in selected time periods for specified SQL Server databases
May 13, 2015


