


The next release of ApexSQL Monitor 2015, version R3 planned for late May, will include an integrated query execution plan viewer, which can be accessed via the Query waits tab.
The Query execution plan viewer graphically displays the actual execution plan that the SQL Server Database Engine uses to execute the queries, thus enabling deeper analysis of problematic queries. The initial version of this feature will offer an easy way to analyze queries and it will be improved and become more sophisticated in future versions.
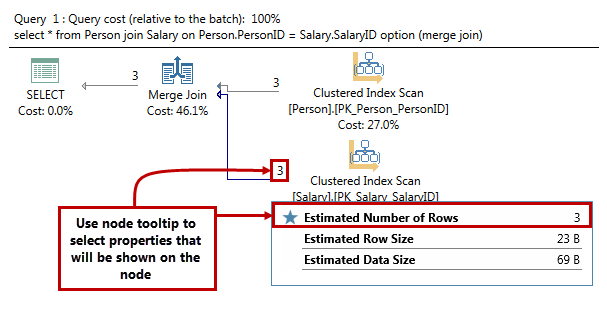
Node display
The query execution plan nodes displays the most important properties such as the estimated number of rows, estimated row size and estimated data size. Each of these properties can be switched on and off, by selecting appropriate property name in the node tooltip. The selected properties will be marked with a star.
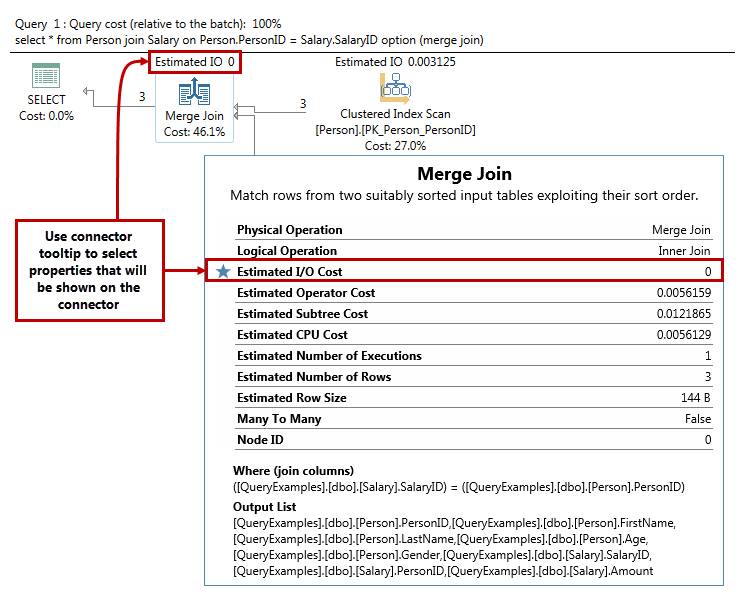
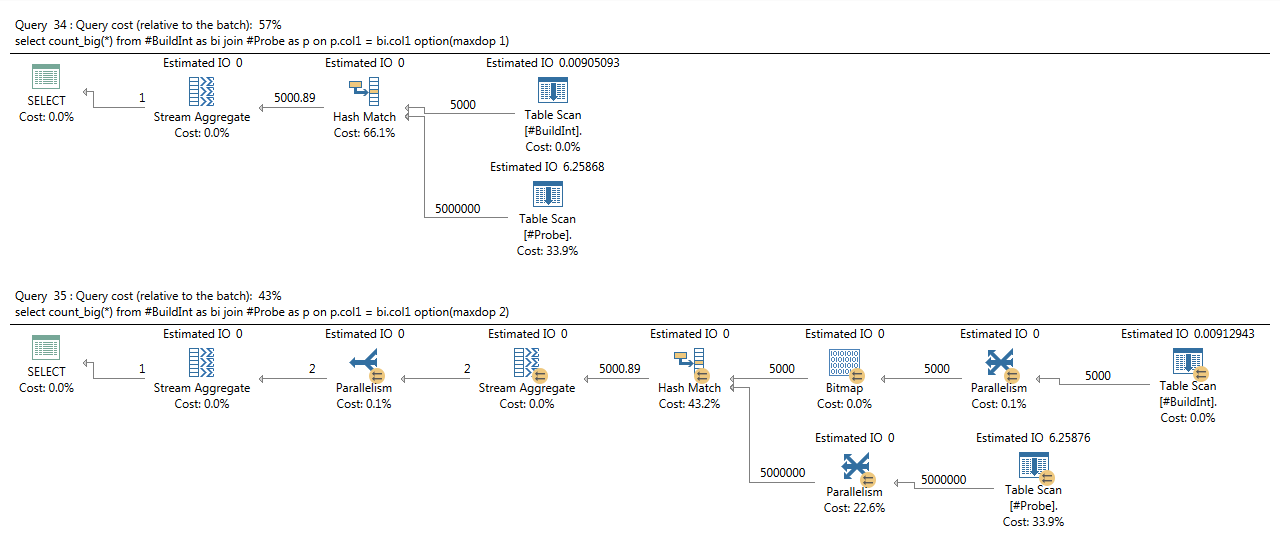
Connector display
As well as nodes, connectors can display various properties such as estimated I\O cost, estimated CPU cost, logical operations and many others. Each of these properties can be switched on and off, by selecting the appropriate property name in a node tooltip.
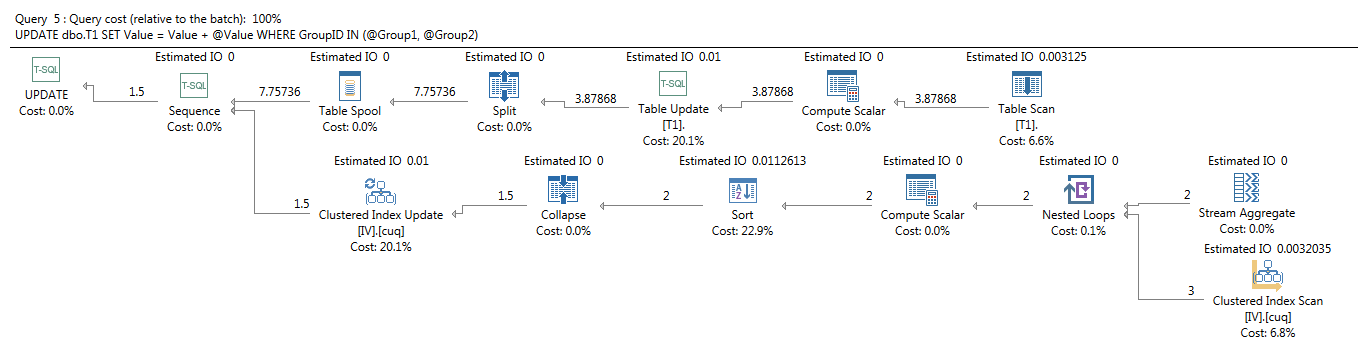
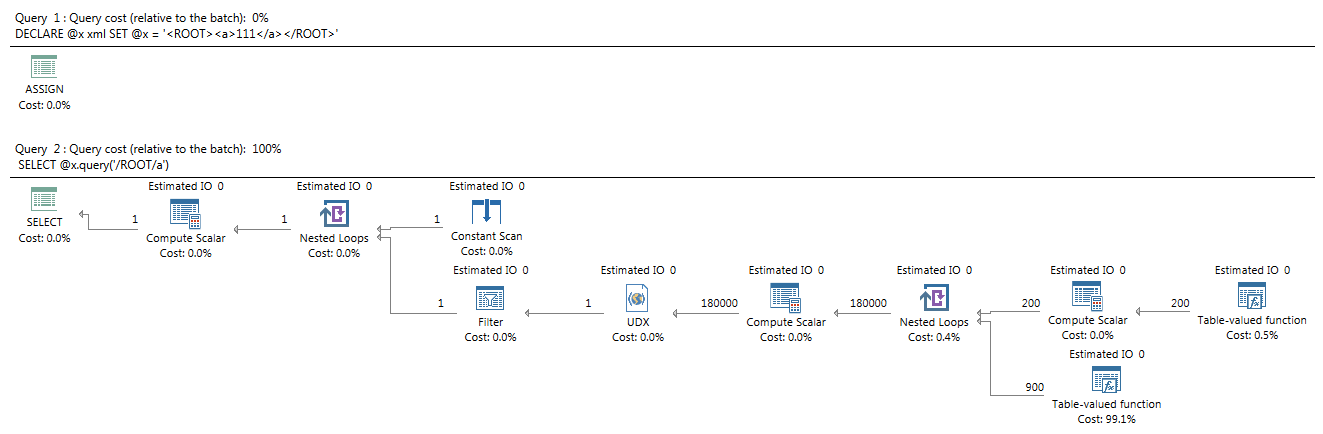
Here are few example plans:
May 11, 2015


