


In the initial version of our new product ApexSQL Plan 2017, a number of useful features and enhancements will be included.
Query execution plan graphics
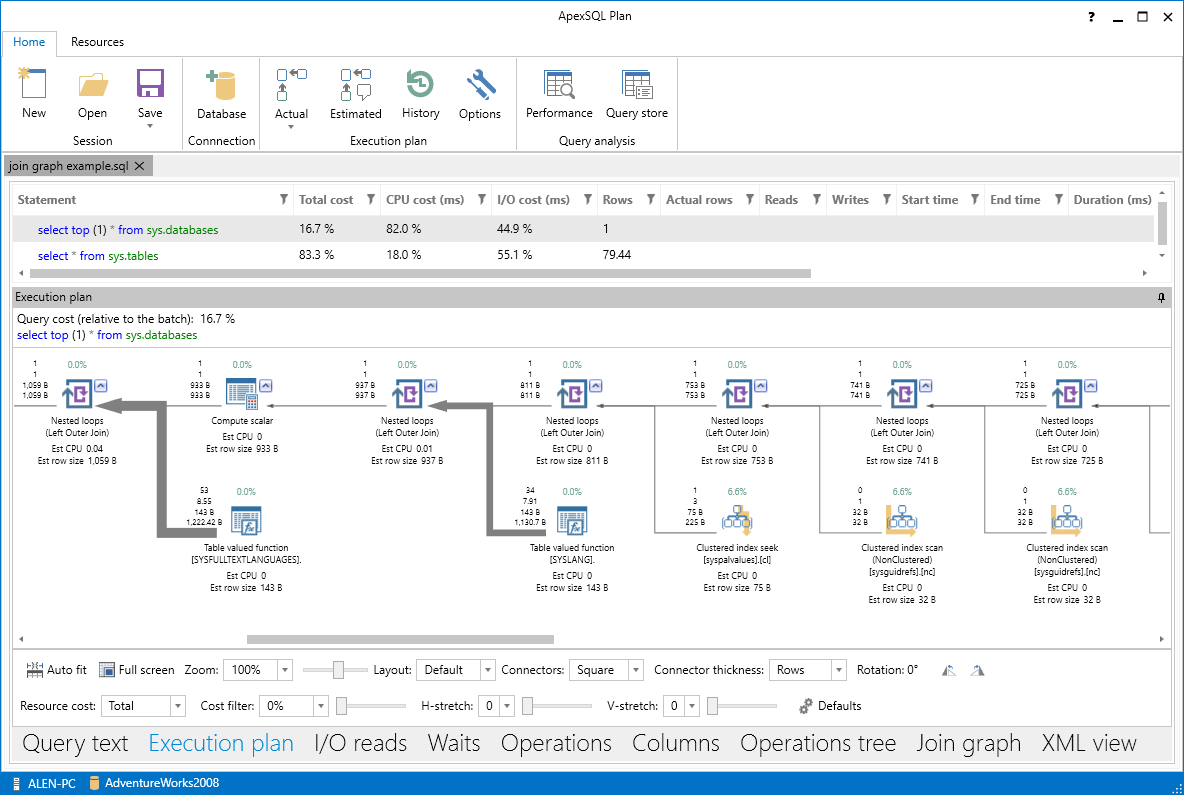
One of the main features of ApexSQL Plan is the ability to create and manipulate with actual or estimated query execution plan graphics. It is also possible to manipulate with individual parts of query execution plan, such as nodes and connectors.
Customizable operation and data flow properties
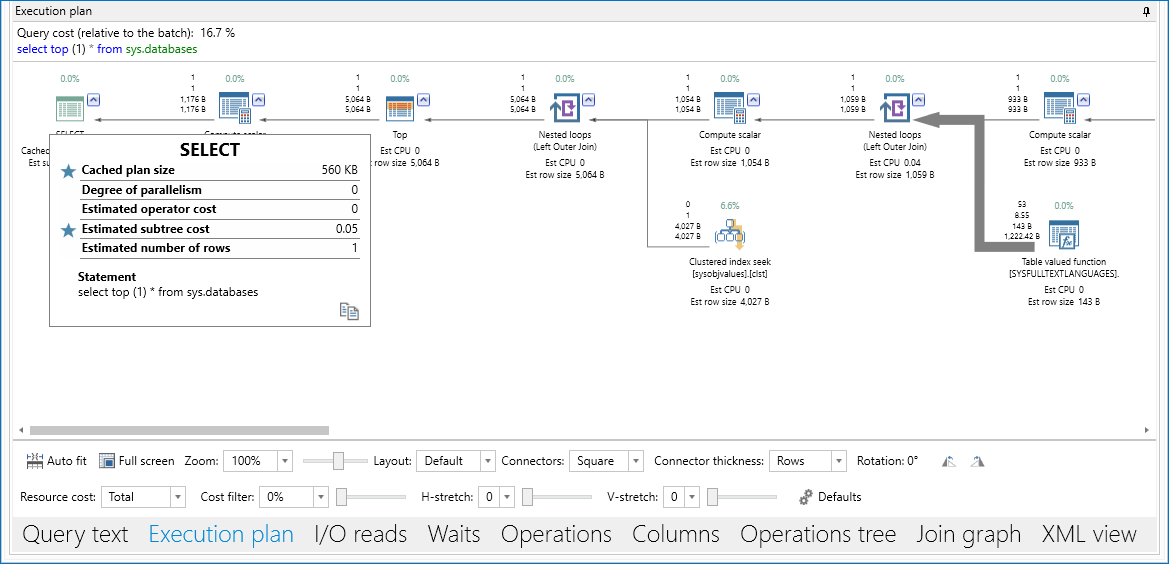
This feature allows users to manage property details for each operation in the execution plan. These details can be included or excluded from the tooltip by clicking on the star button which is a “on/off switch” for each property in the tooltip.
Details for each data flow in query execution plans are also customizable. Using the same principal, include or exclude properties and review them in the tooltip.

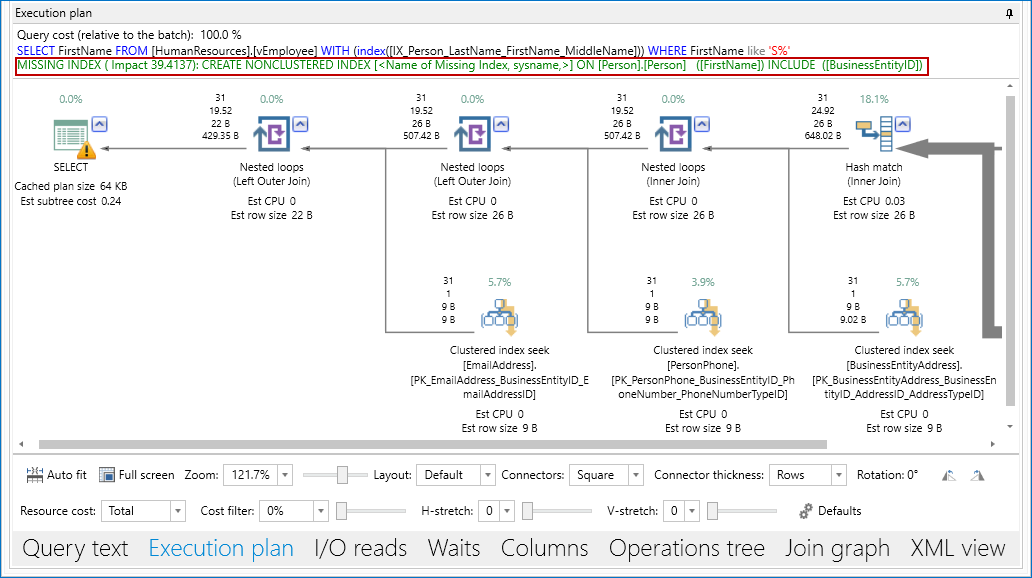
Another impressive feature in the query execution plan view is that it can identify a missing index.
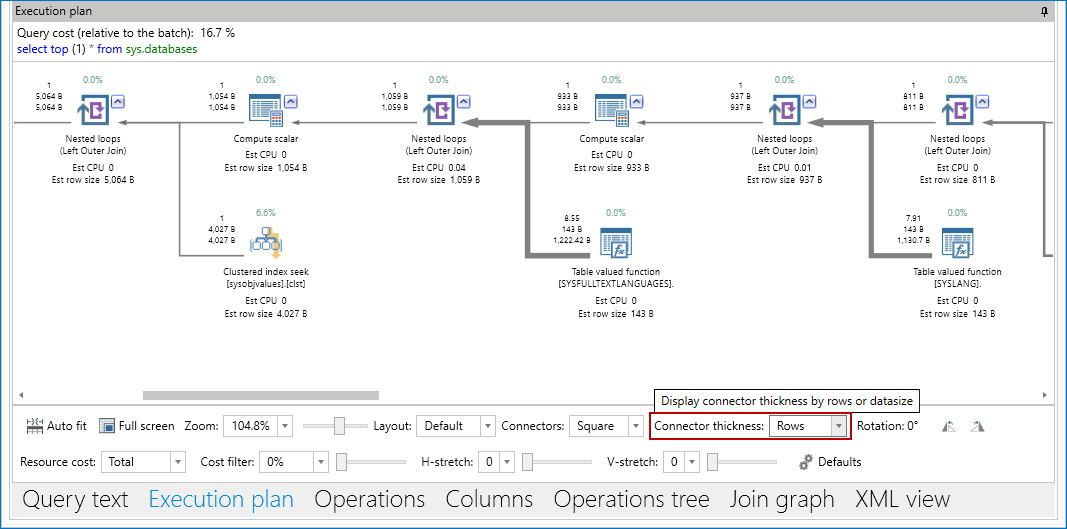
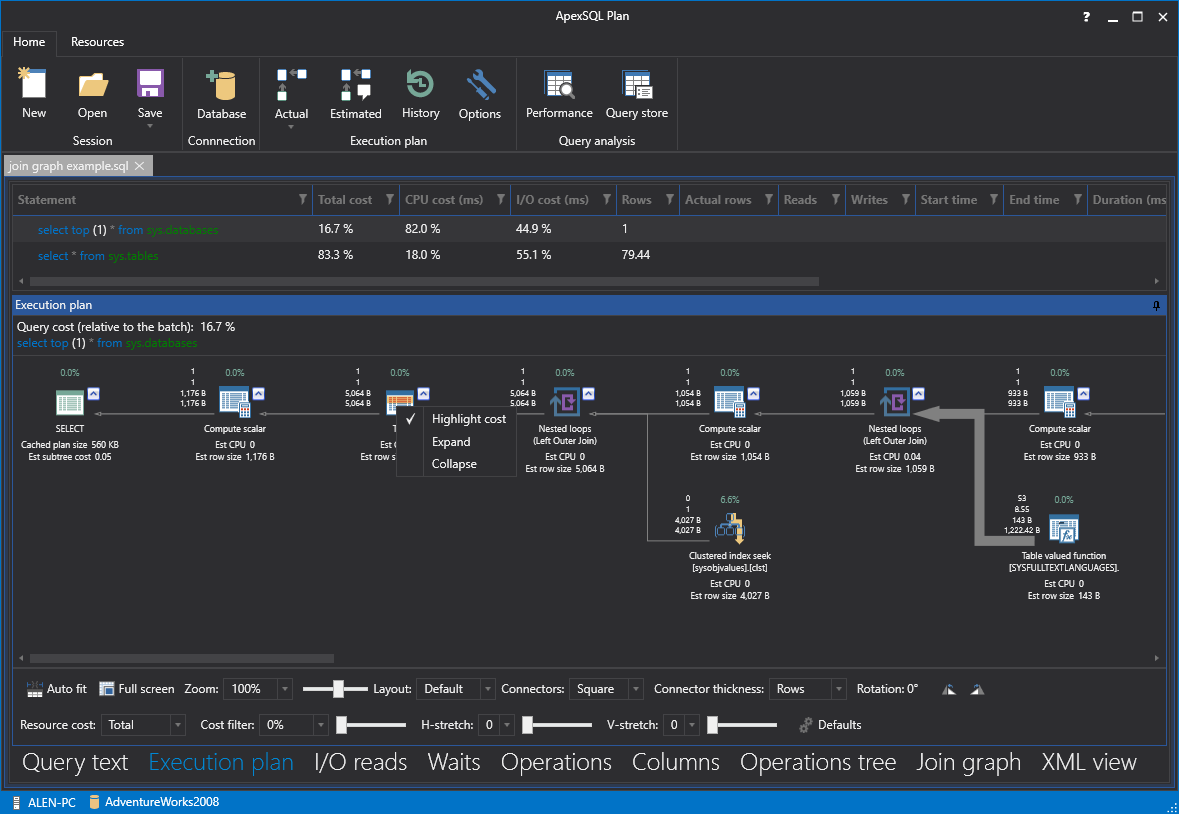
Resource cost highlight and data connector thickness
“Resource cost” option allows the user to review the highest cost operations within the execution plan, and highlight them by CPU, I/O or show the total cost. This feature helps in finding which table should be focused on to enhance the query.
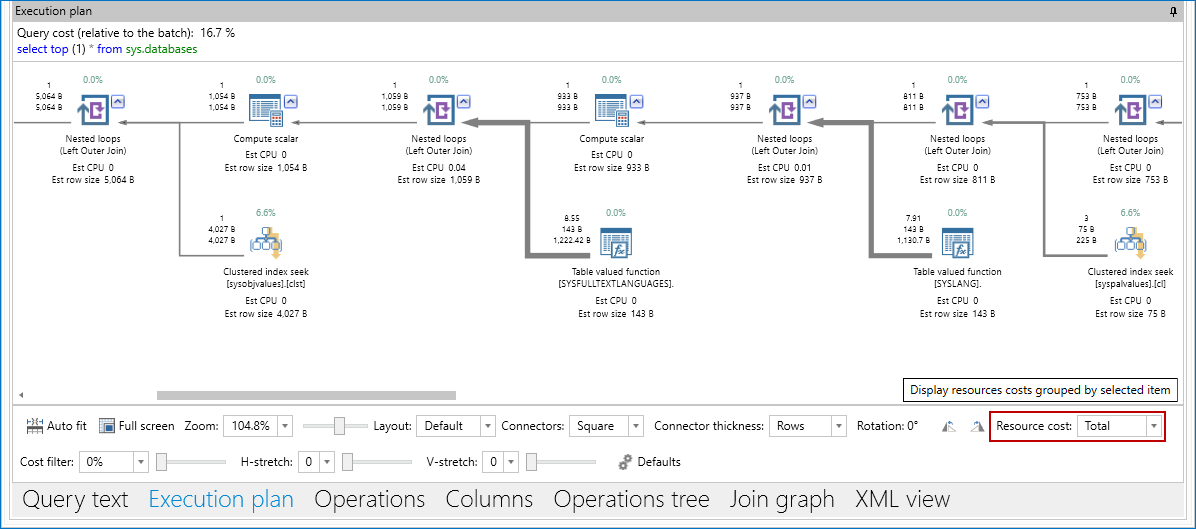
“Connector thickness” option controls the representation of high rows/data size usage with thicker lines of connector lines of varying thickness by setting preferred criteria – data size or rows count
Layout options panel
Using the Layout options panel, it’s easy to customize execution plan diagram layout by zooming, filtering, stretching, flattening, setting layout modes and link styles, rotating, or restoring default values.

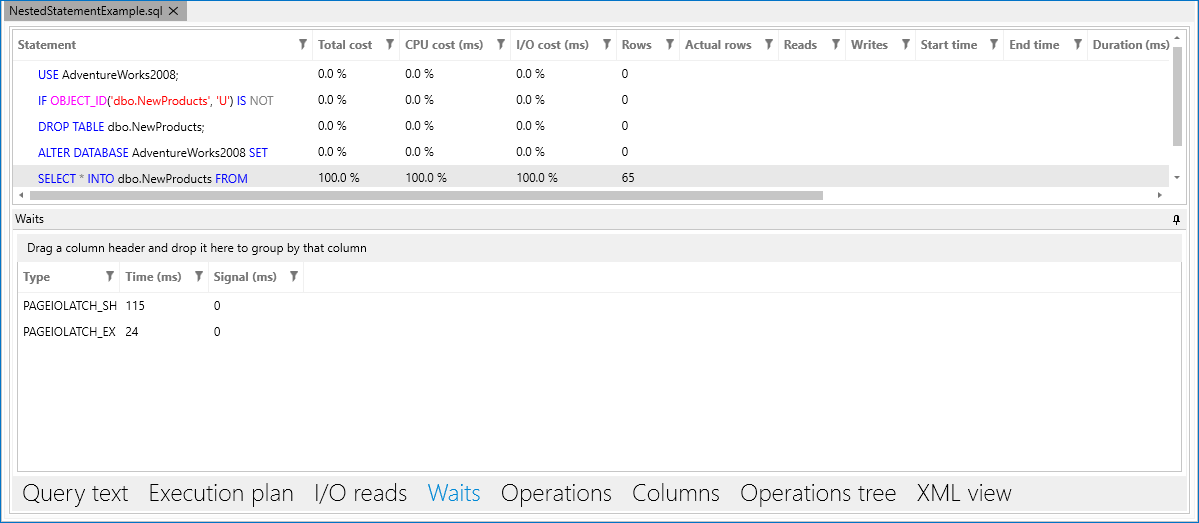
Waits tab
Another new feature which allows the analysis of wait times for executed queries, with a collection of all wait statistics along with correct wait time, and signal time.
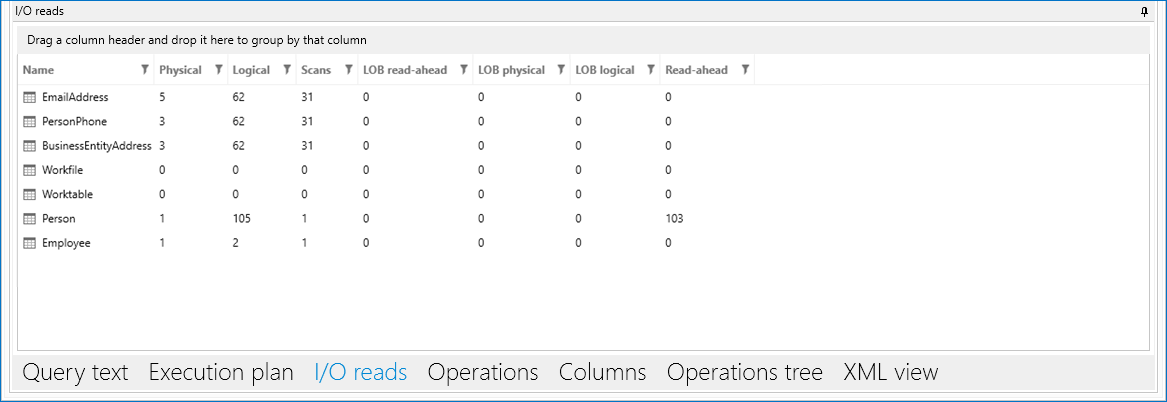
I/O reads tab
The IO reads tab is used for analyzing the number of logical reads including LOB, physical reads including read-ahead and LOB, and can be also used to analyze how many times a database table was scanned.
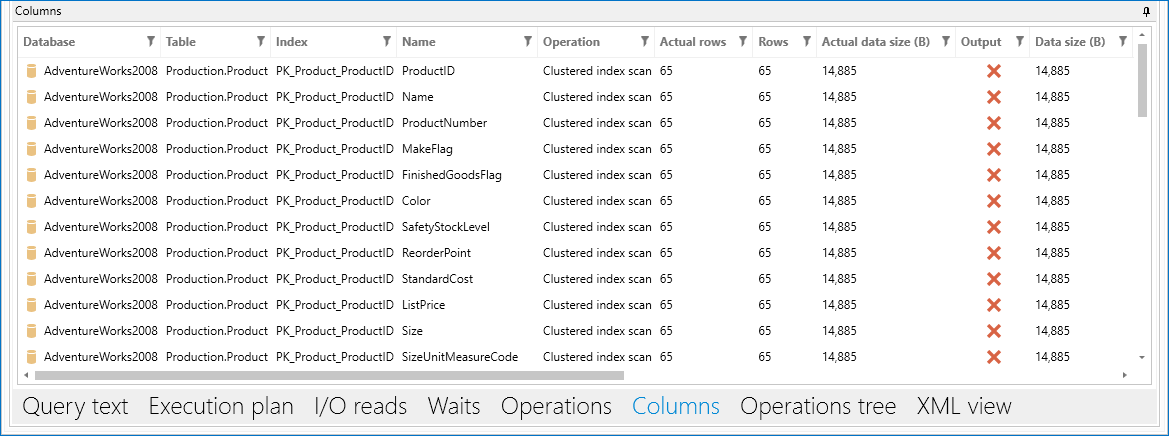
Columns tab
The Columns tab is used for reviewing all query columns used in the plan, and their associated operations and indexes.
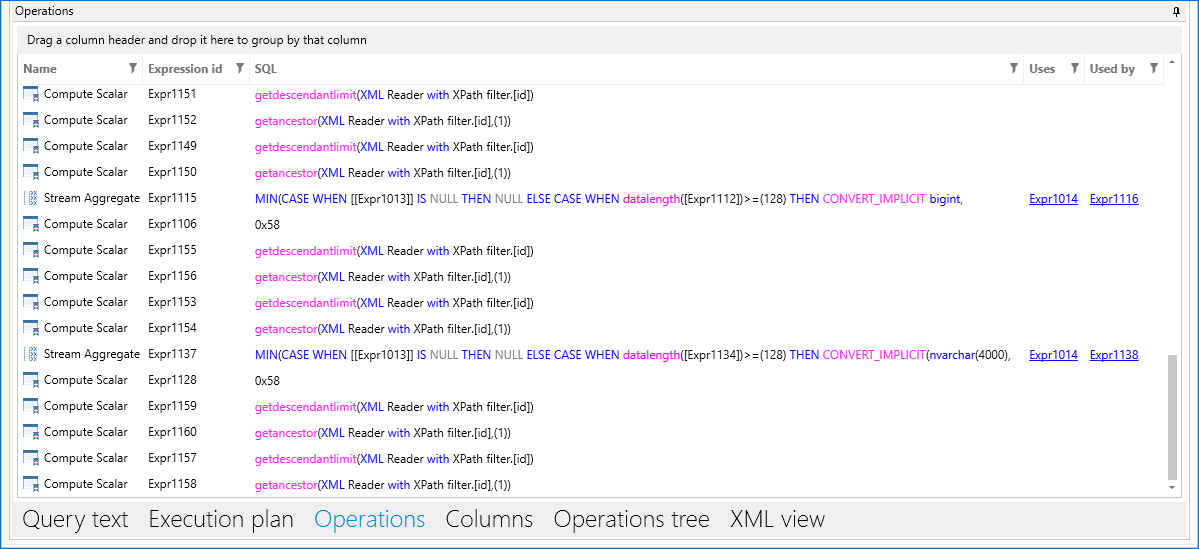
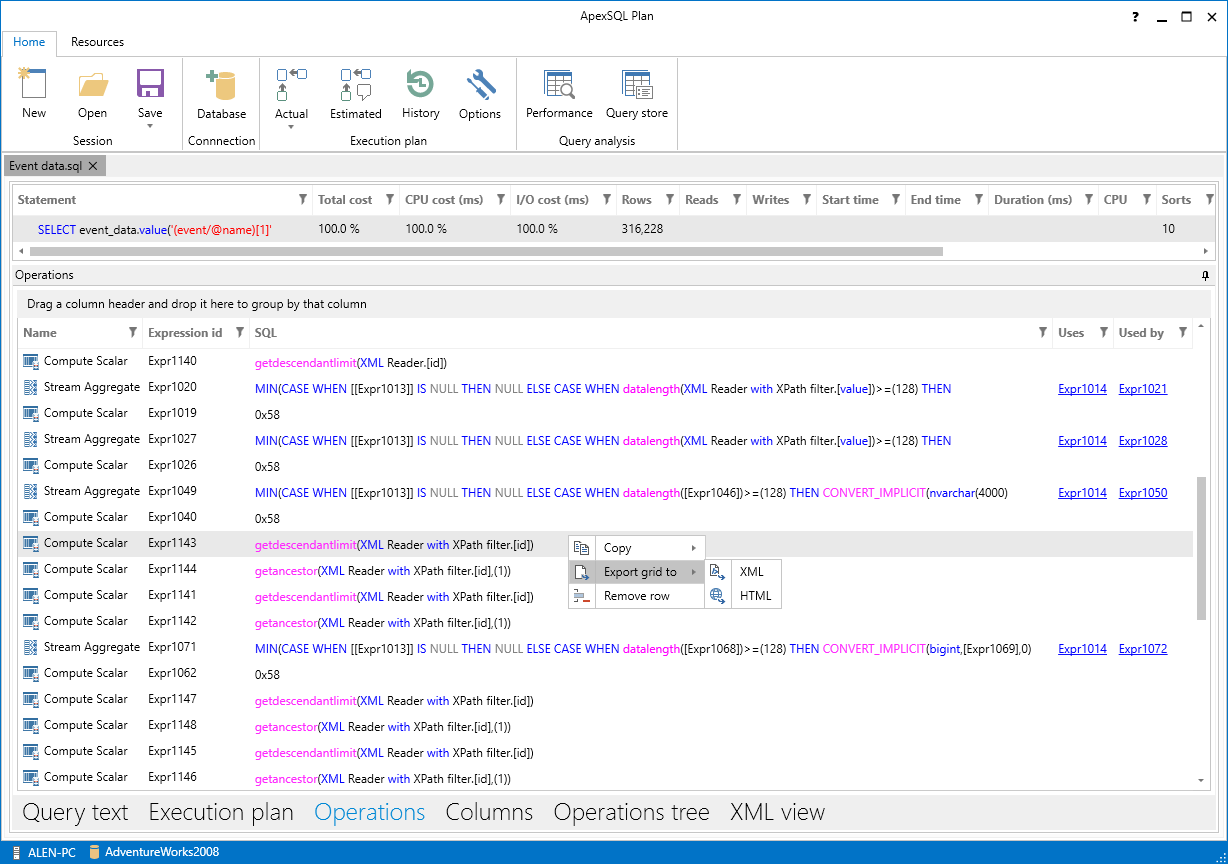
Operations tab
The Operations tab shows simplified and expanded operations that are used in the selected query, and allows implicit conversions within.
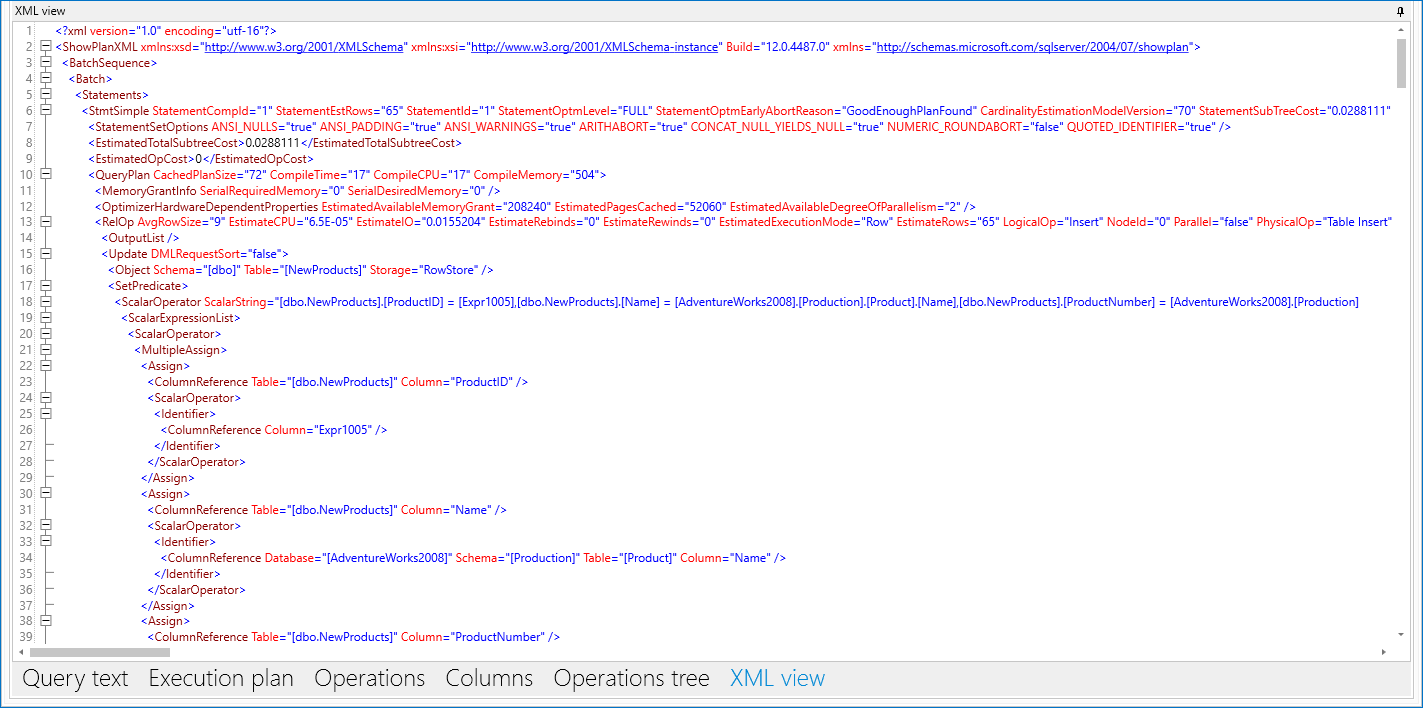
XML view tab
Another great feature is the XML viewer which displays the execution plan in XML format it also allows exporting the results to XML files. The XML viewer is located in the XML view tab.
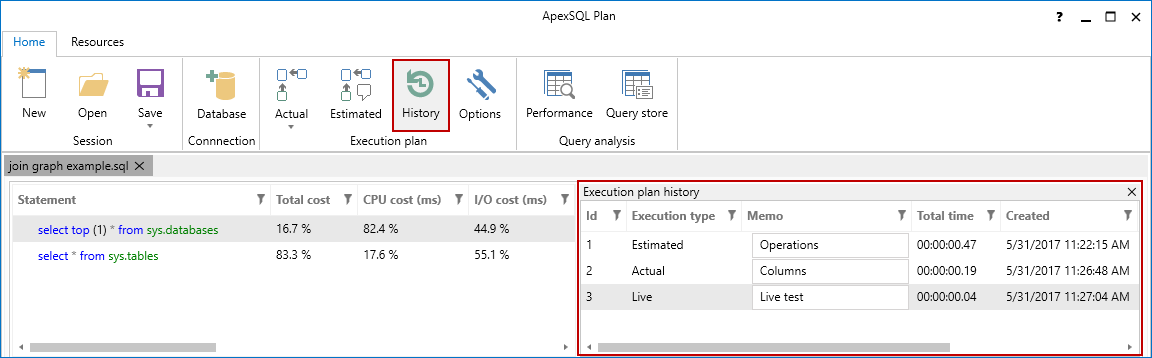
Execution plan history
This feature is used to display the history of different versions of query executions for the current application tab. To see the execution plan history of the desired query, click the History button in the main ribbon bar, then select records to choose which version of execution plan will be loaded, and include memos within particular version of the query.
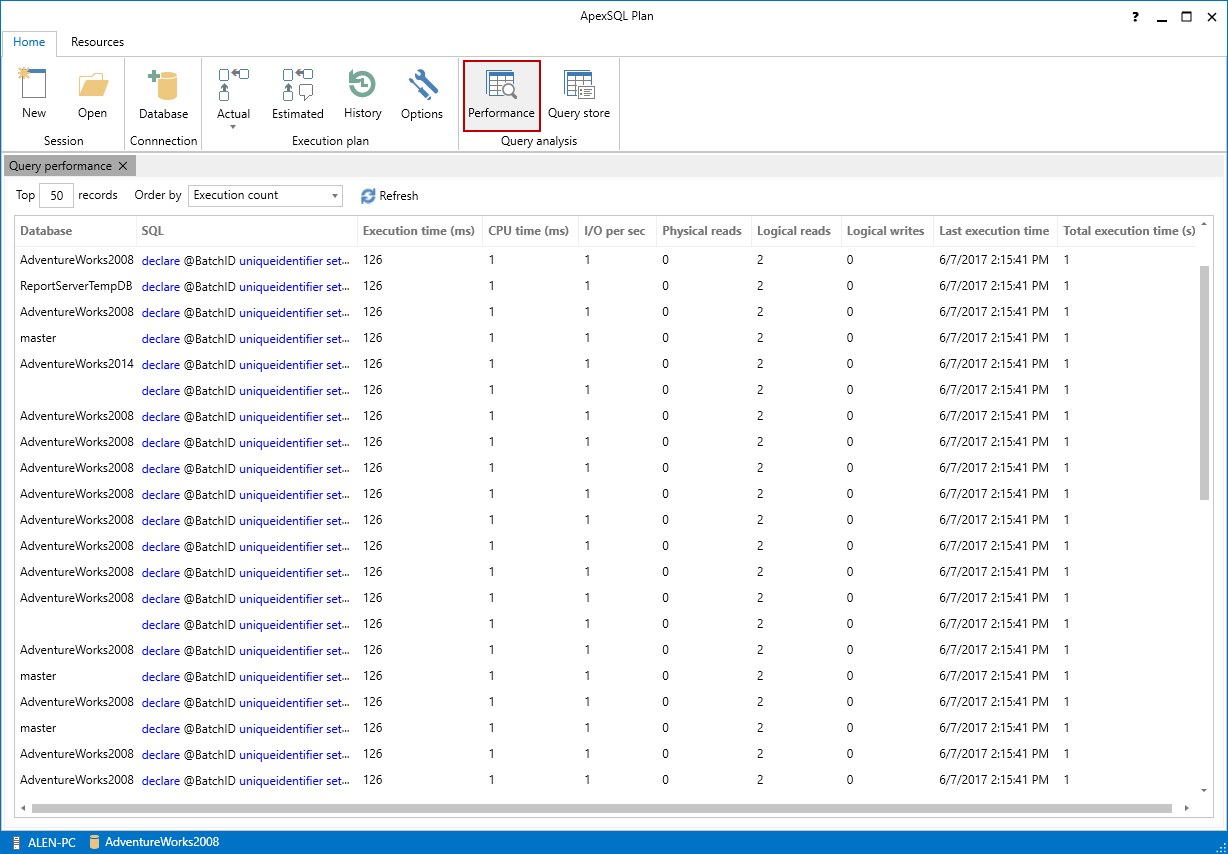
Query performance tab
Using this feature, you can get a list of slowest queries recently executed by defined criteria and collected from SQL Server with provided all important details. To activate the Query performance tab, click the Performance button in the main ribbon bar.
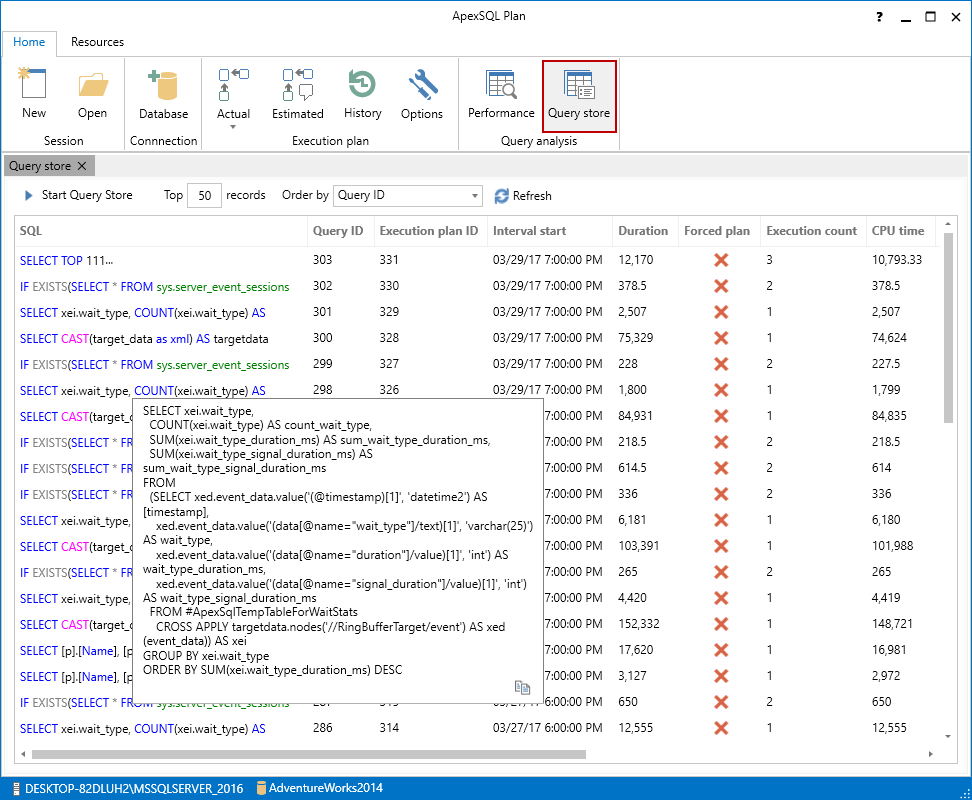
Query store tab
Another addition to ApexSQL Plan is the Query store tab. Using this feature, you can review query execution data collected from SQL Server 2016 Query store. To activate the Query store tab, click the Query store button in the main ribbon bar. The Query store feature is supported for SQL Server 2016 version and higher.

Each row in the Query store tab contains a SQL query with a SELECT statement. Once mouse hovered the whole query text will appear in the tooltip and can be copied by using the copy button in the lower right corner of the tooltip.
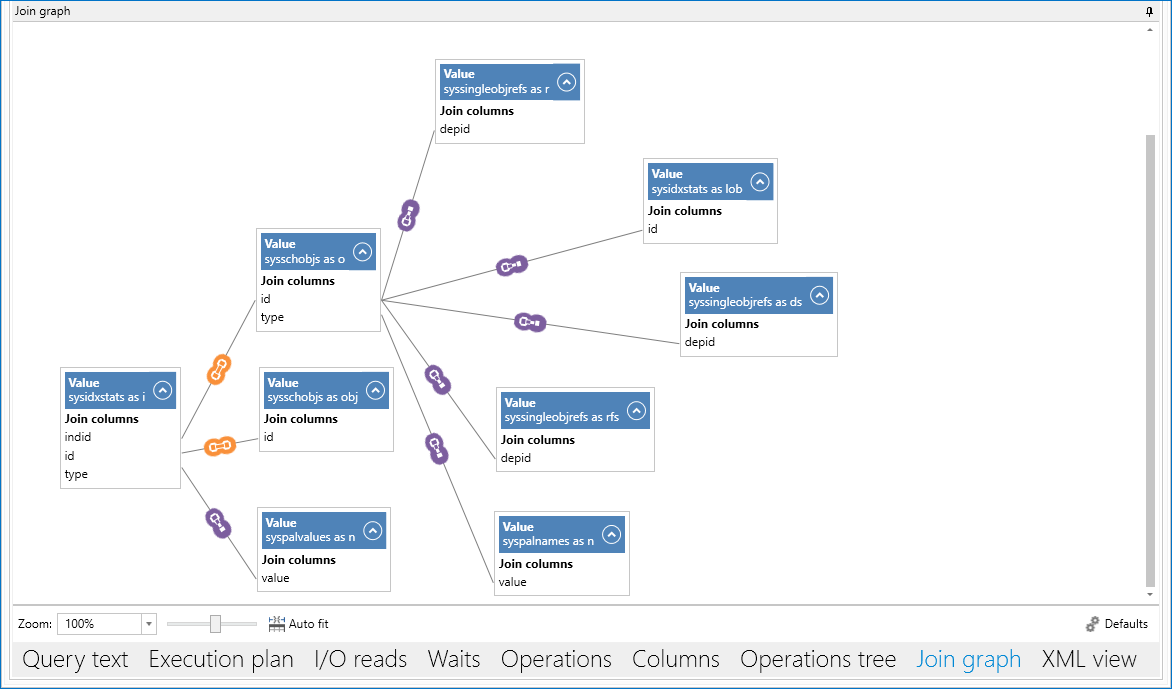
Join graphs
Join diagrams are used to graphically display relationships between database tables involved in the execution plan. If a query contains a JOIN statement, the corresponding diagram will be generated in the Join graph tab.
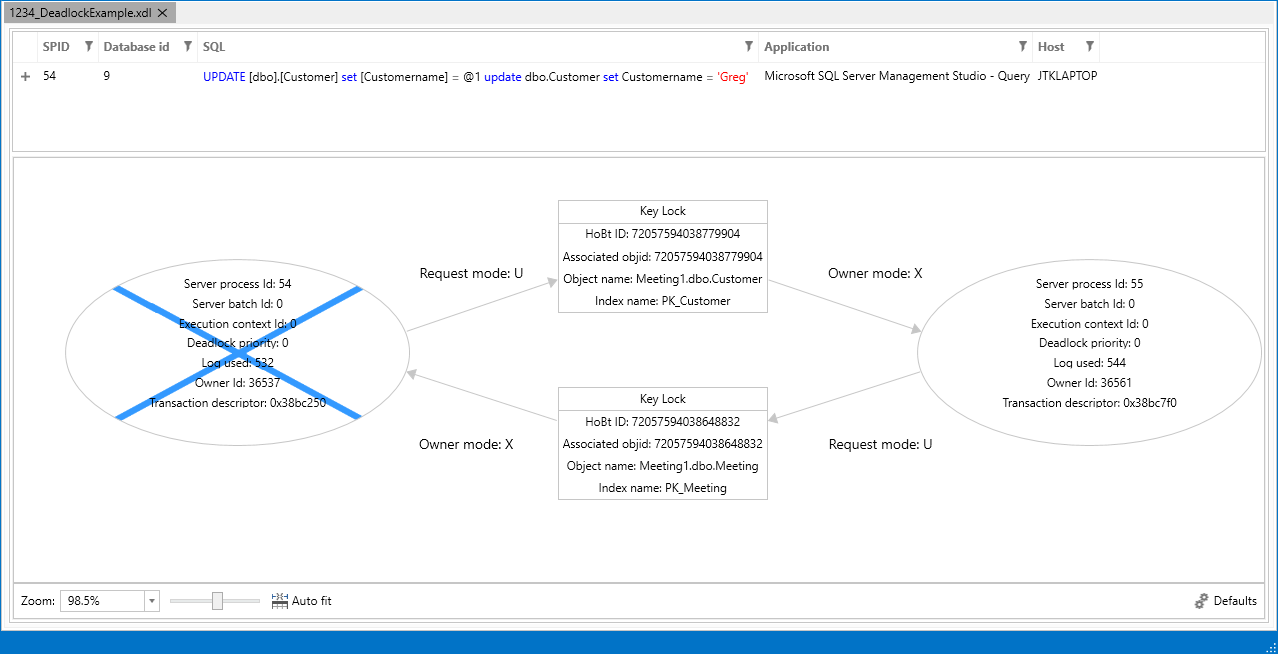
Deadlock diagram analysis
ApexSQL Plan can be also used to open deadlock files. Once a deadlock file is loaded the deadlock diagram will be shown which can be analyzed to identify the cause of a deadlock.
HTML and XML exports
Almost every tab in ApexSQL Plan can be exported in HTML and XML formats for later use. The export options are available for every column by right clicking and selecting the desired option in the context menu.
When a grid is exported, you will be prompted with a message, if you want to open the exported file right away.
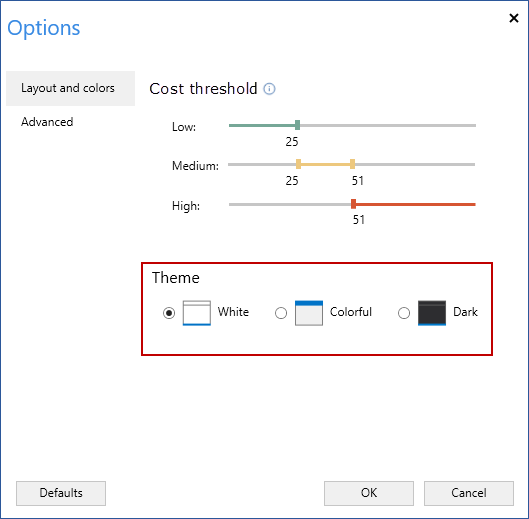
New GUI themes
ApexSQL Plan will include three graphical interface themes. From which the White theme is set by default but it can be changed to Colorful or Dark theme to give it a smooth new look and make it more appealing.
(Dark theme look)
Theme related settings can be changed in the Options window by selecting the desired theme and clicking OK.
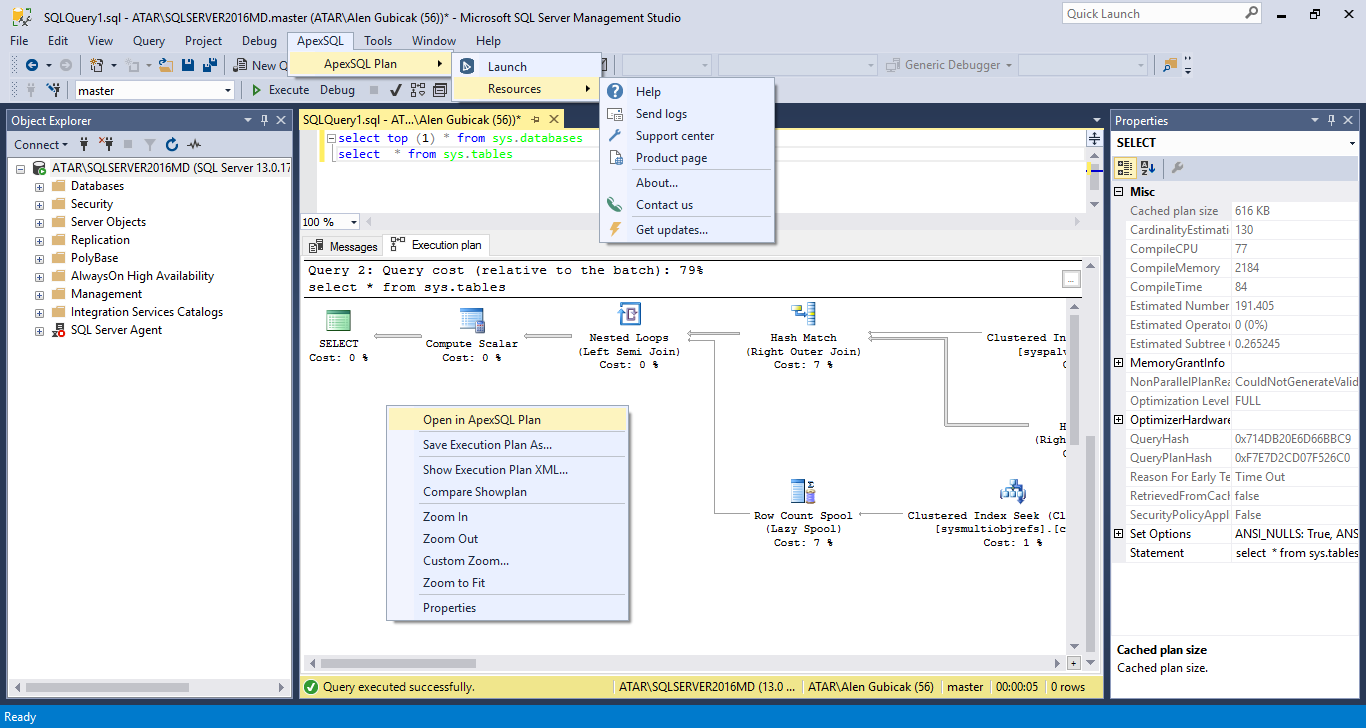
SQL Server Management Studio integration
By integrating ApexSQL Plan into Server Management Studio, you can view the execution plan from SSMS directly in ApexSQL Plan. To do this, just right-click the execution plan and in the context menu select the “Open in ApexSQL Plan” option.
April 26, 2017


