


Once ApexSQL Audit installer is started, installation wizard offers several choices:
- Install ApexSQL Audit, which includes full installation of all services, GUI and central repository which allows full auditing and other jobs to be performed
- Install ApexSQL Audit GUI option will install only user interface on different workstation which will be able to access and configure auditing and other tasks
- Install server-side components option will install windows services which are required to allow remote auditing
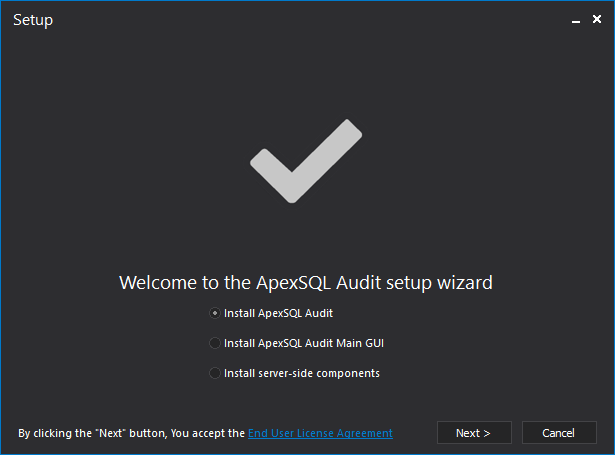
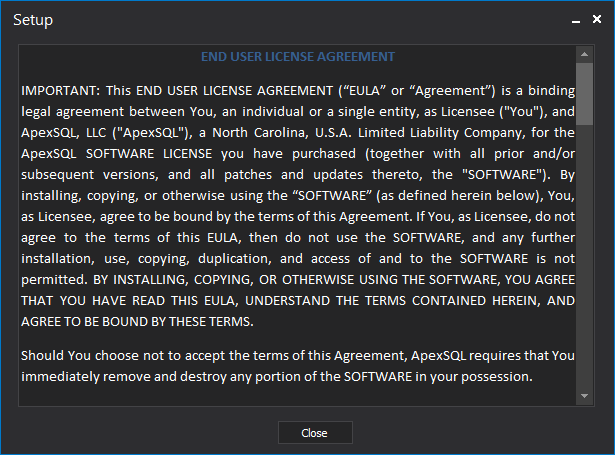
Clicking on the “End User License Agreement” will show full EULA
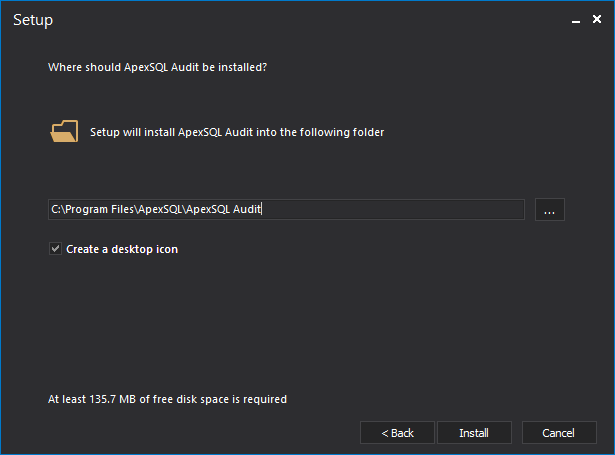
The next step of the installation wizard allows users to choose the installation directory and if a desktop icon should be created. After clicking on the “Install” button, all installation wizards except for the full installation will complete after this step and short processing
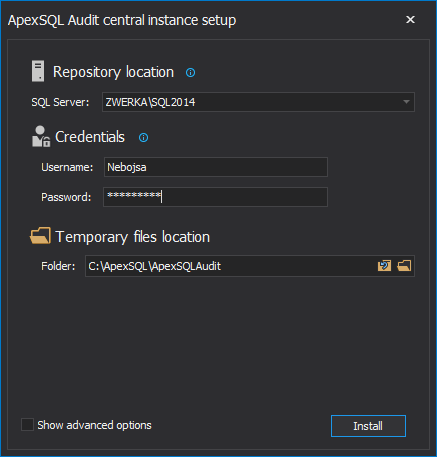
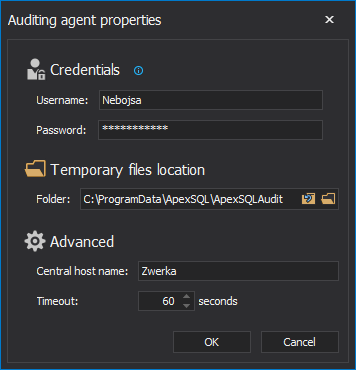
In the next step of the wizard, users need to choose the destination SQL Server which will host ApexSQL Audit central repository database, provide credentials, choose a destination folder for temporary files and configure related options
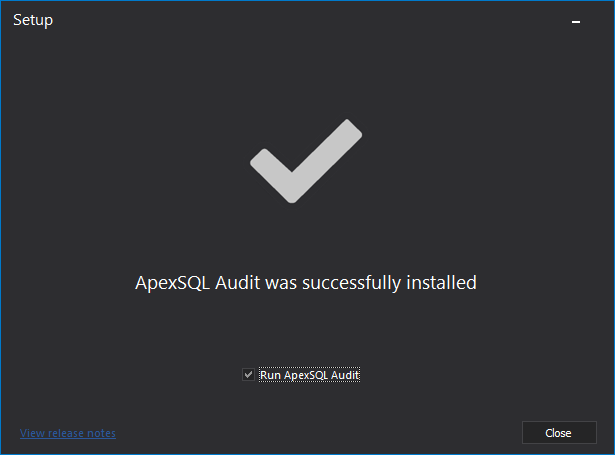
The final installation step provides information on successful installation job and allows users to immediately run ApexSQL Audit GUI
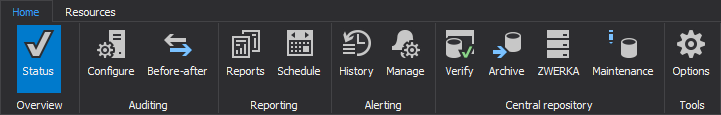
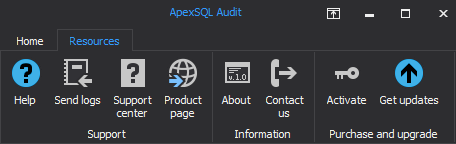
ApexSQL Audit main menu consists of two tabs: Home and Resources
The “Home” tab includes options related to auditing, alerting, reporting, configuration and maintenance tasks as well as application options
The “Resources” tab includes options which allow users to get easily get in touch with ApexSQL Support or to handle licensing and application updates tasks
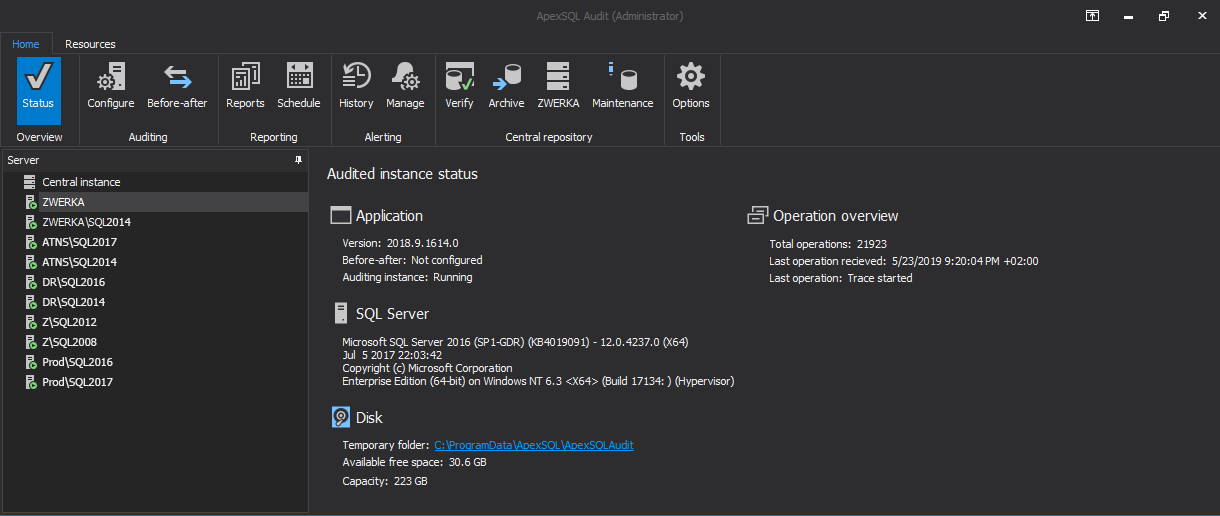
The “Status” screen shows a global overview of all audited SQL Server instances if the central instance is selected
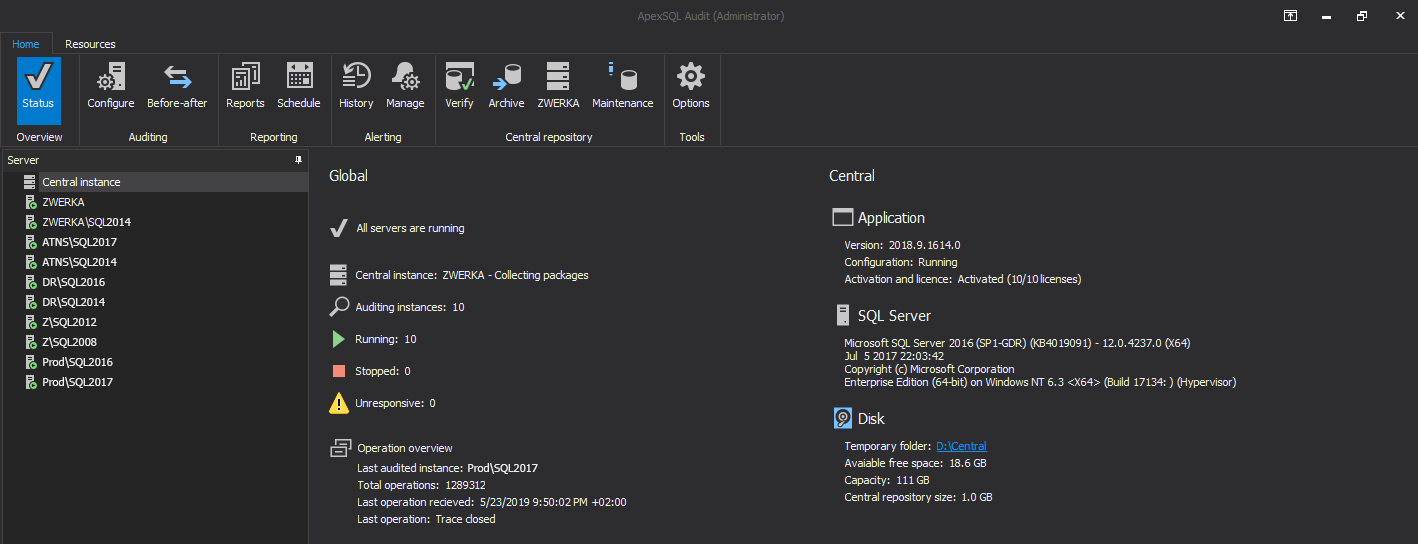
If individual SQL Server instance is selected in the “Status” overview, status for that audited instance is shown including application, SQL Server, and disk information
The “Configure” tab is used to add SQL Server instances and databases for auditing and to configure auditing filters
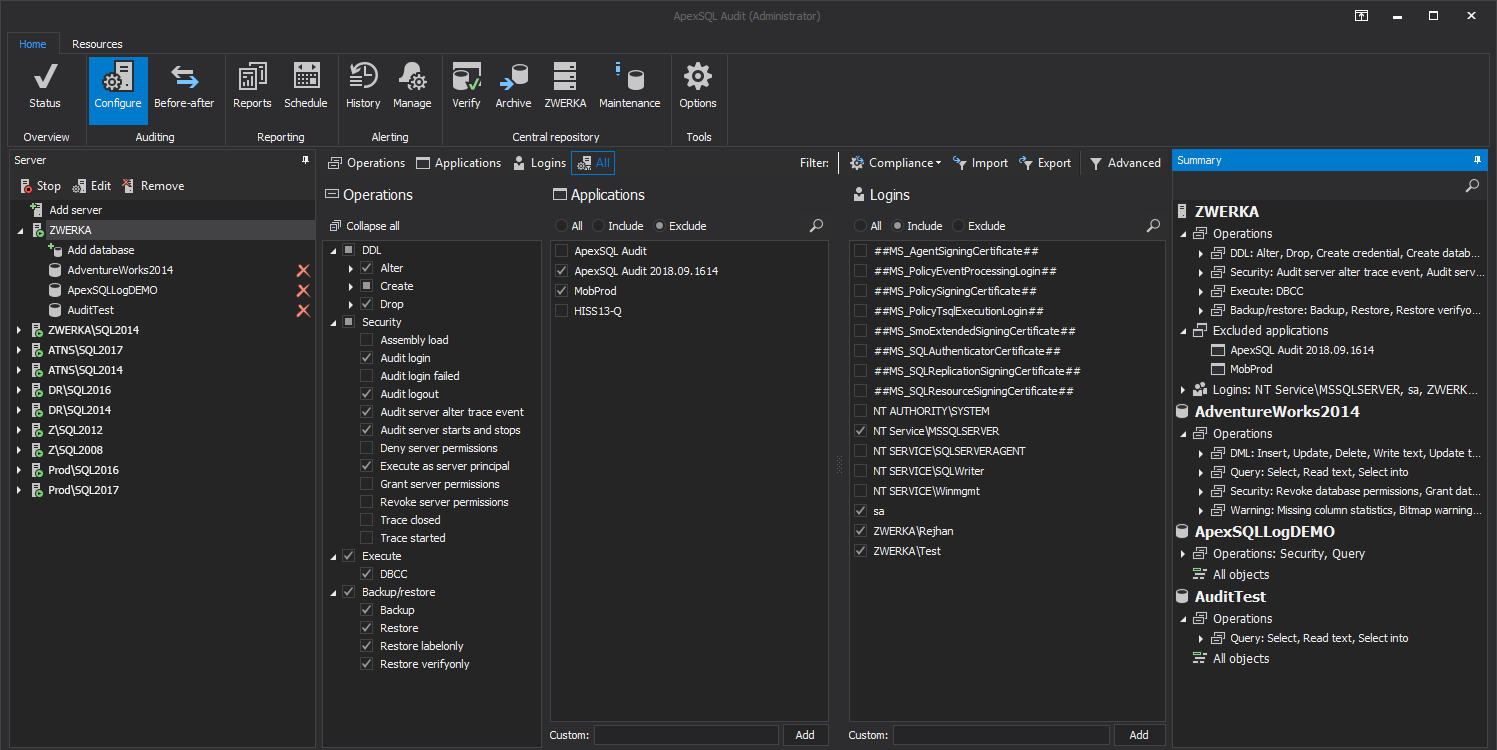
Users first need to add SQL Server instances for auditing by clicking on the “Add server” button and then to provide credentials and connection information
Once the server is added, users can use checkboxes to add specific operations for auditing, as well as to include or exclude specific applications and SQL Server logins from the process
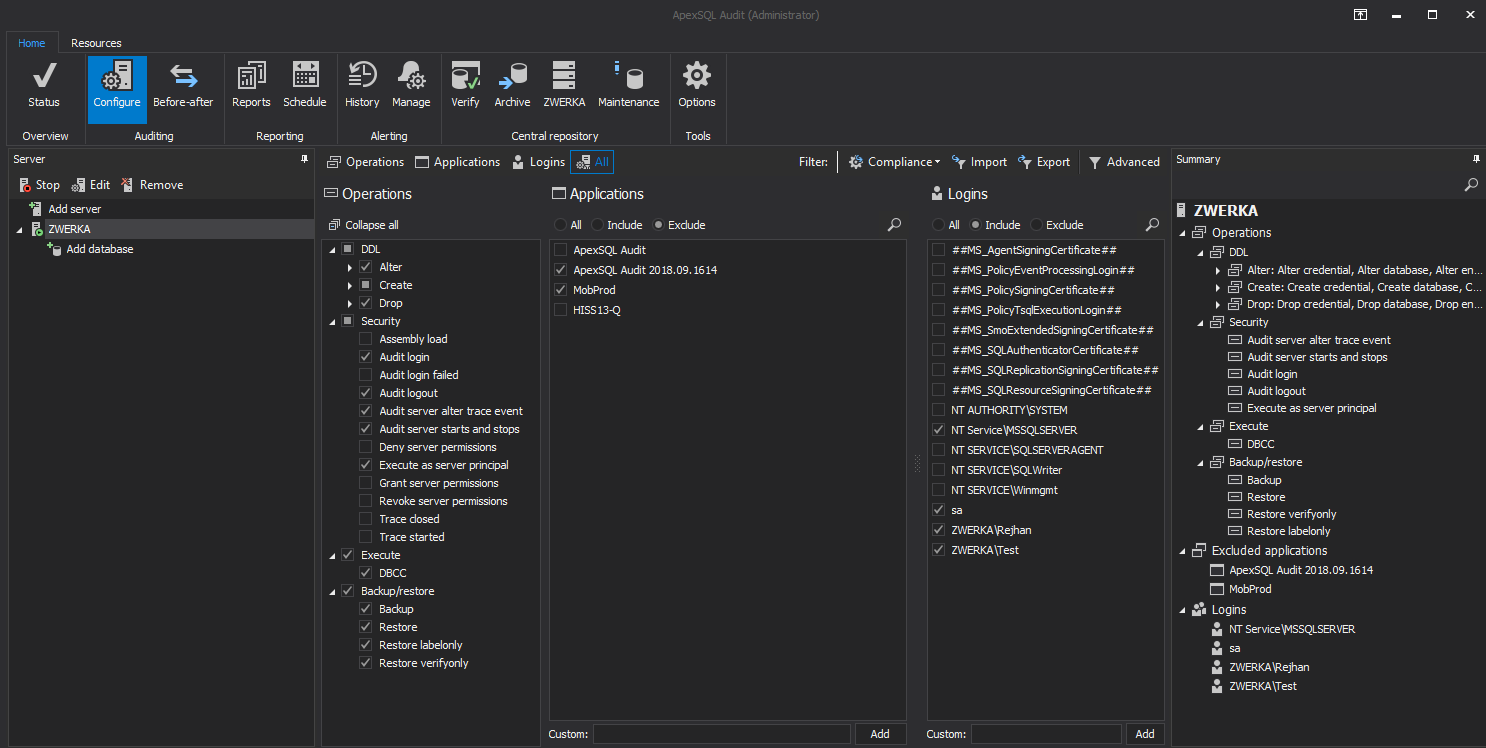
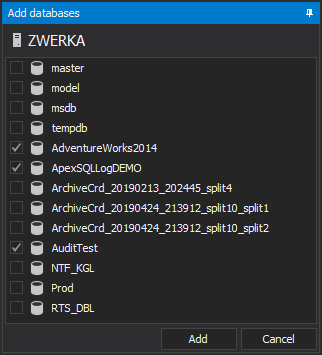
Next, users need to add databases for auditing by clicking on the “Add database” button in the Server pane and simply check databases for auditing
Similar to the server configuration, users need to check the appropriate check boxes next to the database-level operations for auditing and optionally to select objects to include or exclude from the auditing task
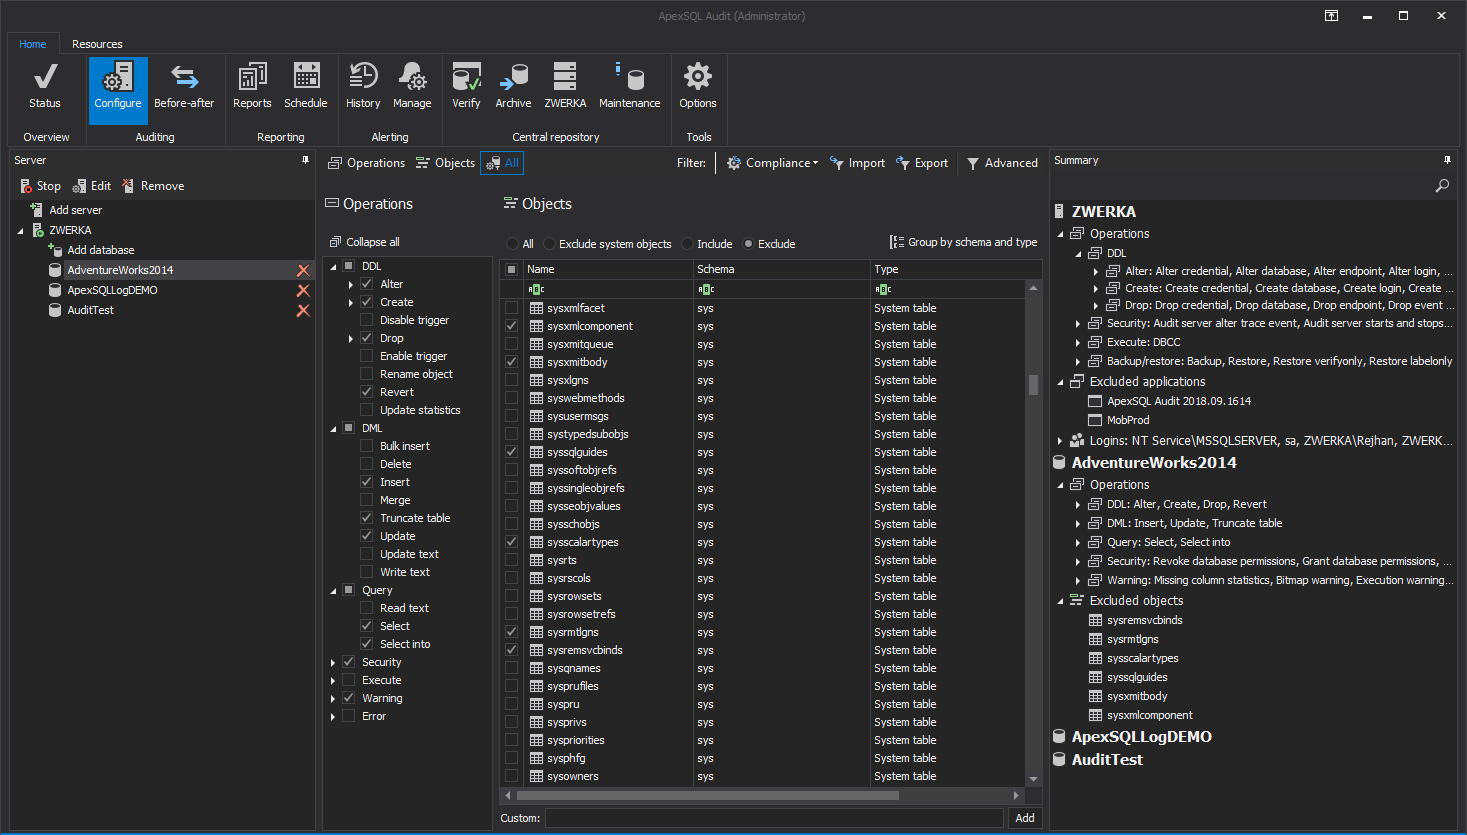
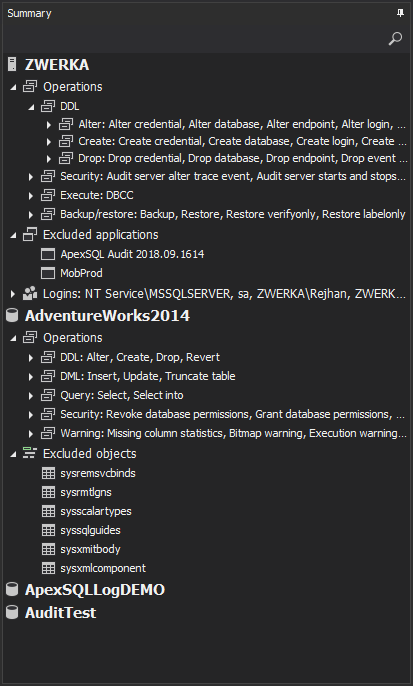
On the far right, a full auditing summary is shown for the selected SQL Server instance including all filters for both server and database levels
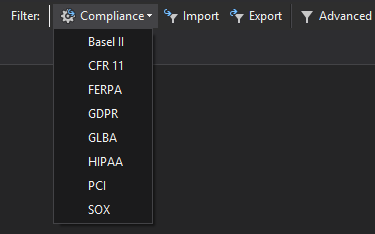
To speed up the configuration process, users can use existing compliance templates based on various compliance standards and regulative, import and export configurations between servers and databases or use advanced filters for greater precision
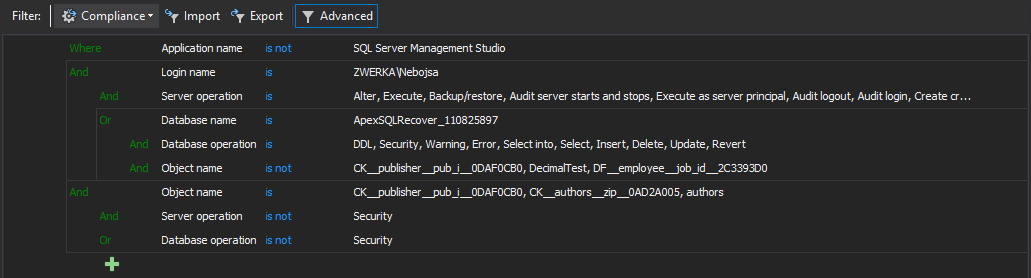
The above mentioned advanced filter uses logical expressions and allows users very high precision when configuring their auditing filters since there is no limit to the number of conditions which can be used
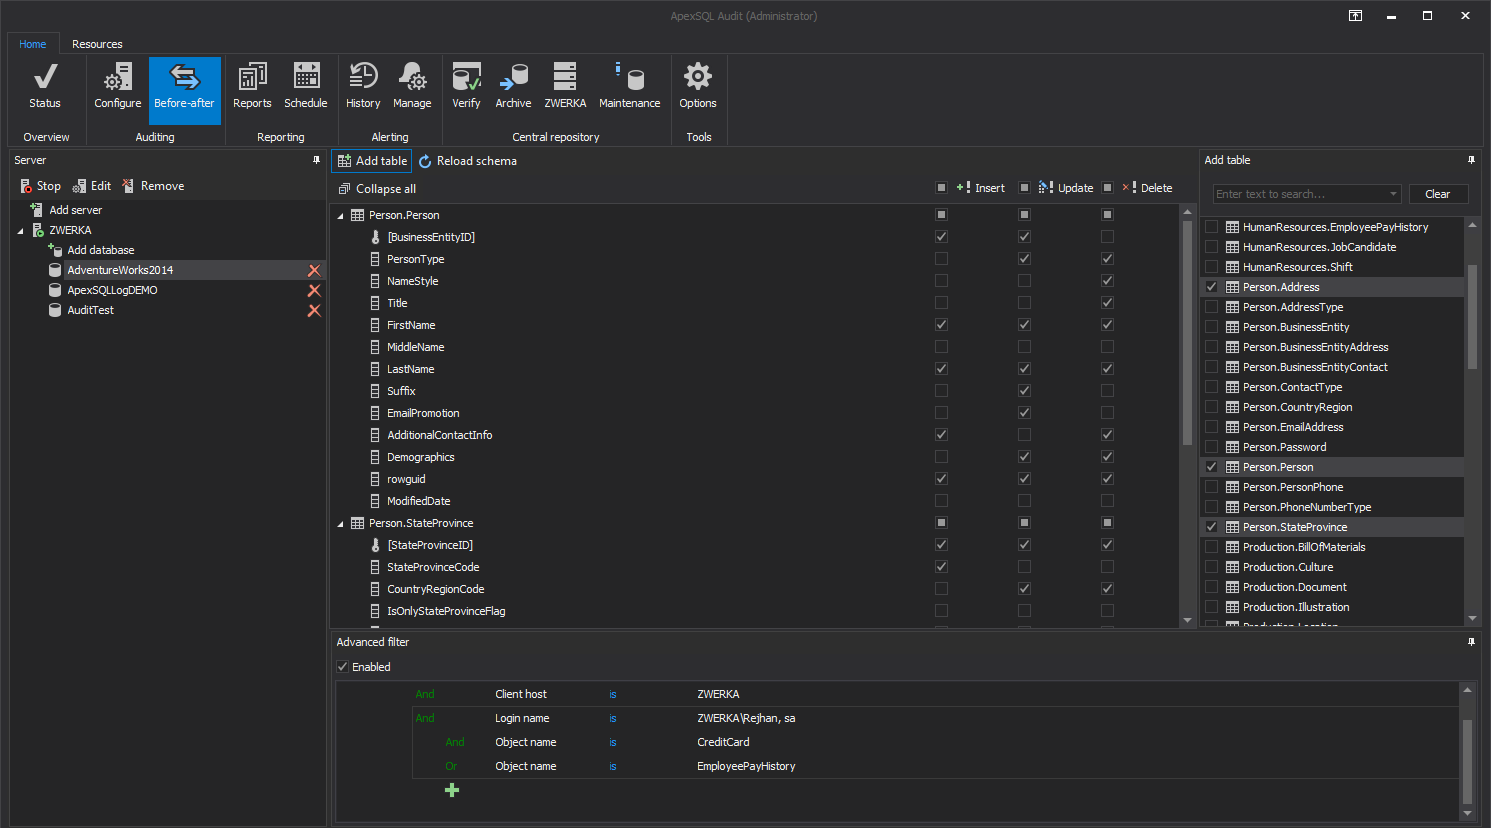
The “Before-after” tab in the auditing category allows users to configure auditing of exact values before and after the change on the insert, update and delete operations. It is configured in a similar manner as the regular auditing. First add the databases, then add tables and check columns on which before-after changes will be tracked. In the bottom of the screen, advanced filters can be configured for increased auditing precision
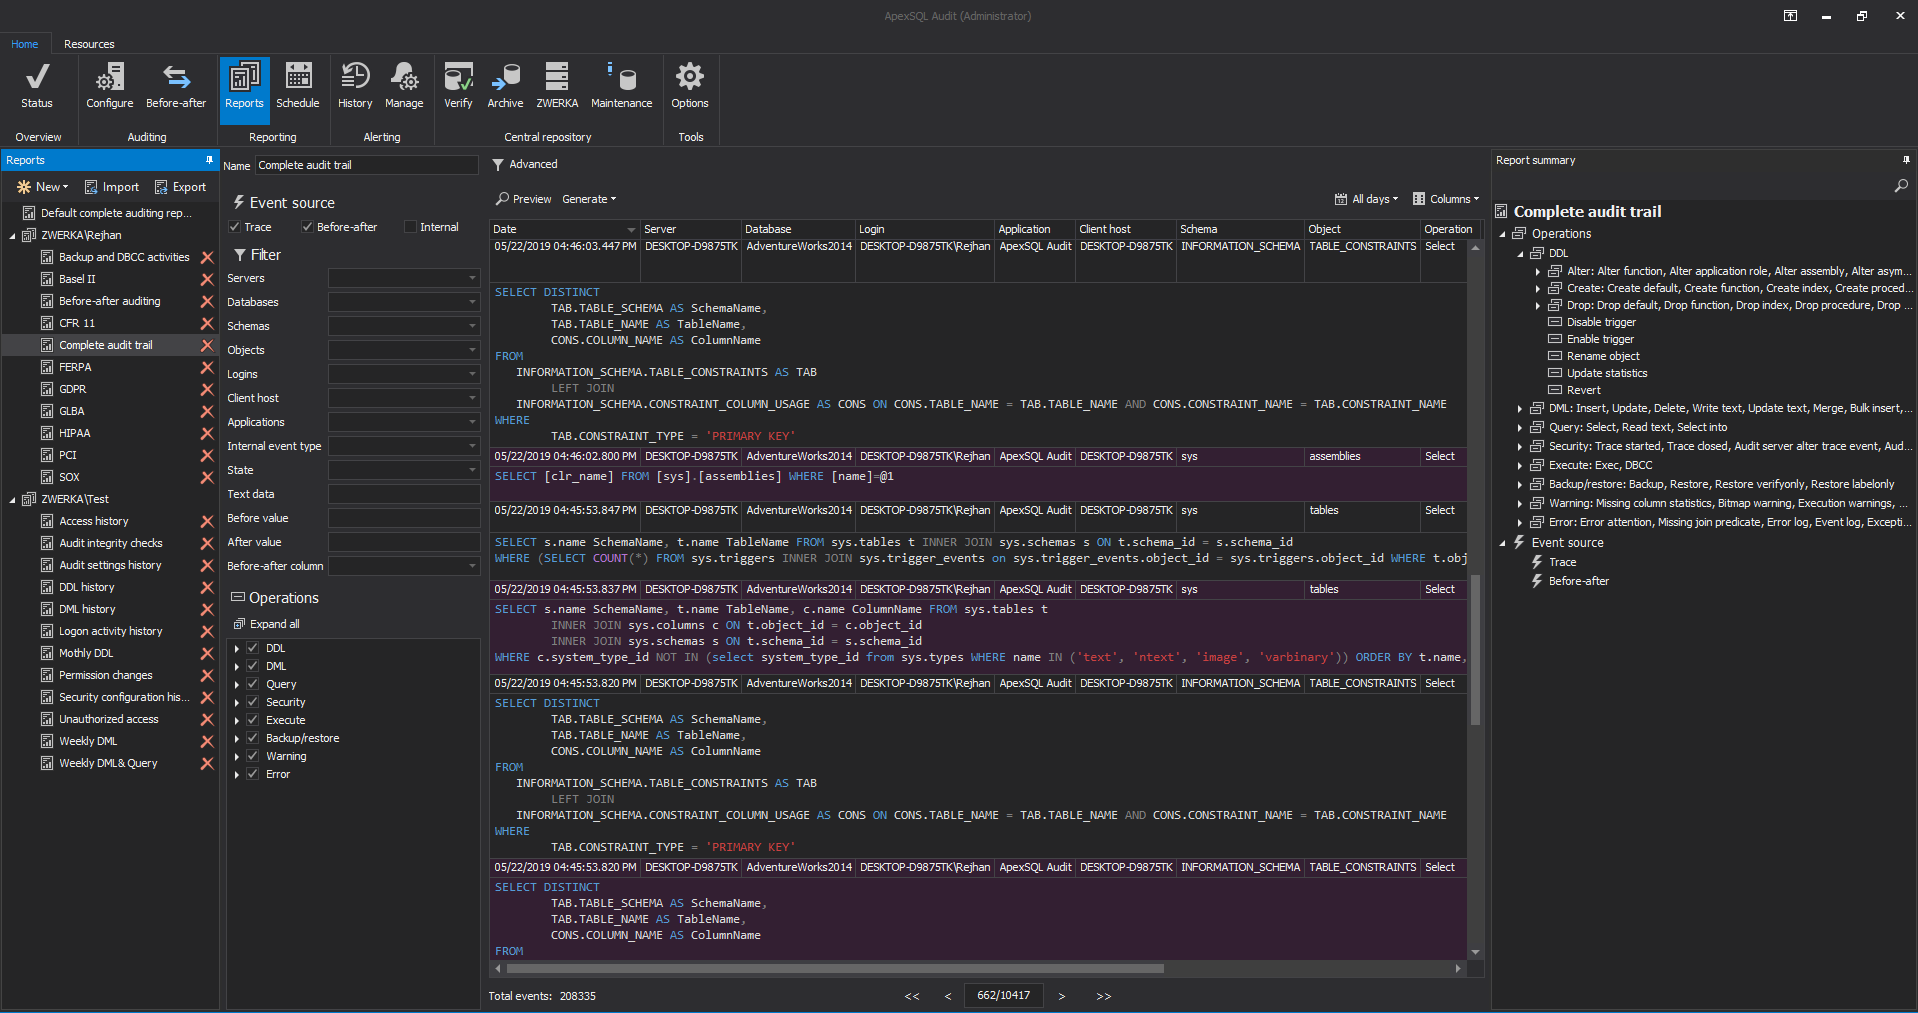
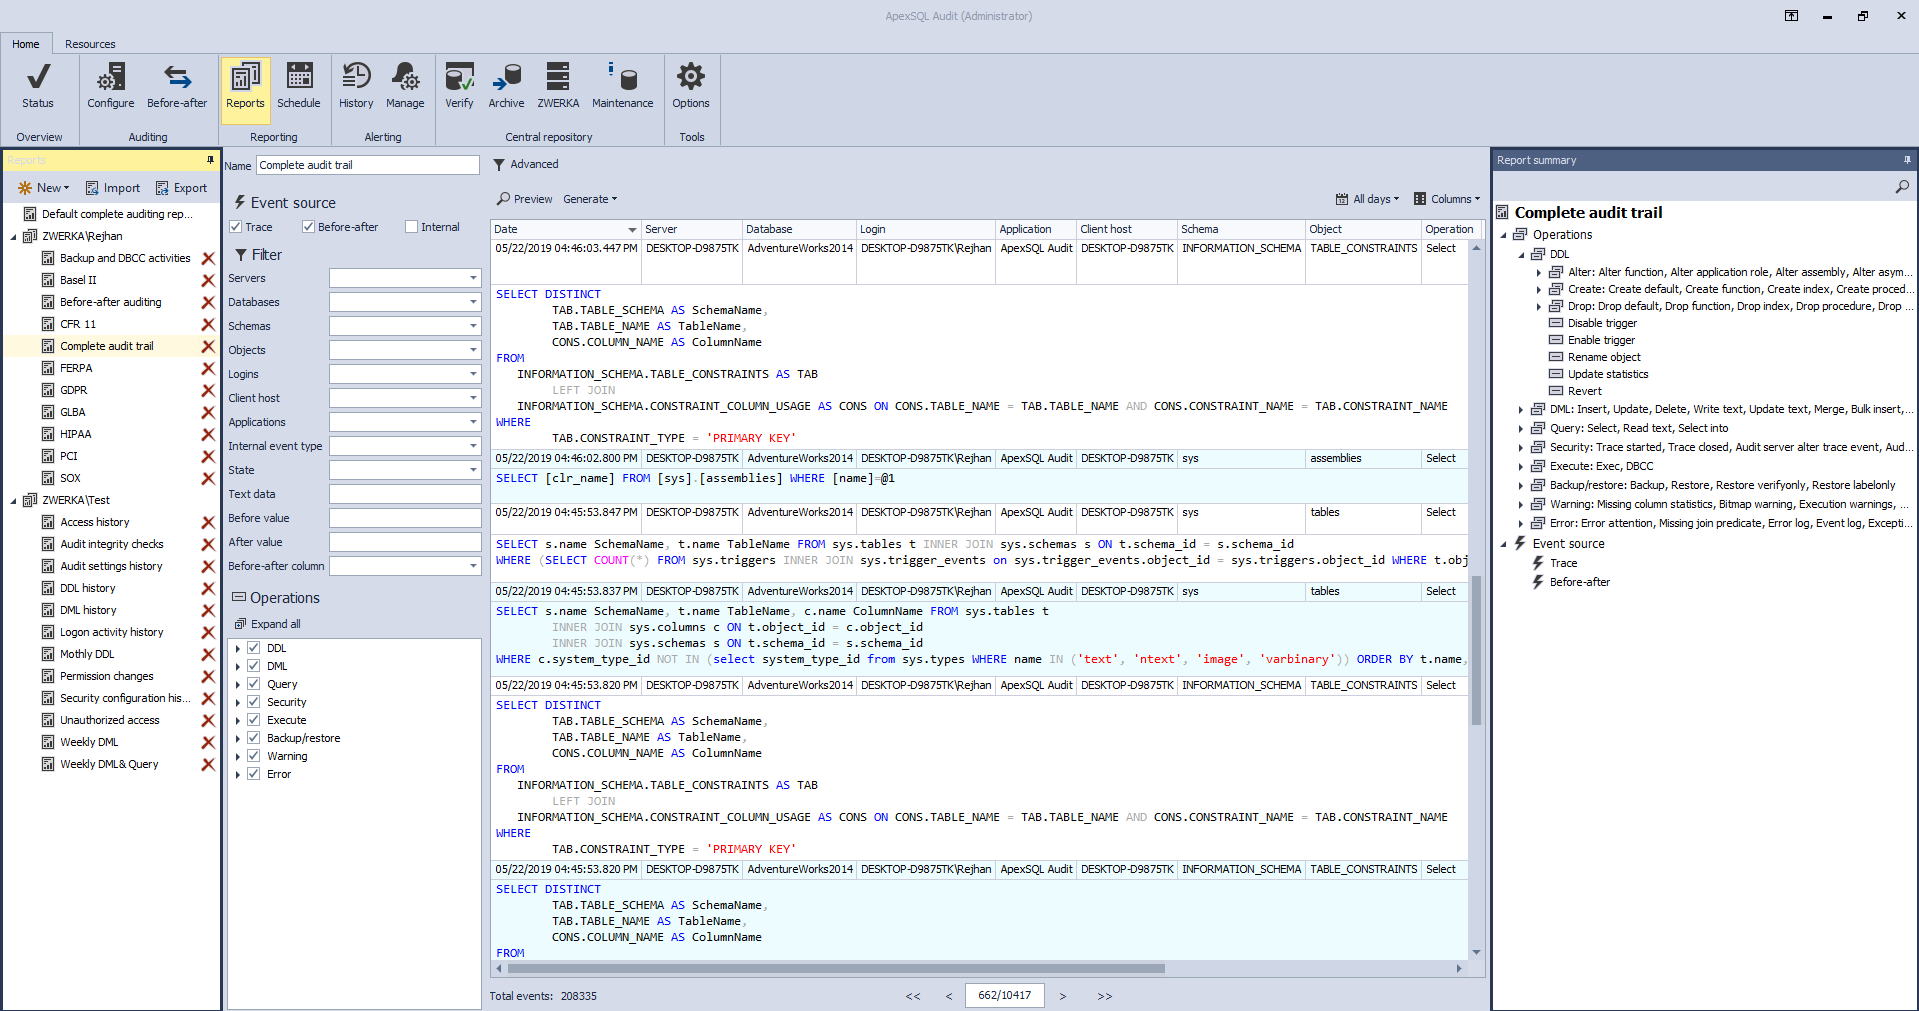
The “Reports” tab screen allows users to choose from existing reports or create their own custom reports, preview them and generate report exports in various formats. Similar to the “Configuration” screen, advanced filters that utilize logical conditions for maximum report precision can be used here as well, while the report configuration summary is shown in the right-most panel
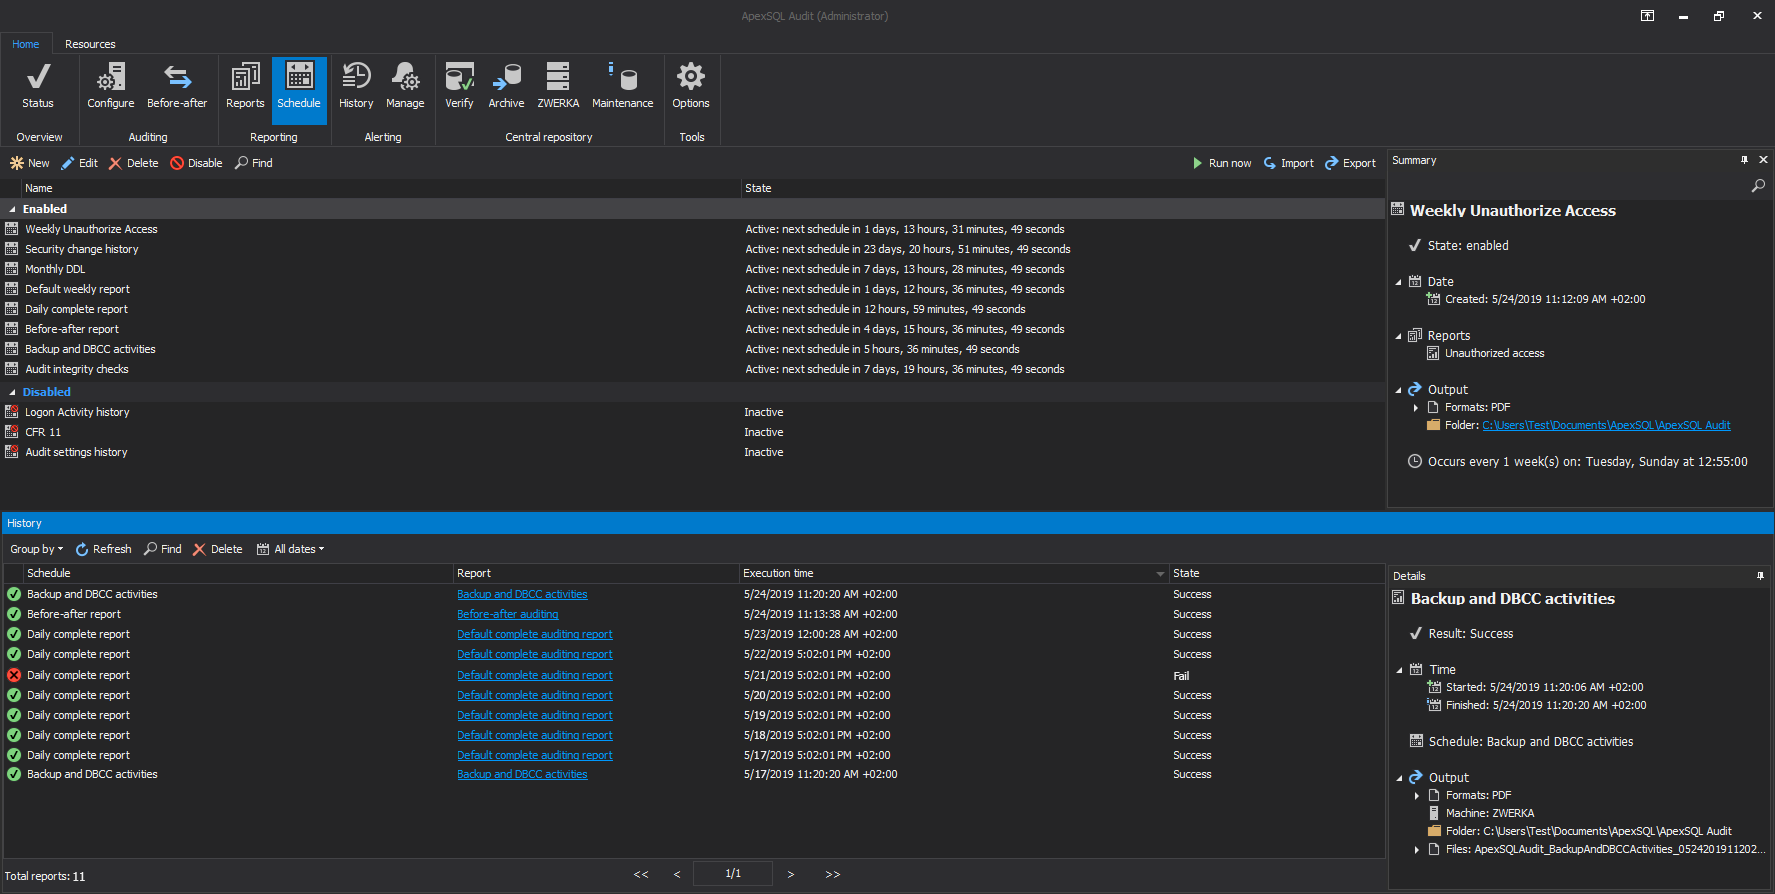
Schedules pane allows users to create and manage schedules which will automatically create auditing reports and provide overview of active and disabled schedules also as the history details of executed jobs
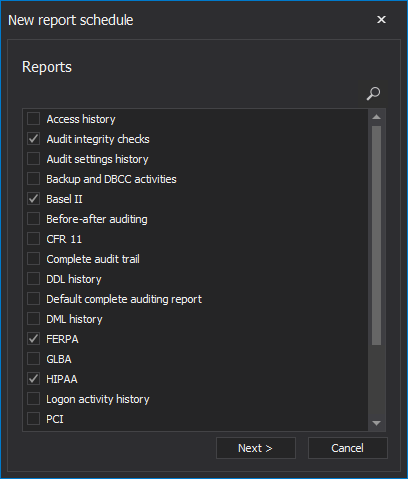
To schedule a report, click on the “New” button and first choose reports to schedule
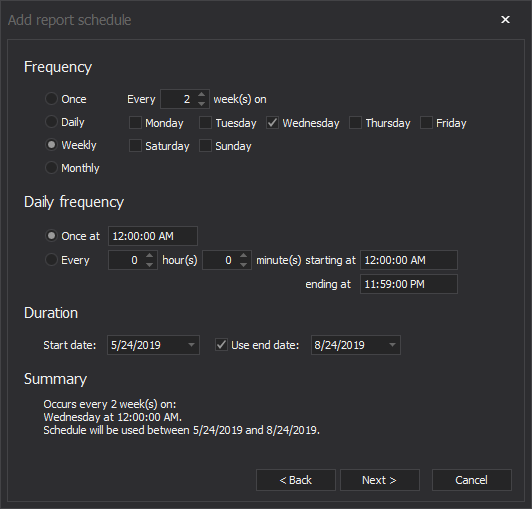
Next, choose the report frequency
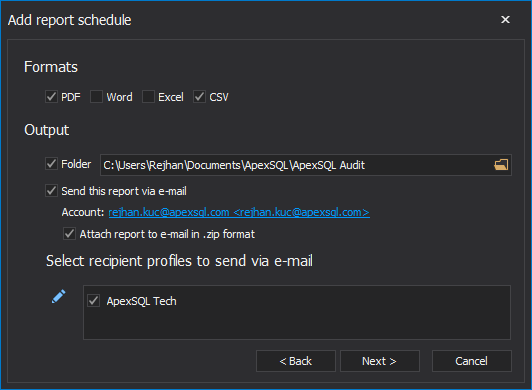
Next, choose report formats, output folder and optionally chose emails addresses which will receive generated reports attached to the emails immediately when they are created
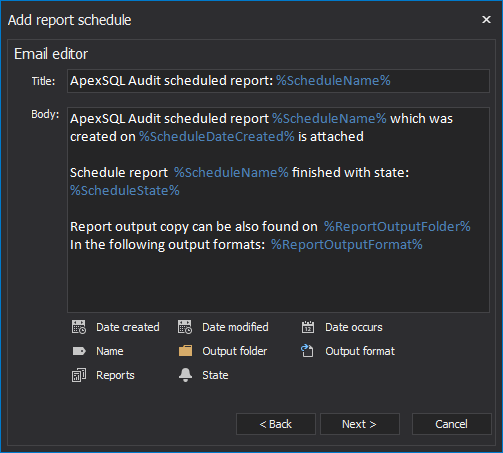
And if opt to choose e-mail notifications in the previous step, customization of e-mail outline notification is defined in the next step of the wizard
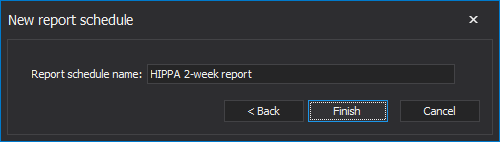
Finally, input schedule name and click on the “Finish” button and it will be created and immediately active
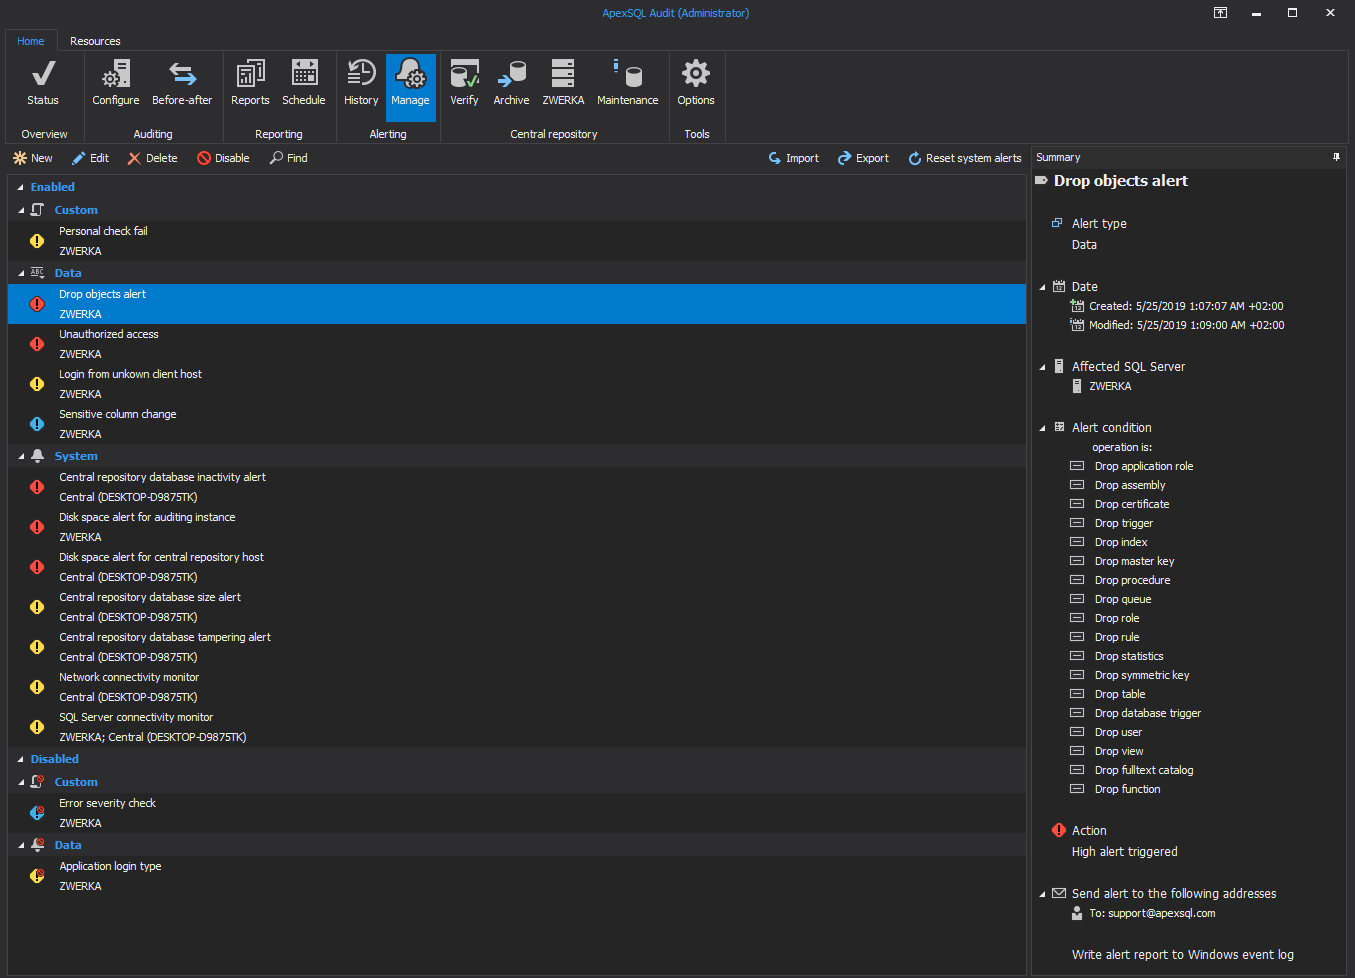
In the “Manage” alerts panel, users can enable or disable system alerts, alter them or create custom alerts which can notify them on specific auditing events and have the information written inside the windows event log for later reviews. Alert summary in the right shows full alert information for the selected alert
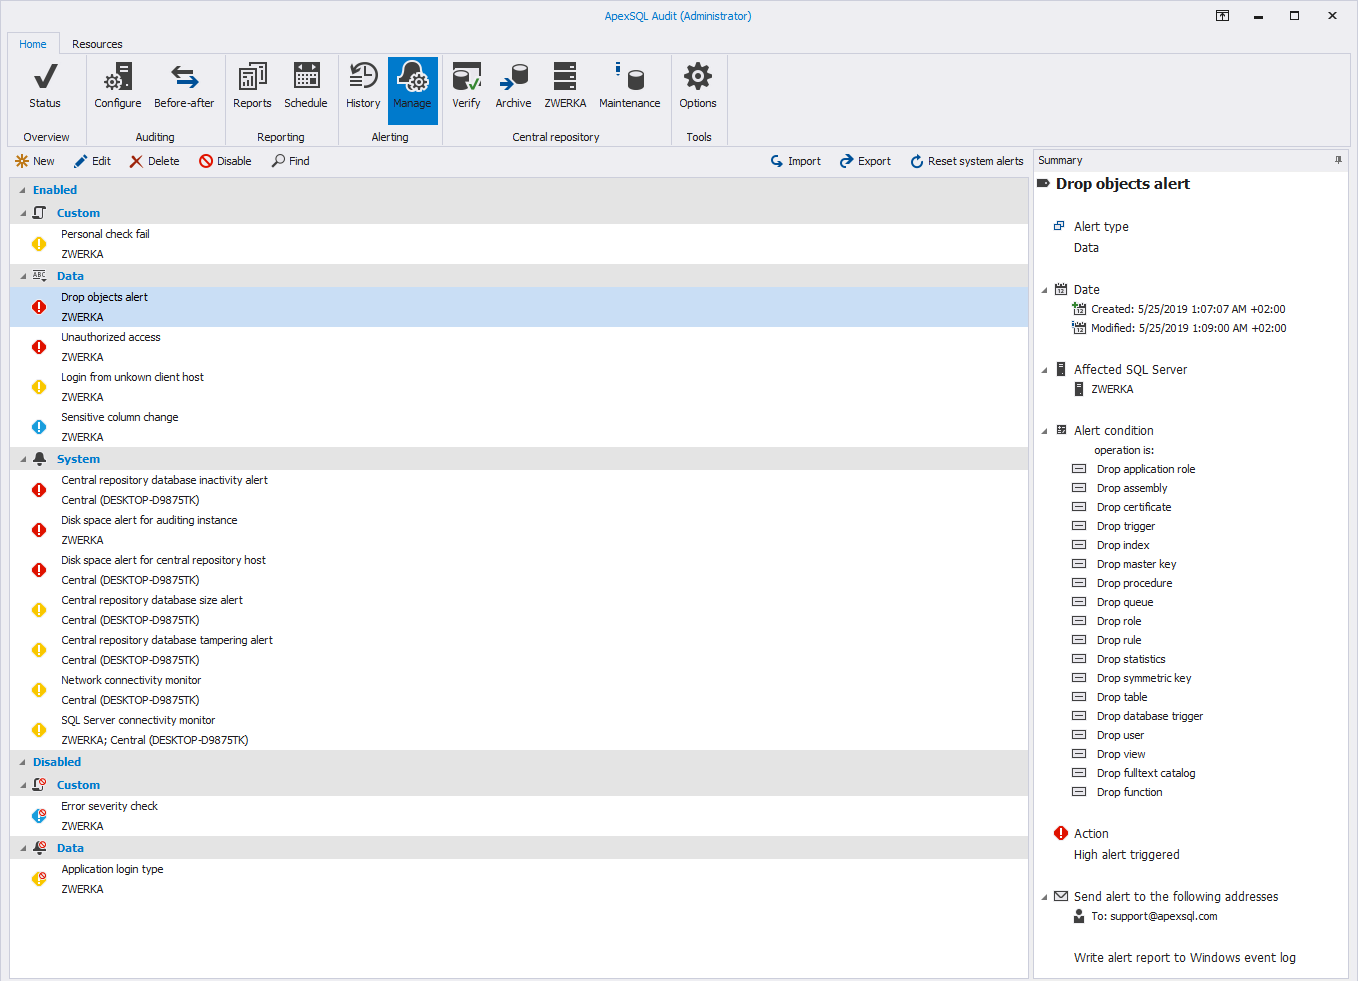
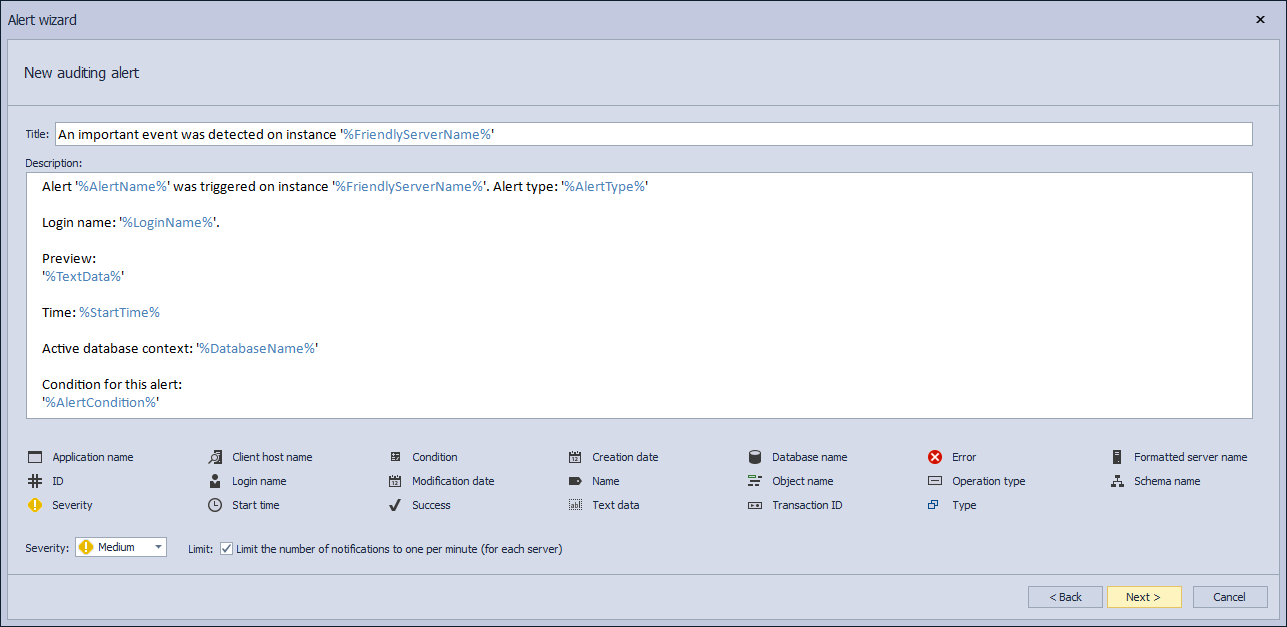
Same form in the light theme
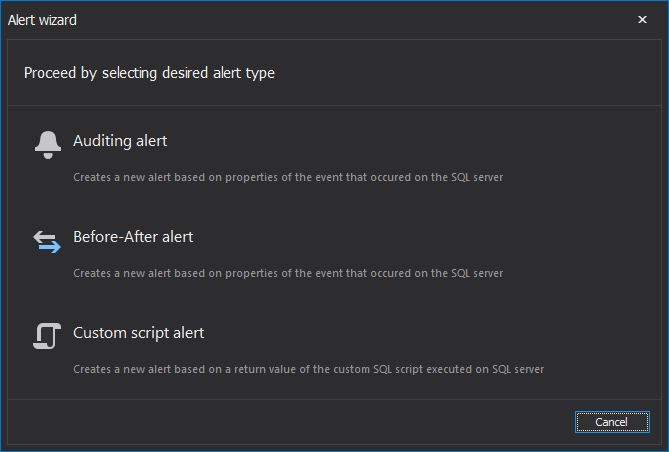
Creating a new alert is an easy task. After clicking on the “New” button, simply choose the alert type. Users can choose between auditing alerts, before-after alerts, and alerts that are triggered on custom script execution
In the next step, alerts title and description can be fully customized and wildcards can be used to get active information on the alert and SQL Server parameters and appropriate information
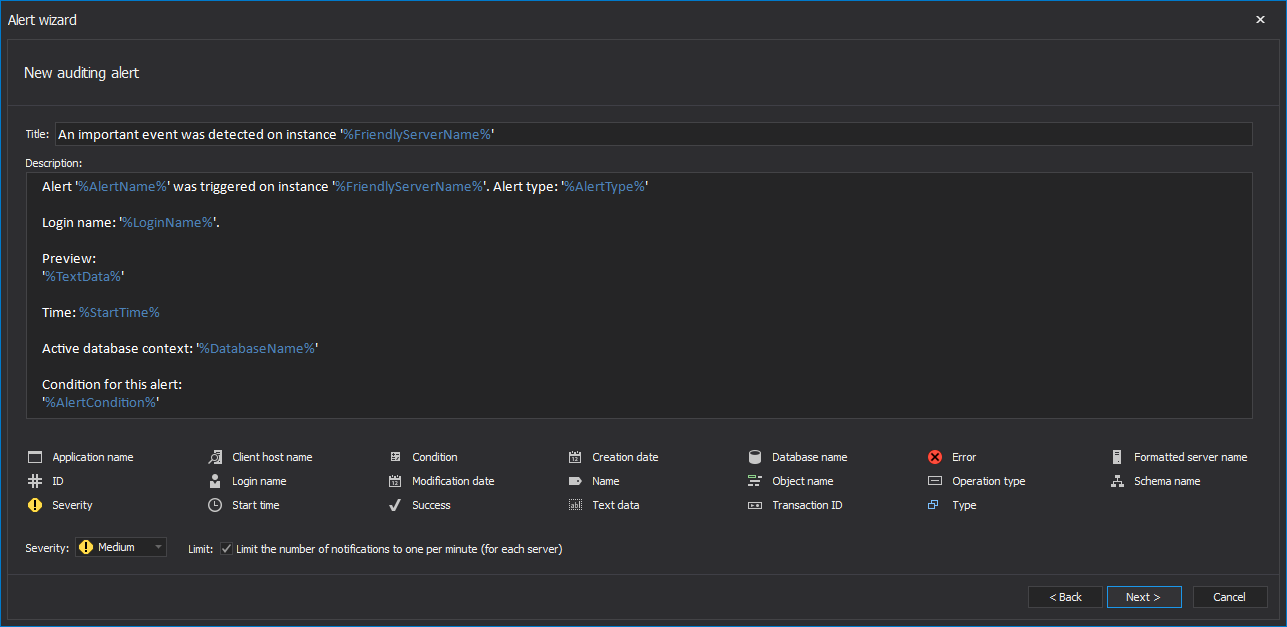
And here is a glance to the same form in the blue theme
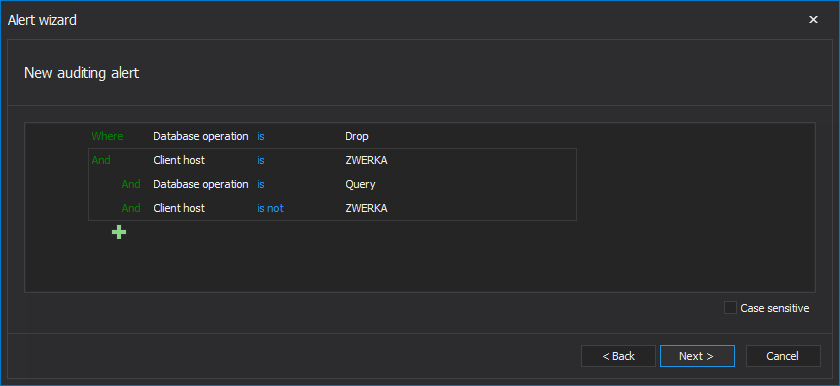
In the next step of the wizard, conditions for the alert need to be configured
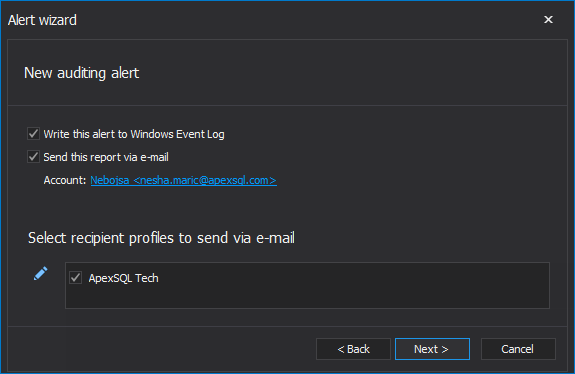
Finally, users can choose to have the alert written in the Windows Event Log or sent via SMTP to email addresses of interest
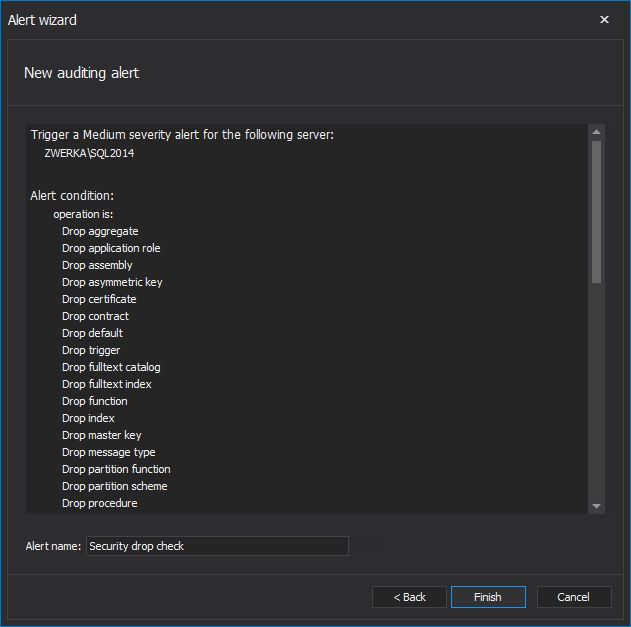
Finally, alert summary is shown and alert name can be chosen which completes alert configuration wizard
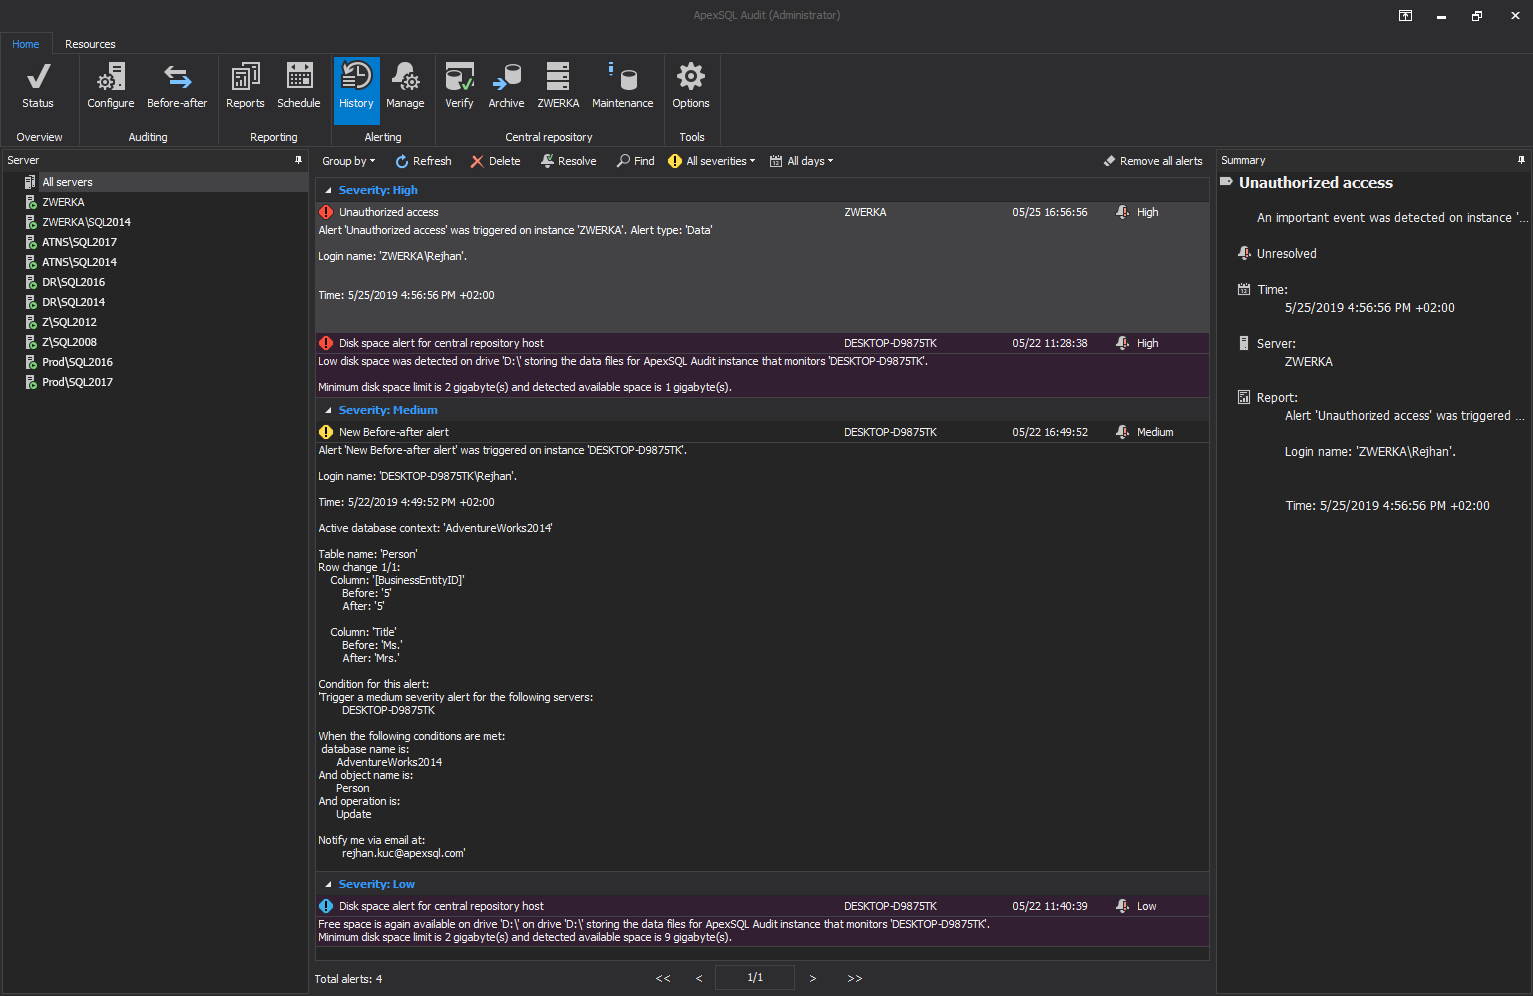
In the “History” panel in the “Alerting” group, users can investigate and manage all alerts that have been triggered across their SQL Server instances
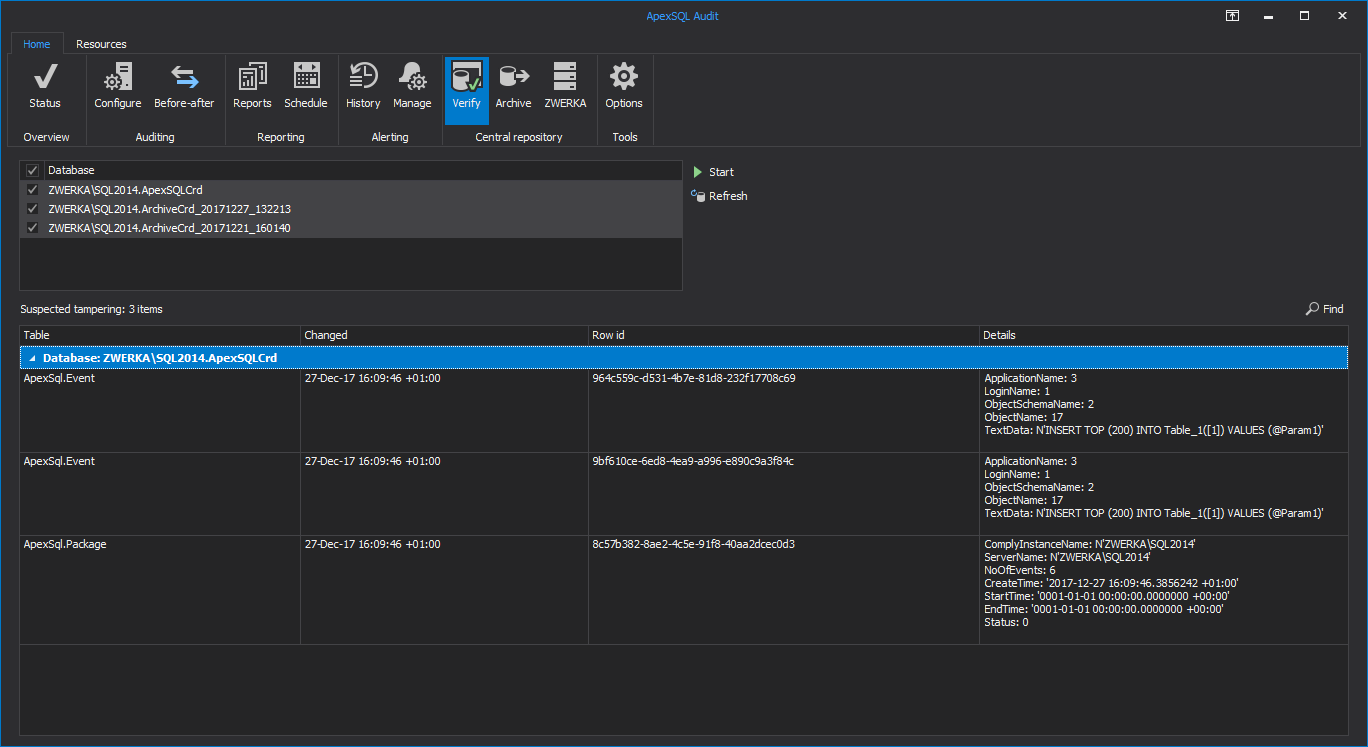
In the “Verify” central repository panel, users can run tampering checks for the current central repository as well as for any repository archives created in the past
Archive pane allows users to create and manage schedules archiving jobs which will automatically execute upon the schedule conditions met, manually pursue one or overview the history of performed jobs
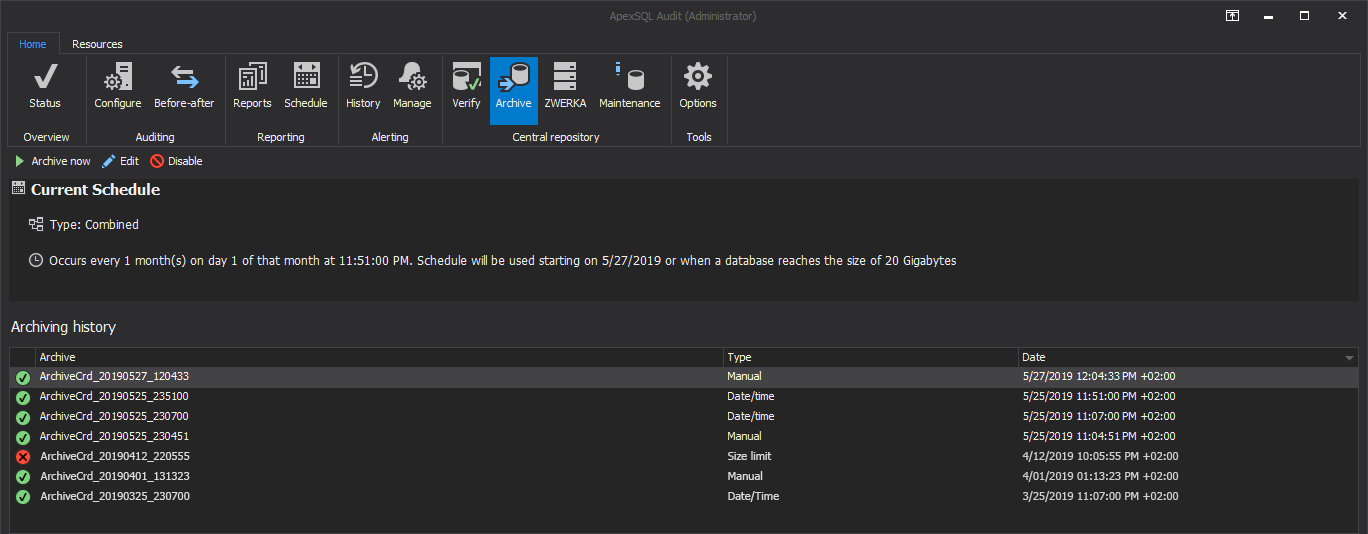
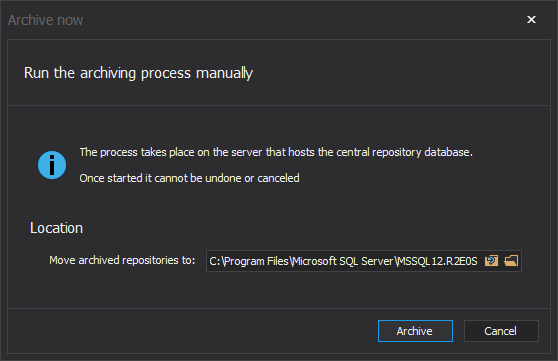
To manually trigger one, simply click on the “Archive now” in the header controls and confirm the Archive process in the pop up dialog
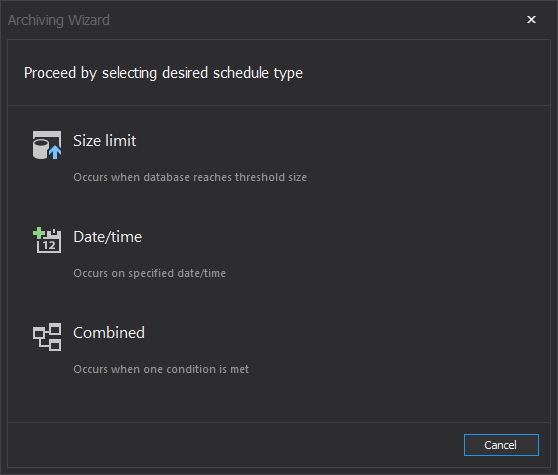
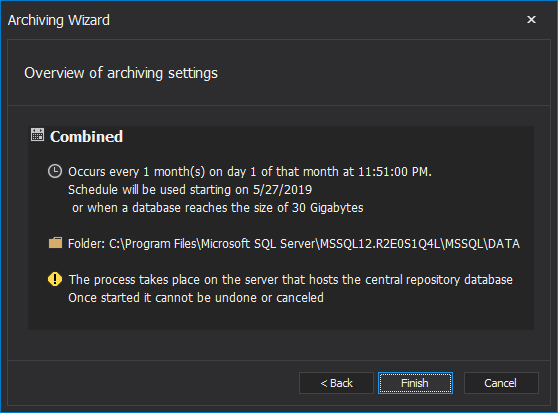
To update default Archiving schedule choose the “Edit” button in header controls and proceed with proper type between central repository size limit, time-frequency and combined which include both size limit and time-frequency to trigger it based on whichever comes first
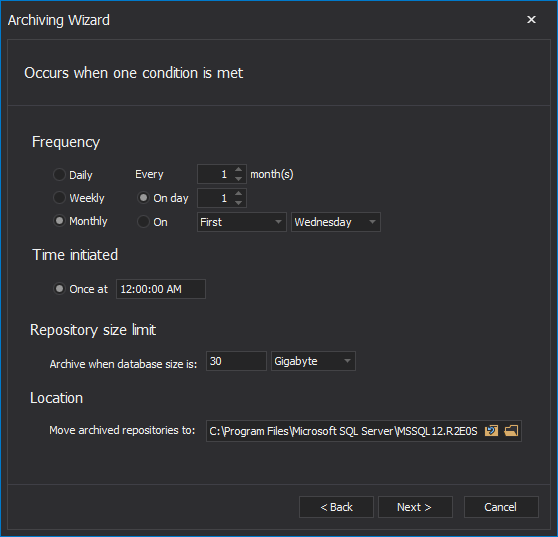
In the next step, schedule frequency to be configured
A quick summary overview is shown in the finalizing step of the wizard
Maintenance pane provides two different types of reporting sources preserving by splitting databases or purging data for easier handling against large database sources
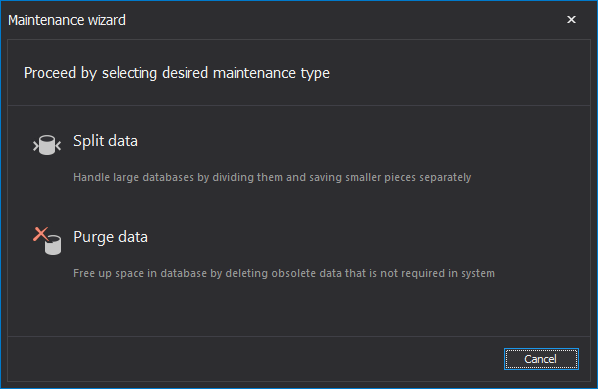
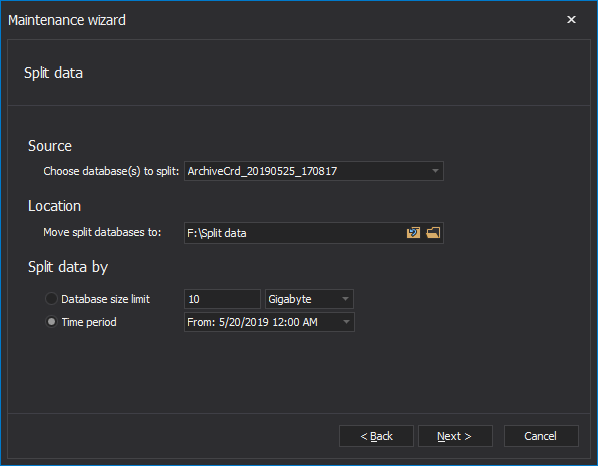
Split data option will chop database reporting source resulting in having multiple databases instead based on the cutting time value or database size limit
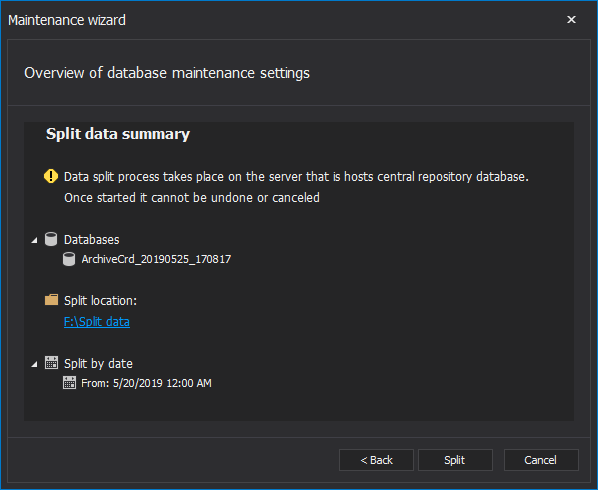
In the final step, quick maintenance settings overview is shown on which database maintenance job executes upon “Split” button click
On the other half, purge data provides deletion of unwanted records by choosing data source and time window to start working with
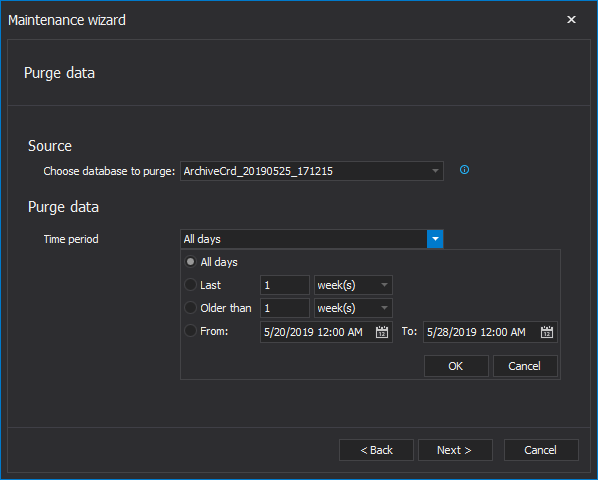
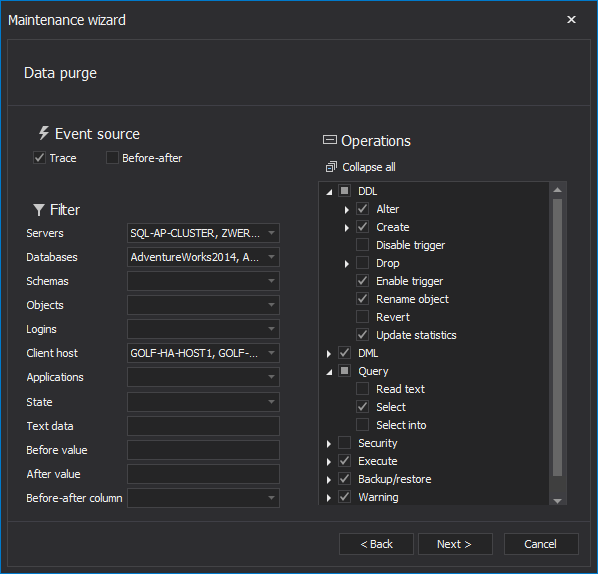
The next step provides configuration for the filter definition of data deletion
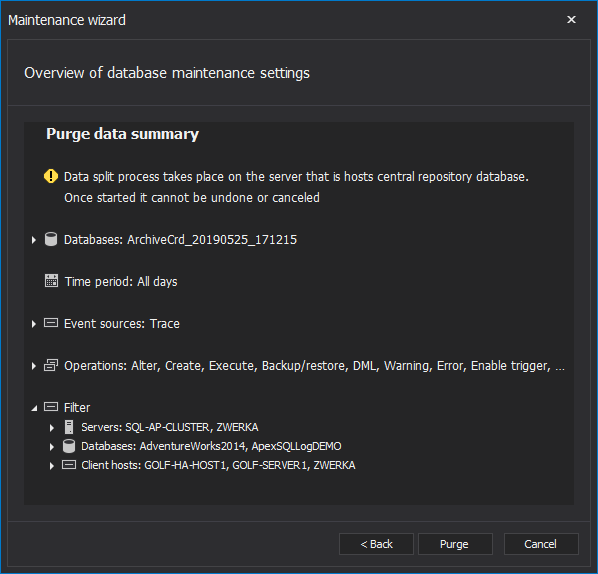
Summary overview of data purge setting is displayed in the last step of the wizard
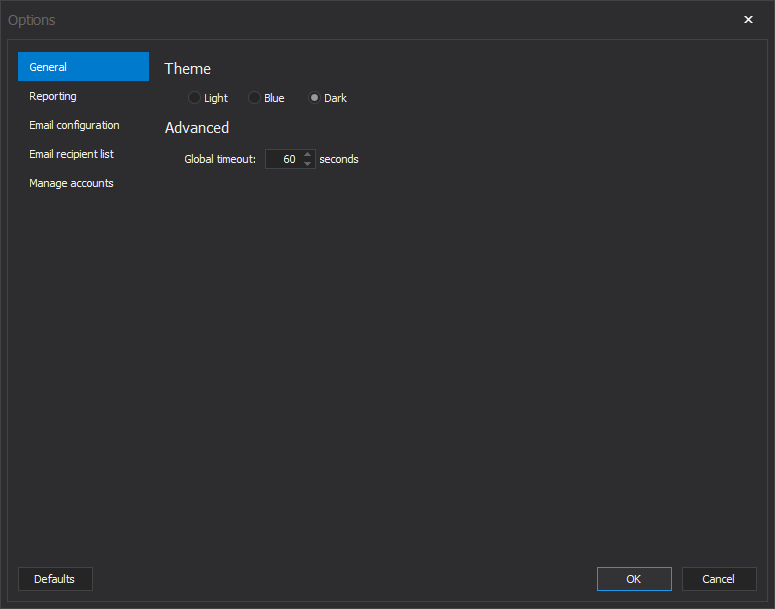
Options dialog includes several tabs to configure tools options.
The “General” tab allows users to choose application themes and set global timeout
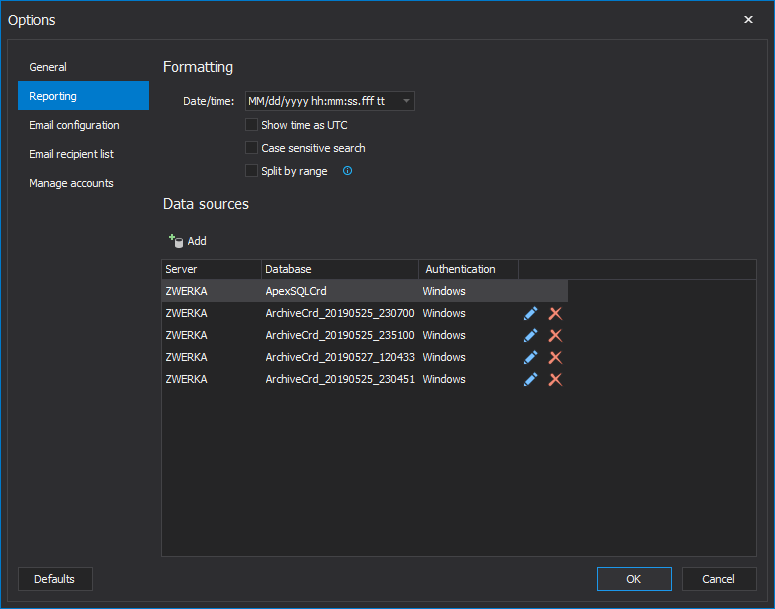
The “Reporting” tab allows configuration of date/time formatting as well as to configure which repository archives will be used as data sources for the ongoing reports
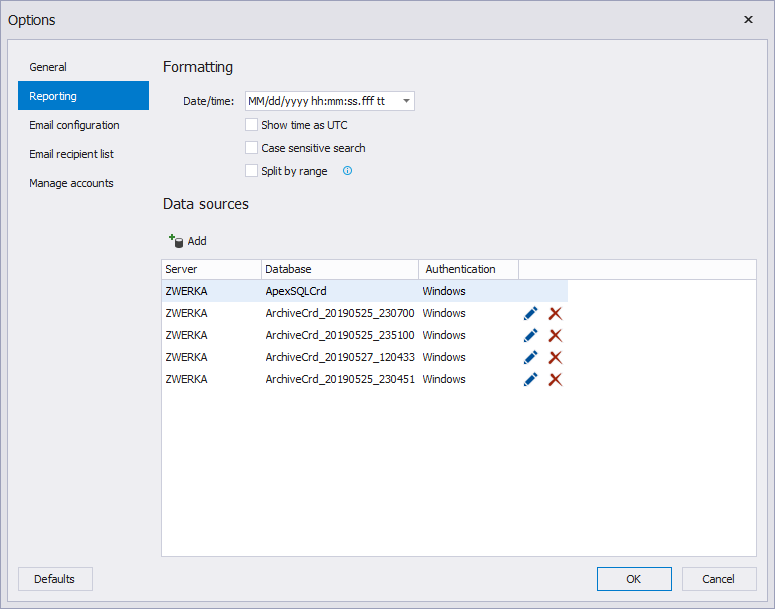
And here is light-themed Reporting tab
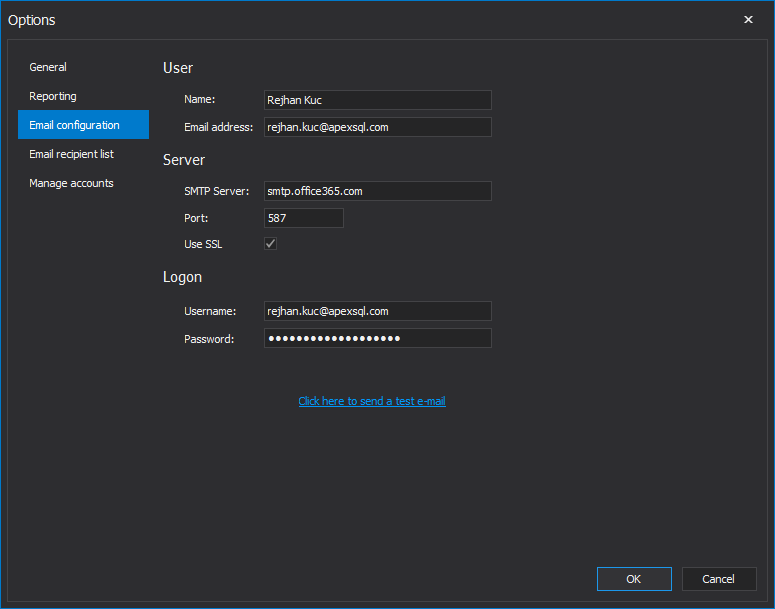
The “Email configuration” tab is used to configure server and appropriate details which will be used to send alerts and reports to specified addresses
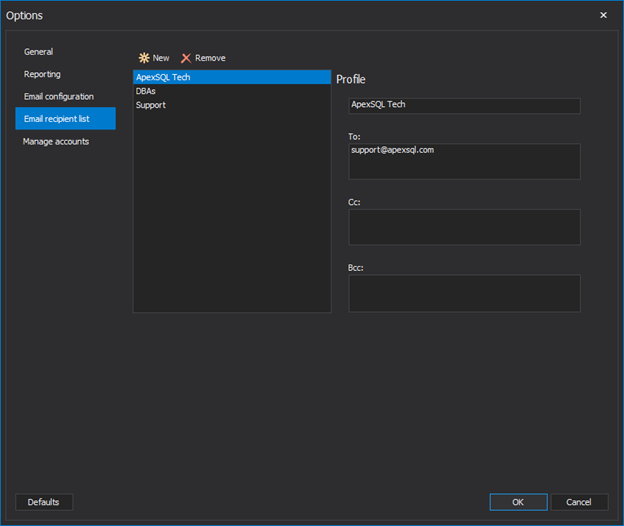
The next tab in the options dialog the “Email recipient list” allows users to create profiles which can be used as email recipients both for alerts and scheduled reports
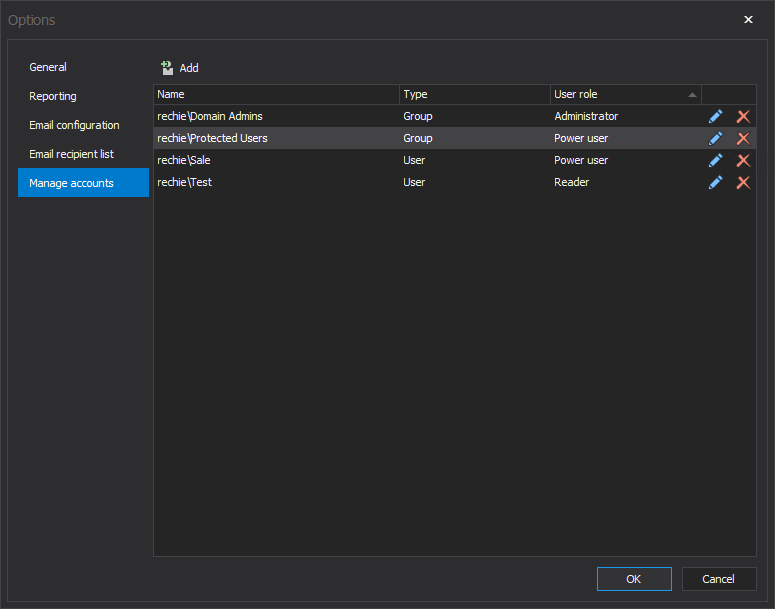
In the final tab in this dialog “Manage accounts”, users can manage both local and active domain users or groups by assigning the application role type, which is differentiated by Administrator, Power User and Reader where each of the roles defines a different set of capabilities of the tool’s management
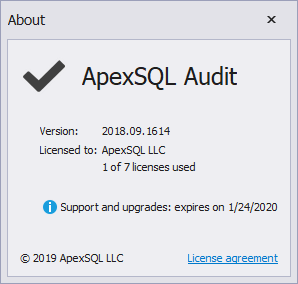
Clicking on the “About” form in the “Resources” tab in the main ribbon will show the form which includes details on the application version and licensing information
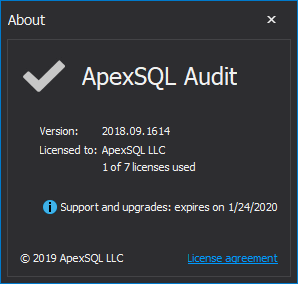
And here is the same form in the blue theme
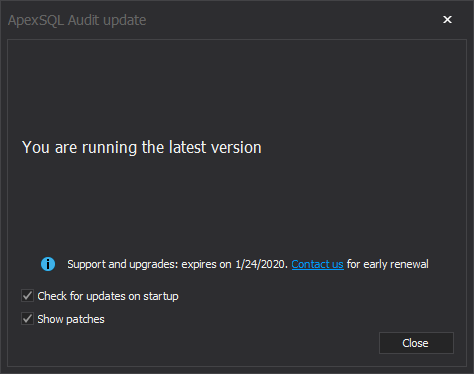
Clicking on the “Get updates” application will perform a check for any new versions available and allow automatic updates
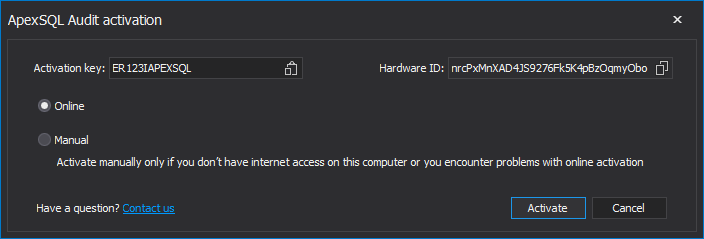
Clicking on the “Activate” button brings in the activation form which allows users to apply their activation licenses online or manually in cases where there is no internet connection
January 5, 2018


