


ApexSQL Log installation wizard is a simple 3-step task
Users first choose to install whether to install main application or server-side components
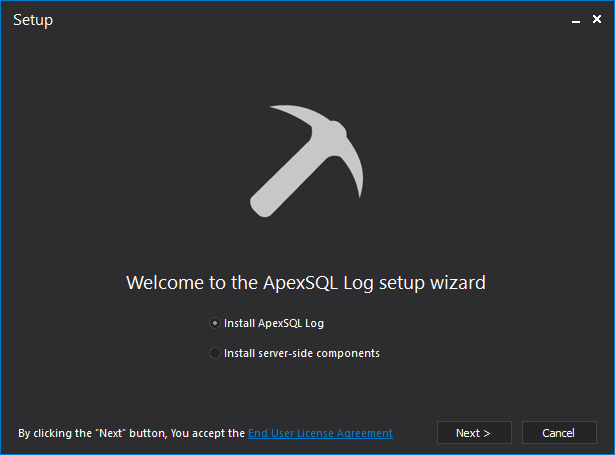
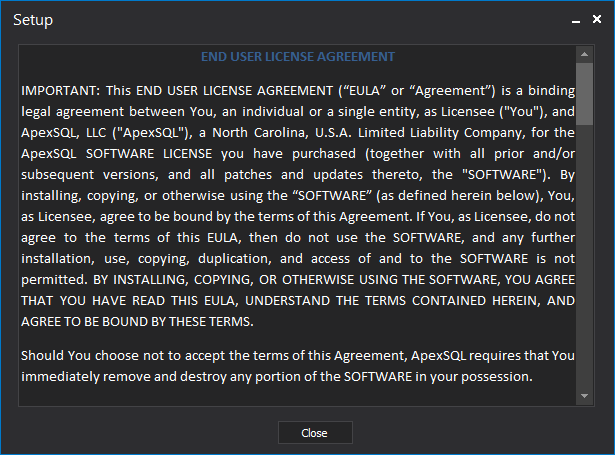
In this step, they can also check ApexSQL LLC EULA
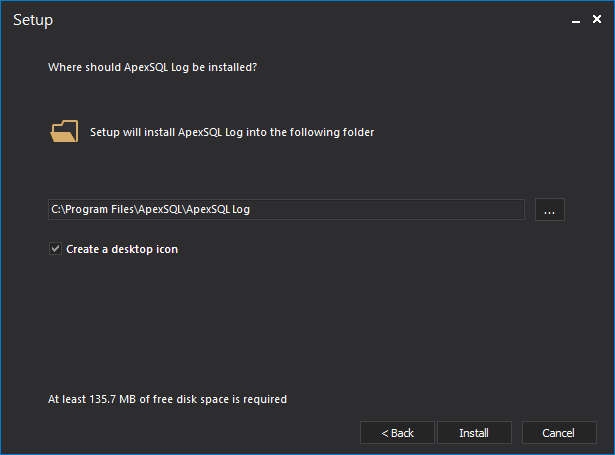
Next installation step allows users to choose installation folder and whether to create an icon
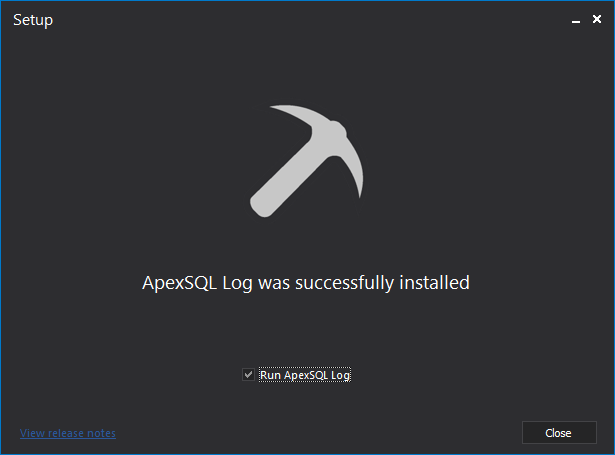
Final installation step confirms installation outcome and allows users to directly run ApexSQL Log from here
ApexSQL Log main menu consists of three tabs: Home, View and Resources.
Hope tab includes all options related to auditing tasks and options are grouped in organizational categories: Session, Action, Results and Tools which allow users to manipulate with auditing sessions, perform specific auditing and recovery tasks, to analyze and

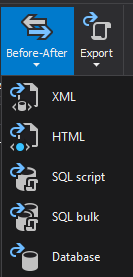
Before-after sub-menu allows users to directly choose an output for before-after reports
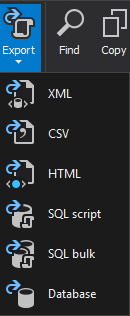
The “Export” menu is similar, and shows all available formats for report exports
Second main menu tab – Views allows users to choose which specific panels will be shown

Third and final panel “Resources” includes options which allow users to get in touch with ApexSQL Support teams and to handle licensing related tasks

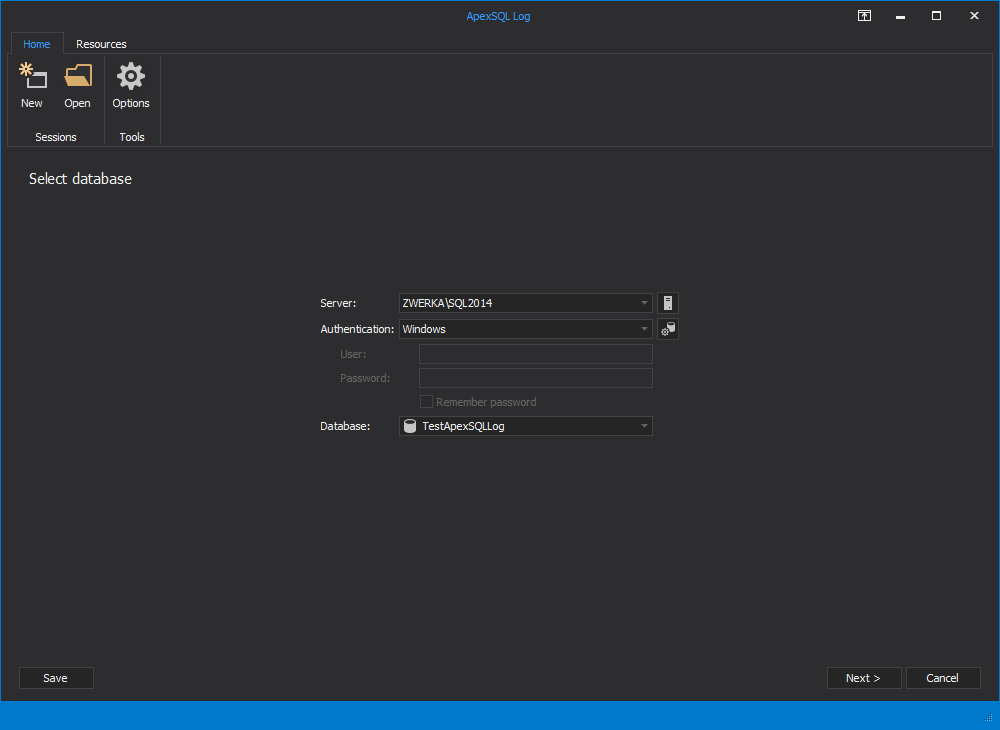
The “Session” wizard, is a starting point for each auditing tasks performed via ApexSQL GUI. It allows users to choose SQL Server instance and database that will be audited, as well as to input connection details
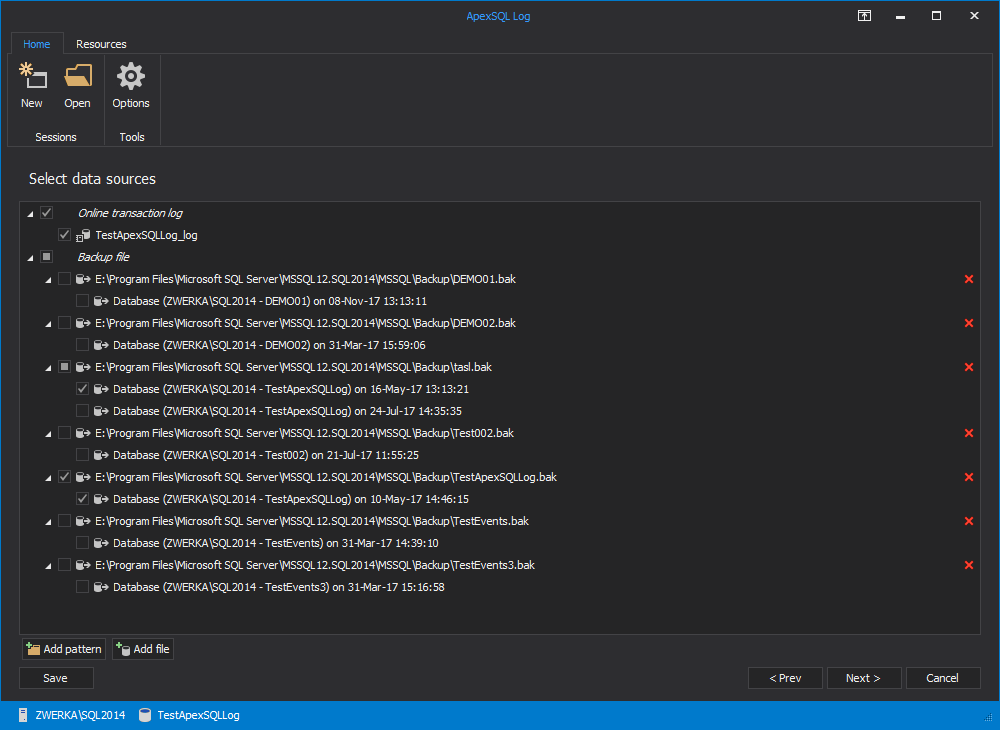
The “Select data sources” step of the wizard allows users to add their transaction log files and backups for auditing
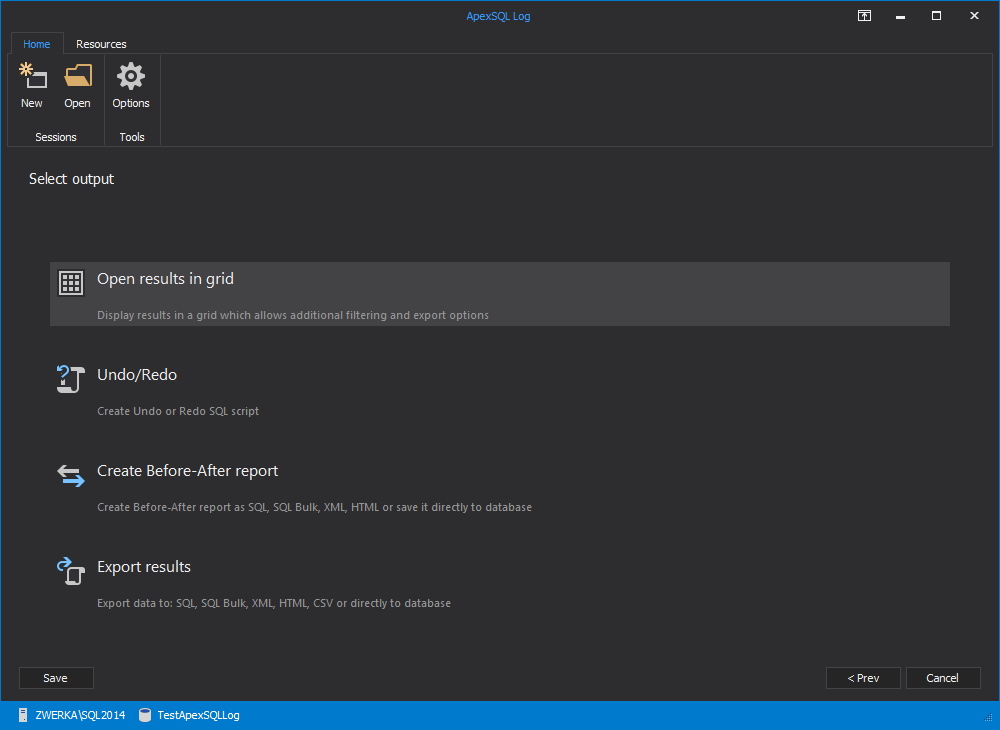
The “Select output” step of the wizard allows users to choose the output of their auditing task. They can choose between opening results in grid, direct creation of undo/redo scripts, creation of before-after report, or export creation
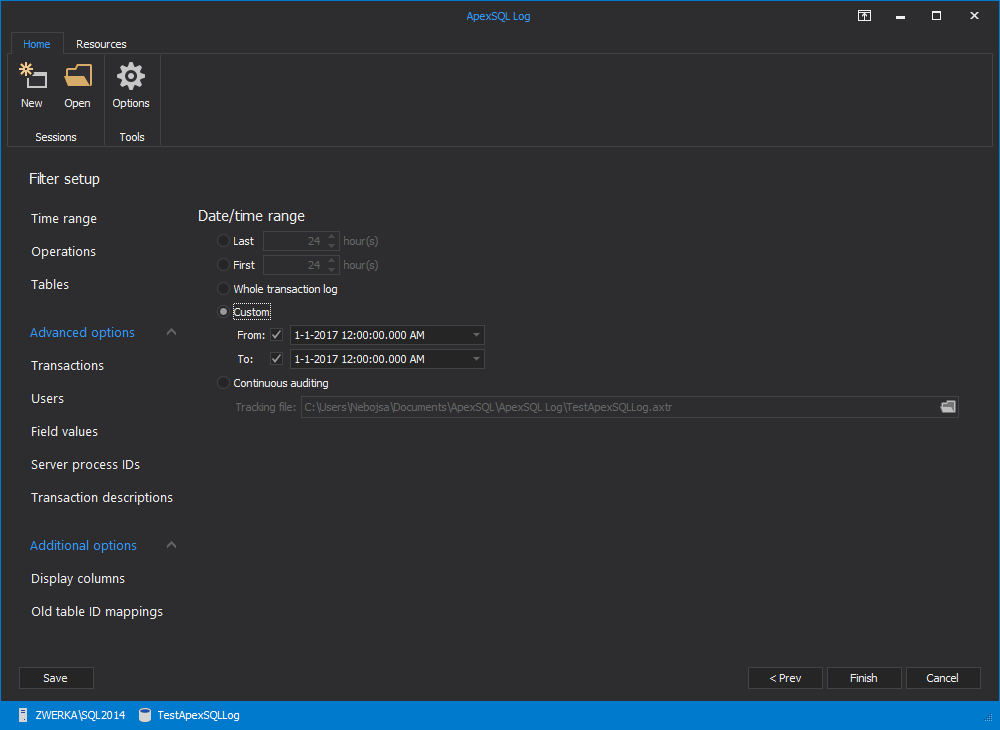
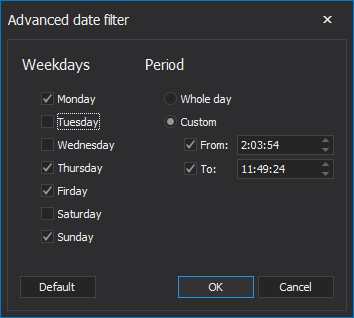
Regardless of the output choice, the next step of the auditing wizard is a filter setup where users can choose between plethora of available filters, starting with time/date filter
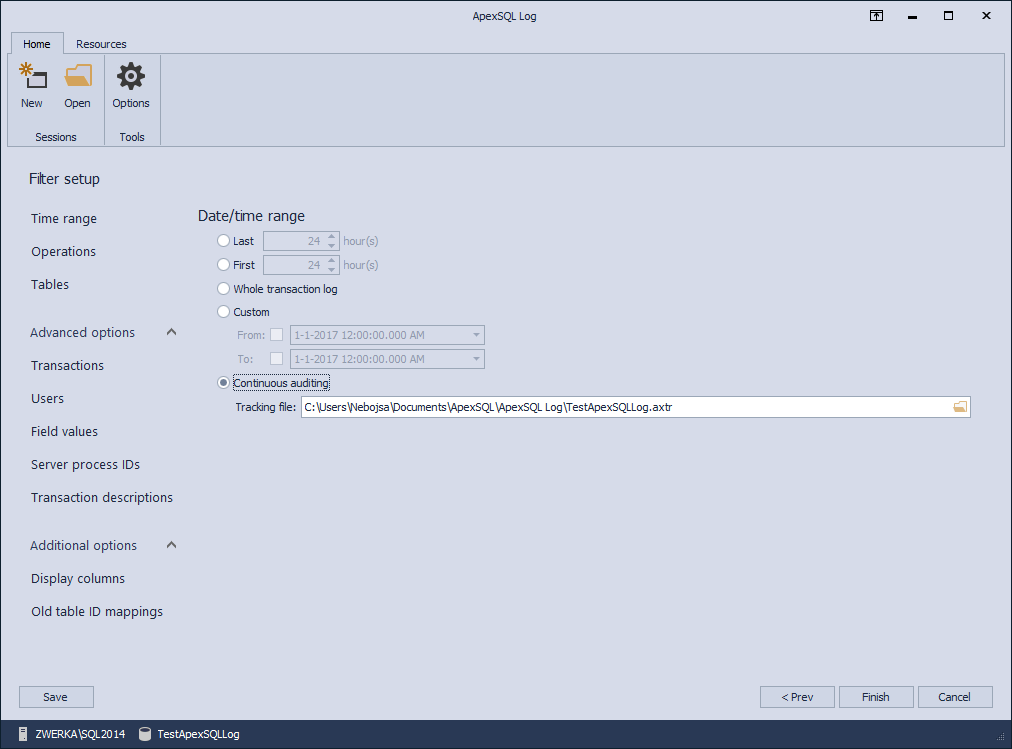
And here is the look of the filter setup in “Blue” theme
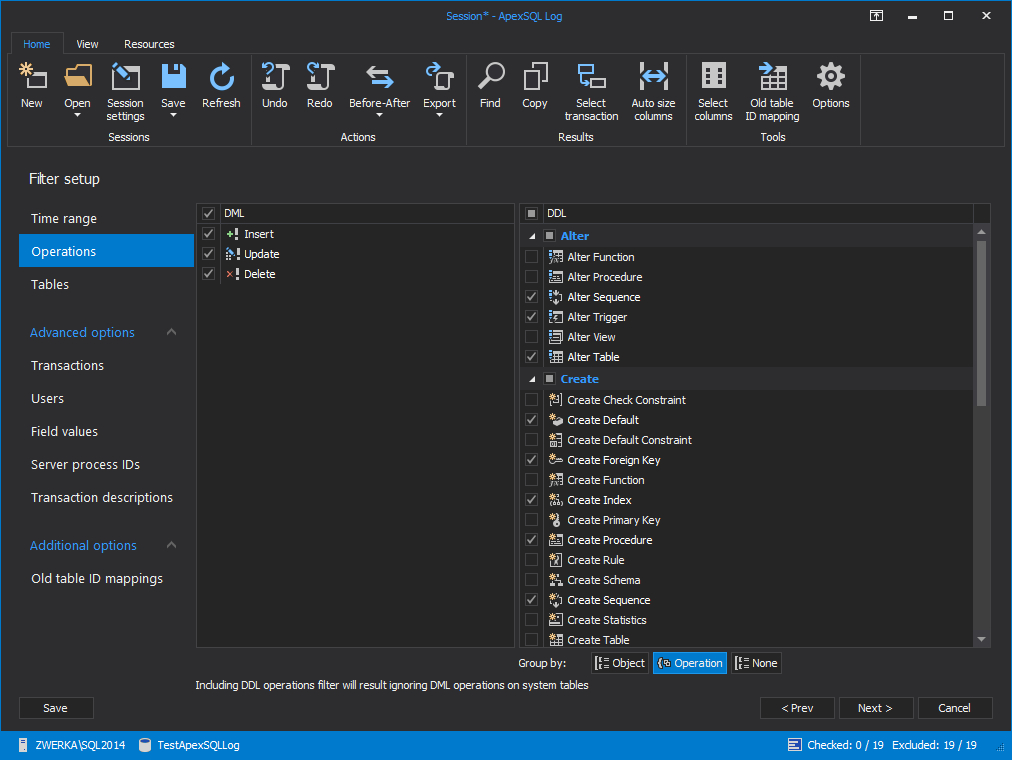
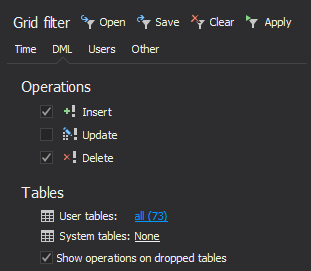
The “Operations” filter allows users to choose which DML and DDL operations will be included in the auditing task
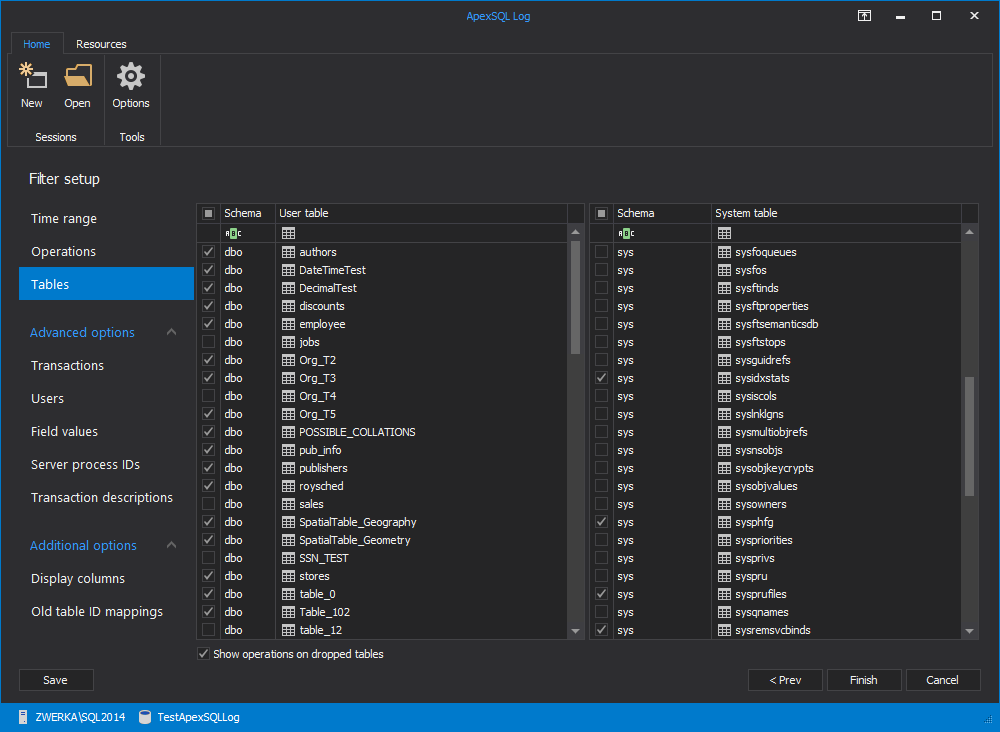
The “Tables” filter allows users to choose which user and system tables will be included in the auditing job
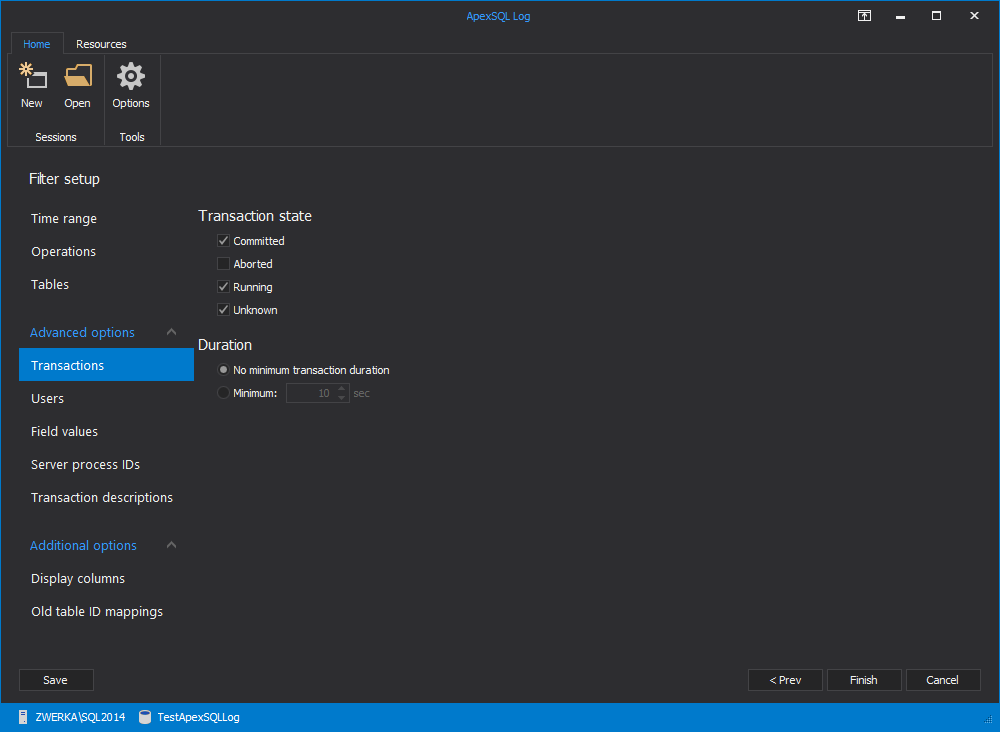
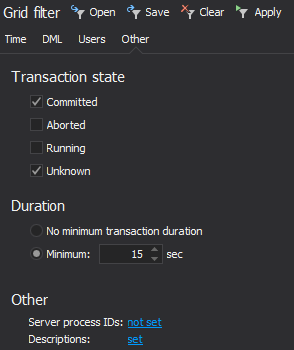
The “Transactions” filter allows users to filter operations per transaction state and duration
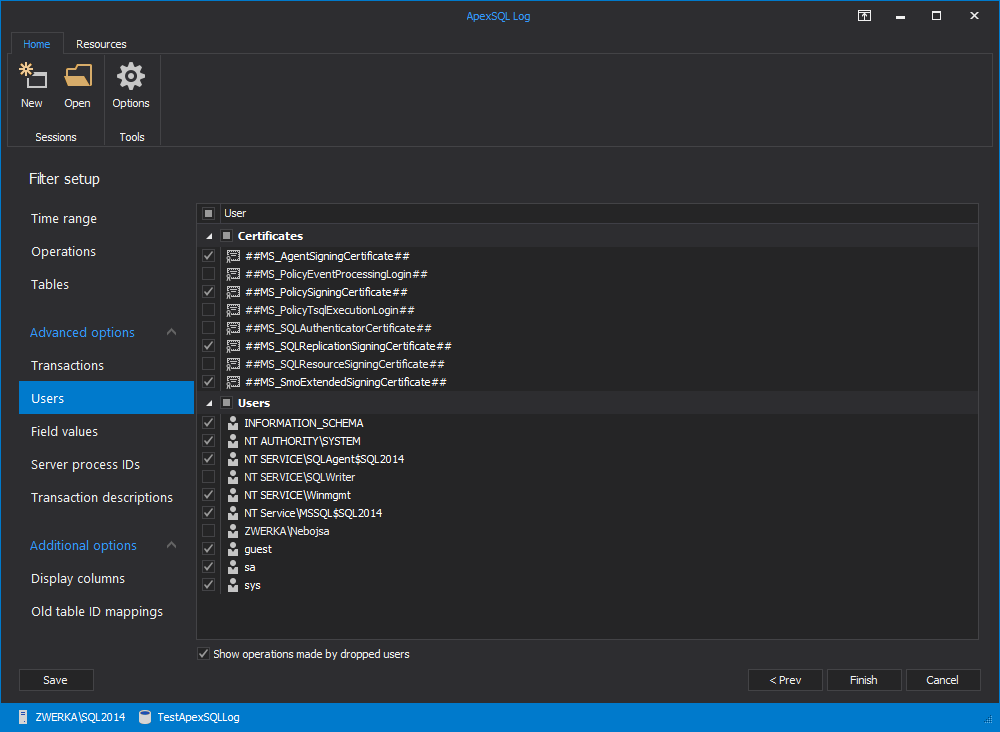
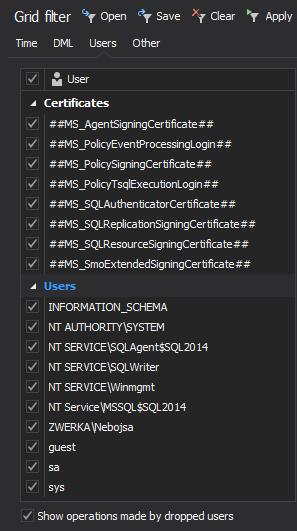
The “Users” filter allows filtering by specific users and certificates
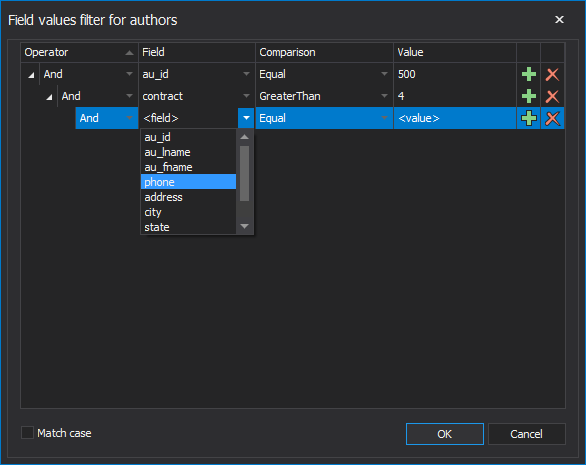
The “Field values” filter allows users to set specific thresholds for values for multiple table columns
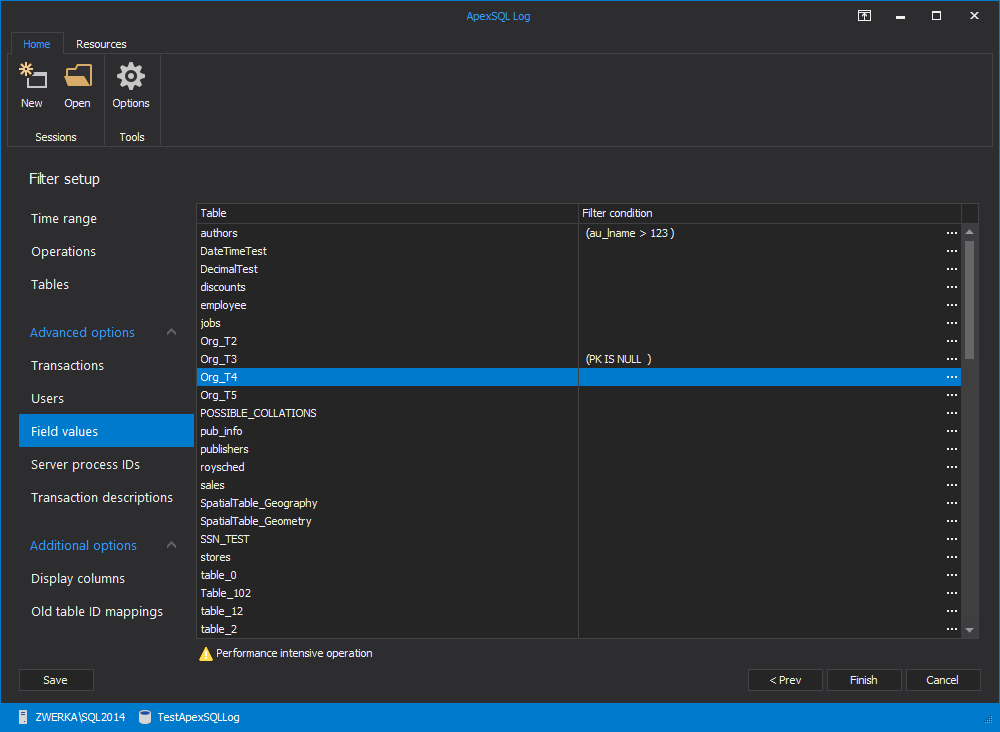
Users can combine as many filter as required to achieve desired filter precision
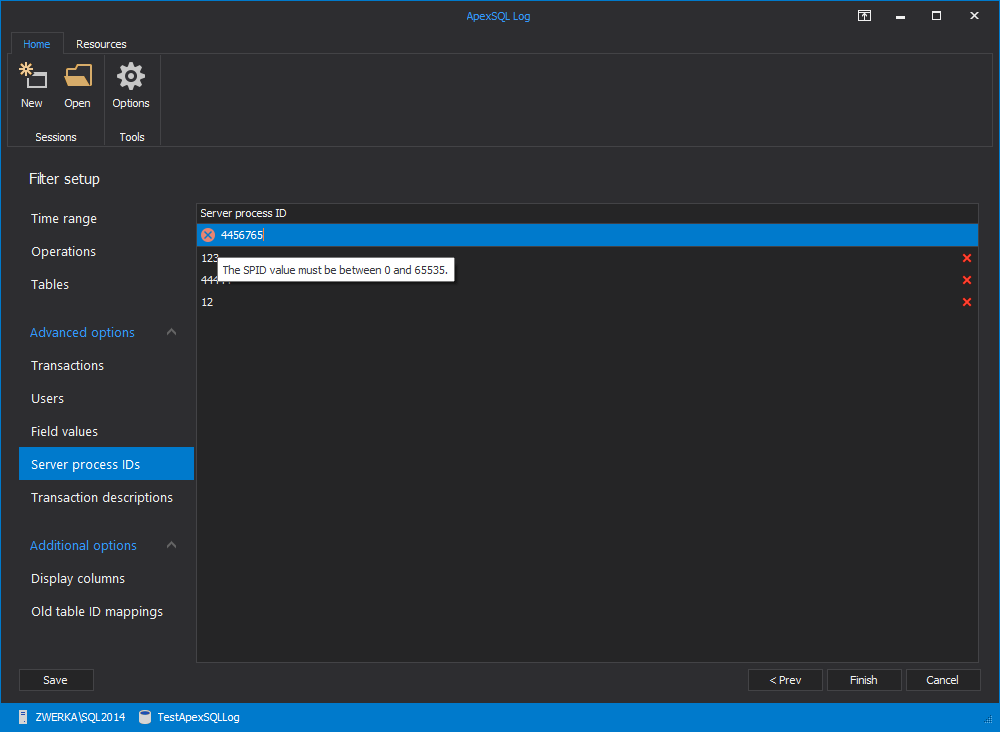
Auditing results can also be audited per specific server process IDs
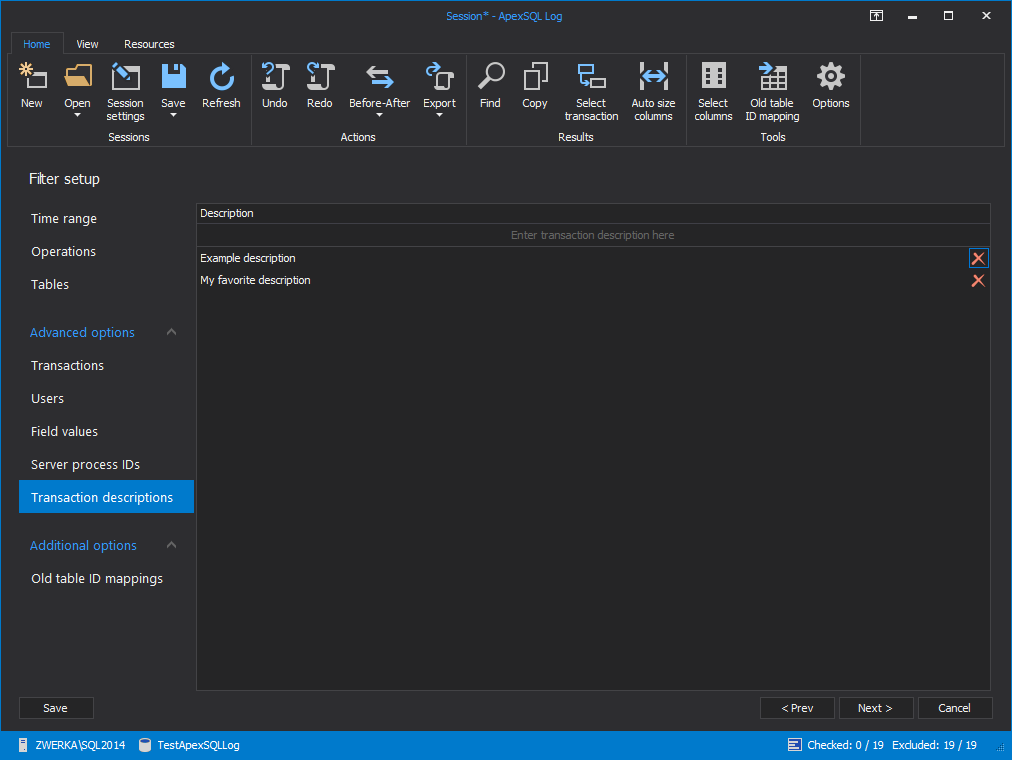
As well as per added descriptions
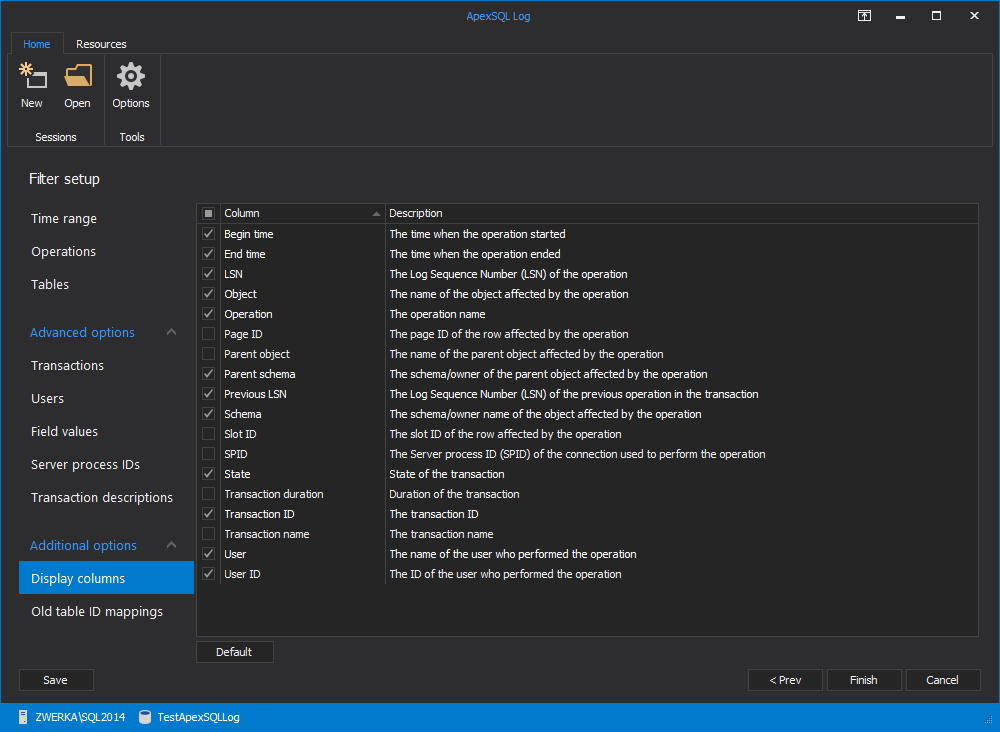
Under “Additional options” sub menu, users can choose which column will be included in the auditing results
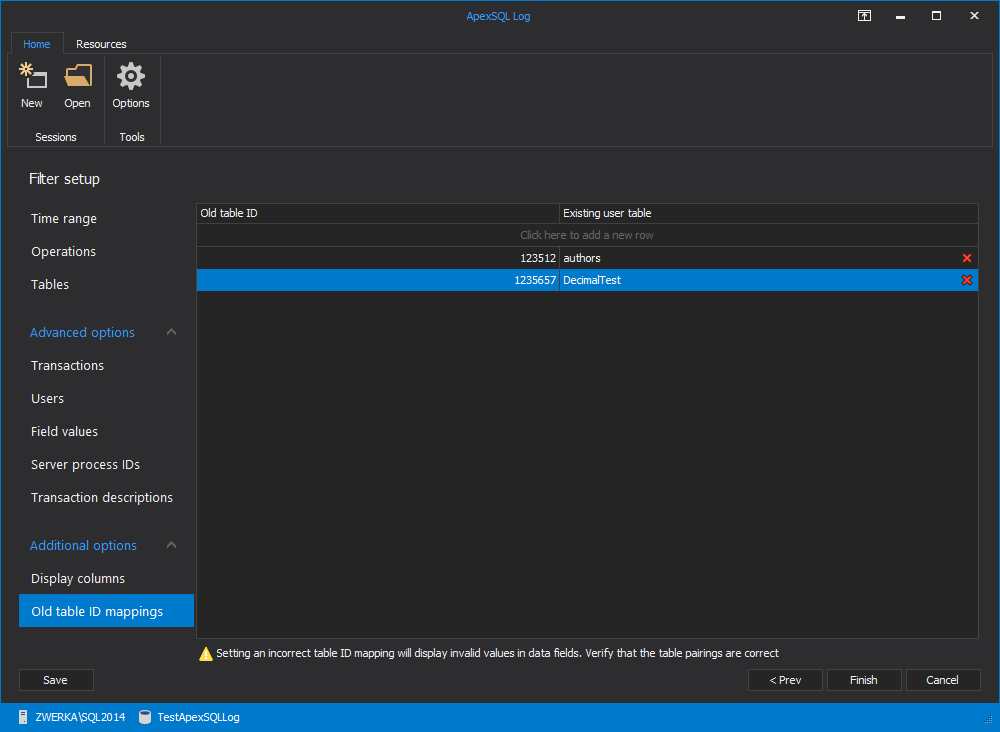
Last, but not least, users can use “Old table ID mapping” to map re-created tables that were dropped at one point to their new better parts
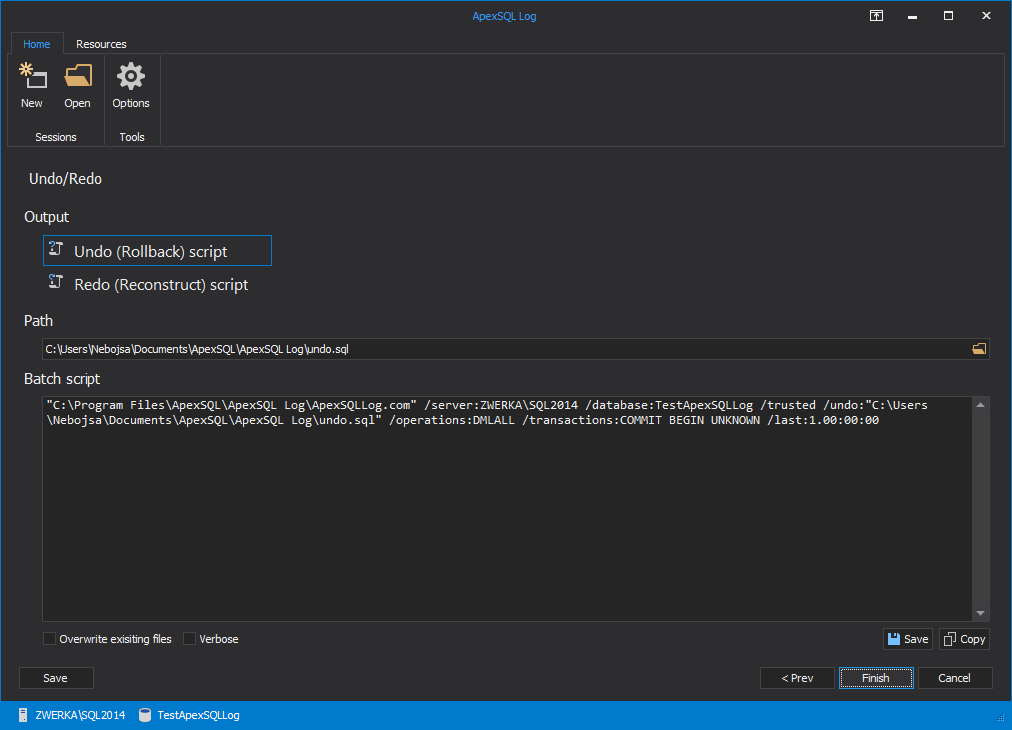
If an option to create undo/redo script is selected as desired output, an undo/redo details pane is shown after the filter setup step of the wizard where users can choose script options and have insight into appropriate batch script. From here, the script is either created via GUI by clicking on the “Finish button” or displayed batch script can be run from command line interface
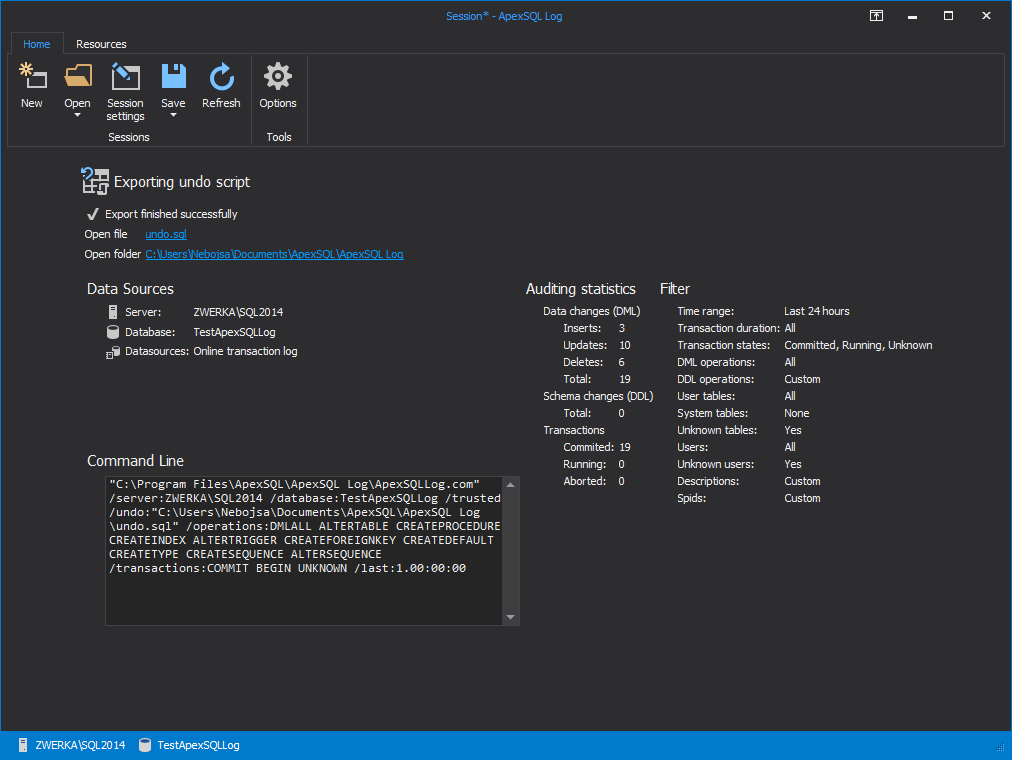
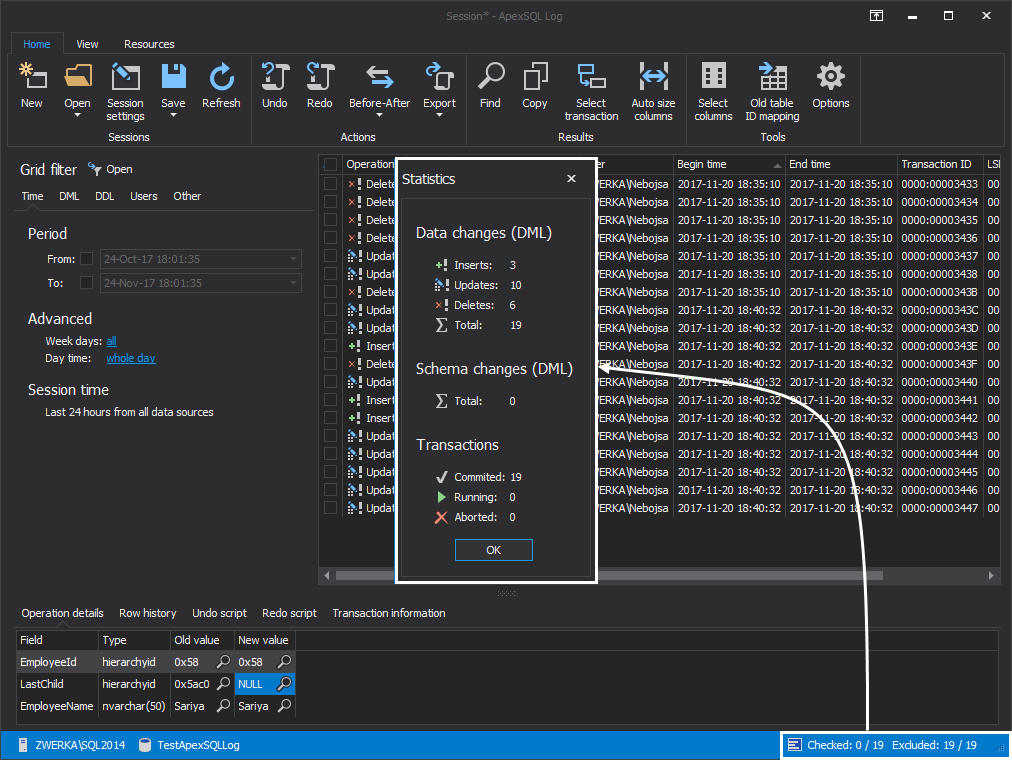
Once the processing finishes, summary screen shows final details. Users can see auditing statistics, information on the performed task and directly access created file
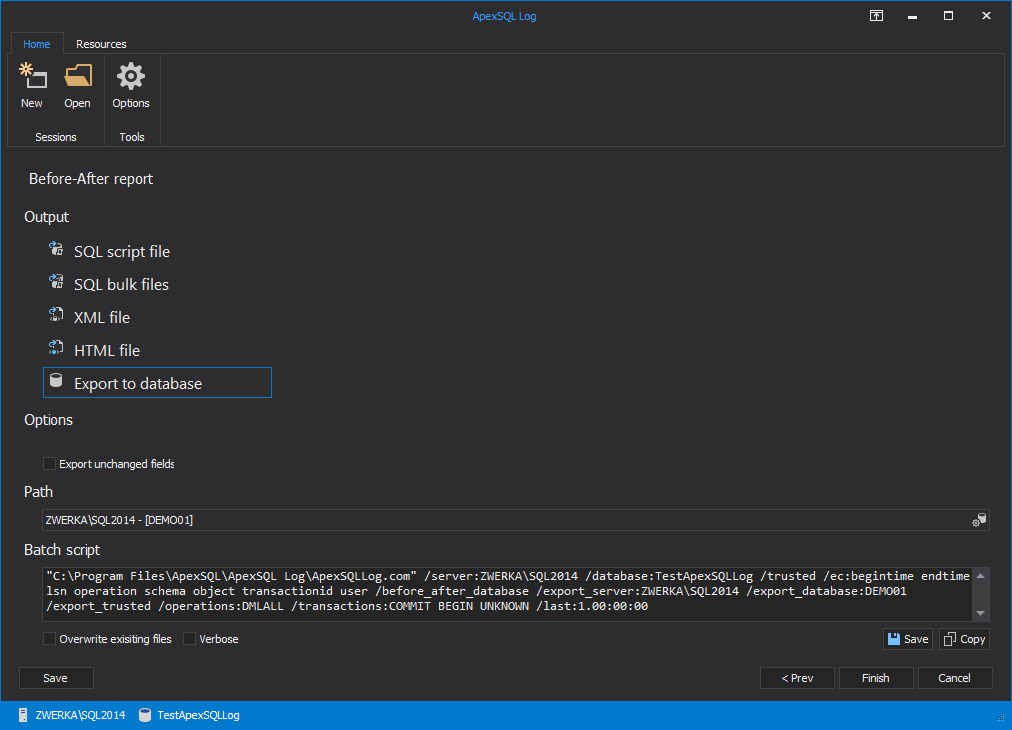
If Before-after report is chosen as auditing output, similarly to the undo/redo final pane, users are shown with options to choose the output for before-after report as well as all related details
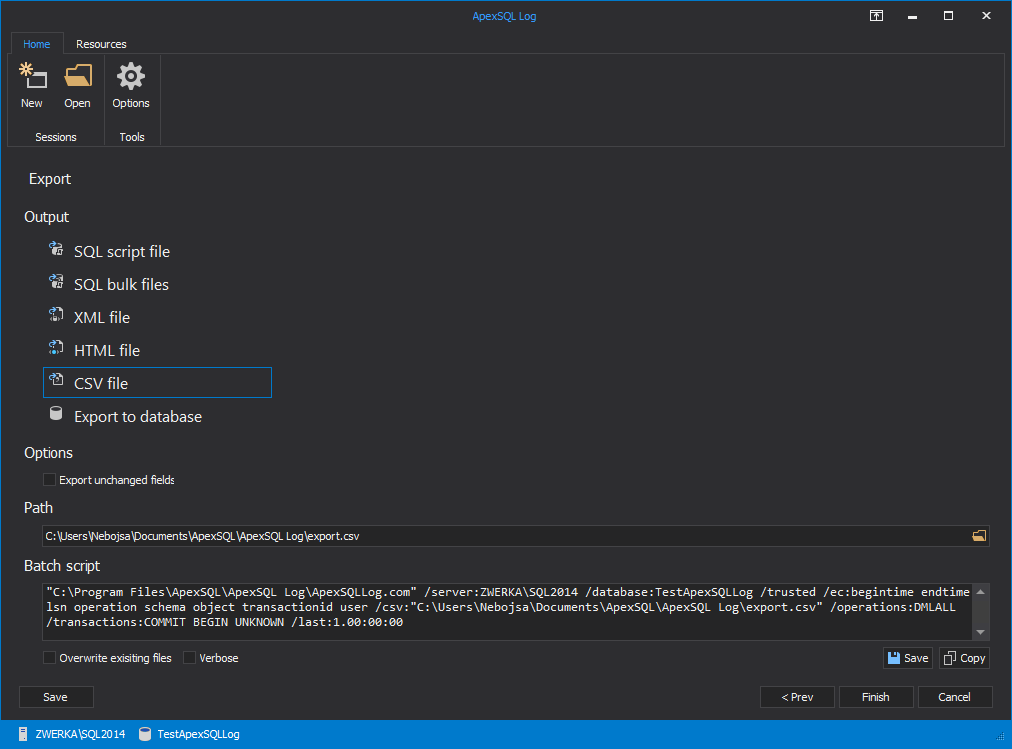
In the same manner, when creating a report export, the next step of the wizard allows users to input export options
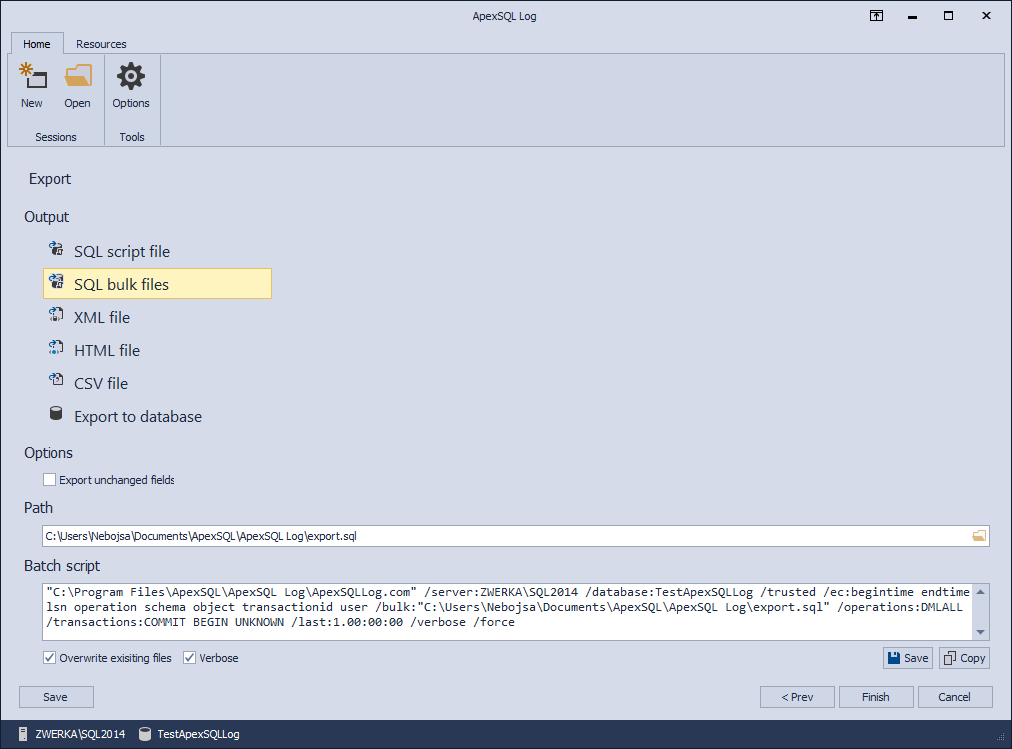
And here is the final step of the export wizard in blue theme
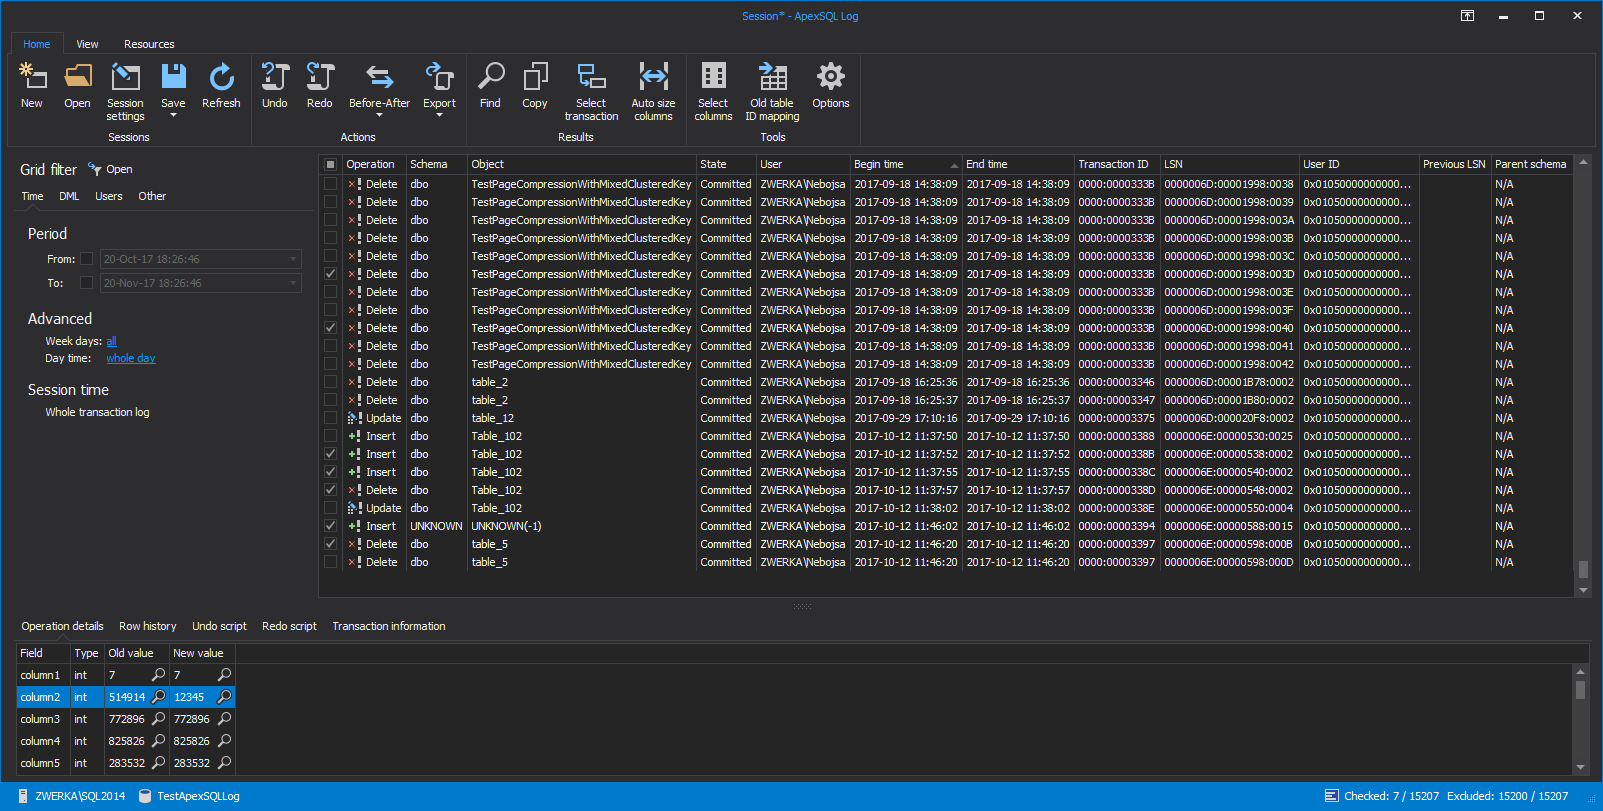
If the option to “Open results in grid” is chosen as the auditing output, after short processing, users can see visualization of their transaction log file in the comprehensive grid where they can further investigate and analyze results and create desired outputs from there
Some may find blue theme more appealing…
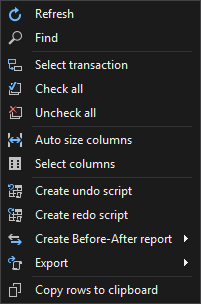
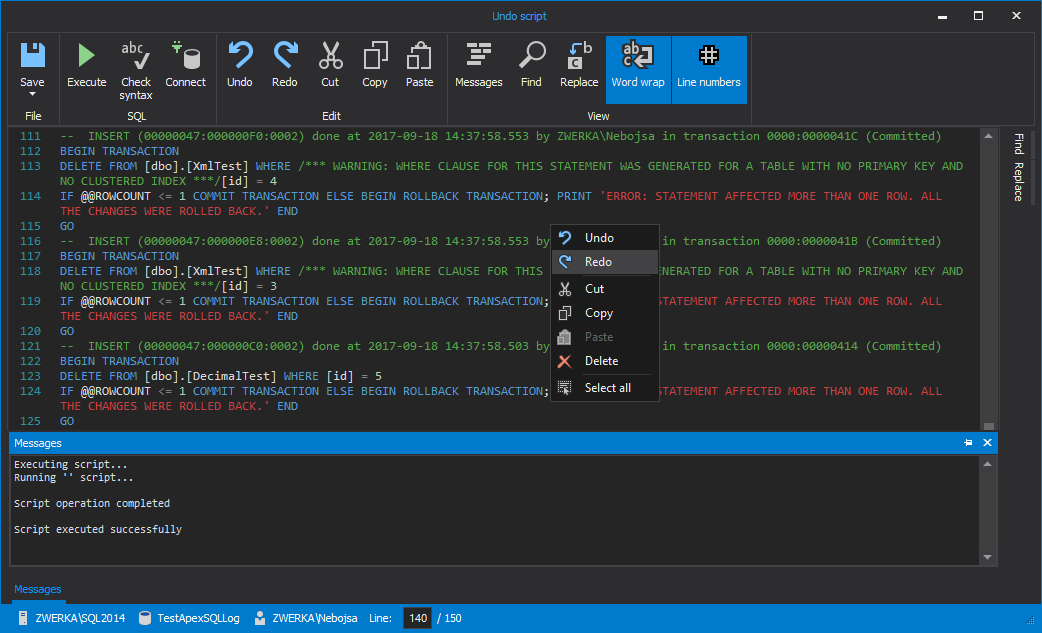
While options for grid manipulation are available in the main ribbon, they can also be accessed from the context menu
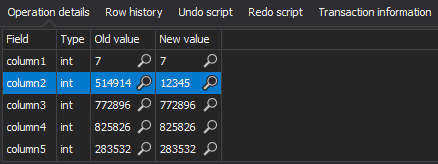
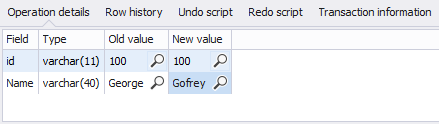
In the bottom panel, users can find several different panels with additional information on operations shown in grid, starting with Operation details, which will show before-after values for appropriate operations
It looks great in white theme too
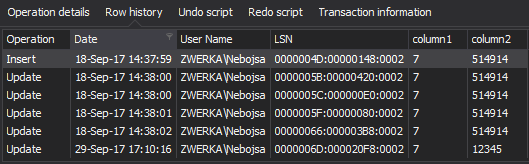
Next is the “Row history” pane which shows complete history of the row affected by the selected operation
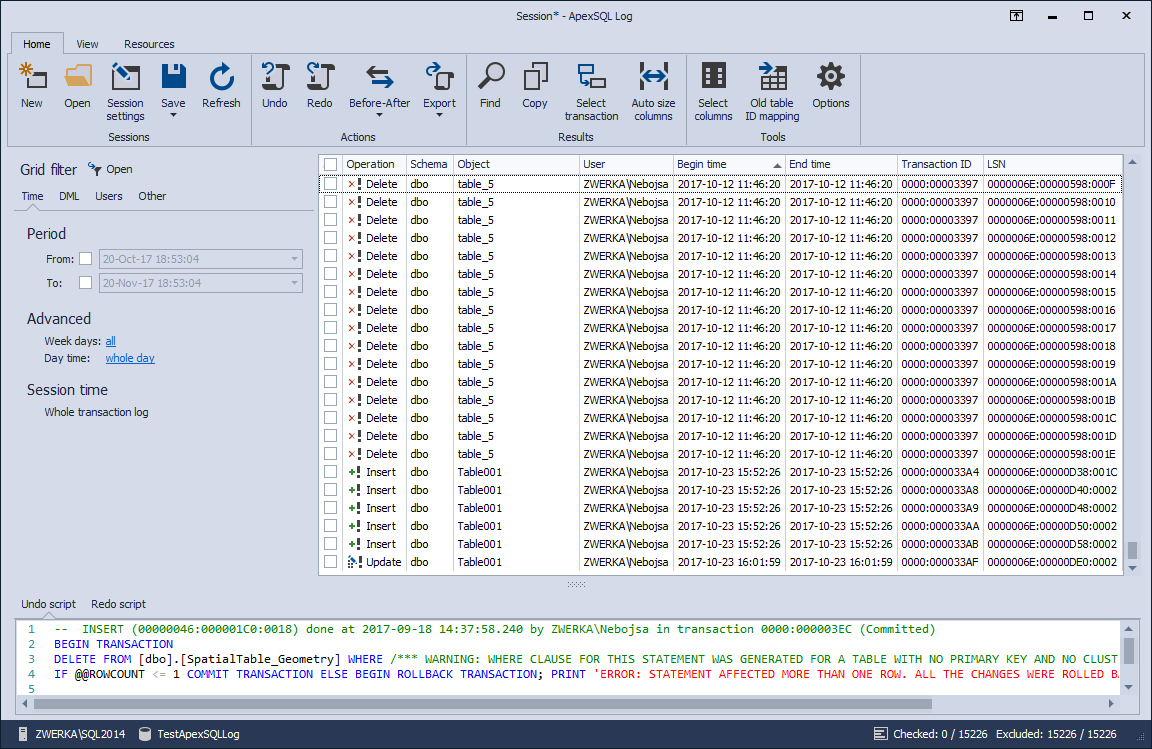
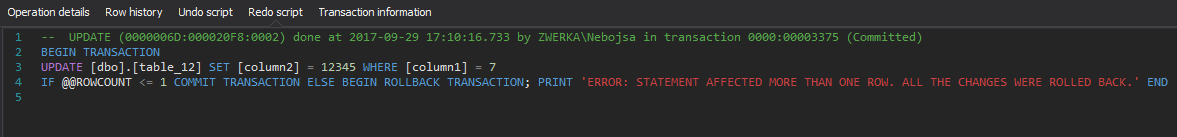
The “Undo script” pane show a rollback script for the selected operation
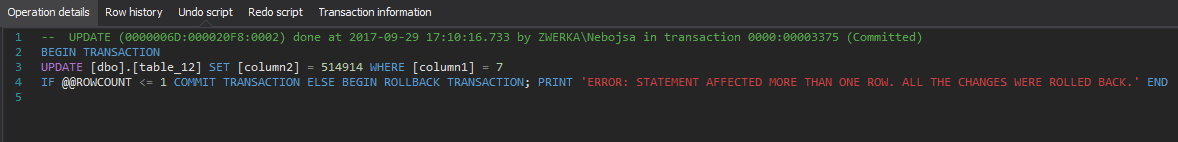
The “Redo script” pane shows a replay script for the operation selected in grid
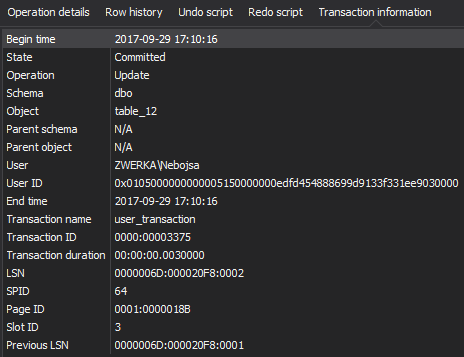
The “Transaction information” pane shows variety of information for the transaction which included selected operation
Aside from the filters imployed in the session wizard, additonal filters are available from within the grid, so the users can fine-tune their auditing results. Users can utilize DML and DDL filters as well as table filters
Auditing results can also be filtered by time and date
Next, User and certificate filters are also available within grid
And so are other filters which were initially available in the session wizard, including transaction filters, SPIDs, descriptions, field values and more
Additionally, auditing statistics are available by clicking on the statistics pane in the toolbar
Users can opt to create undo/redo scripts only for specific operations selected within the grid. These scripts can be then shown inside internal editor where they can be edited and applied against chosen database
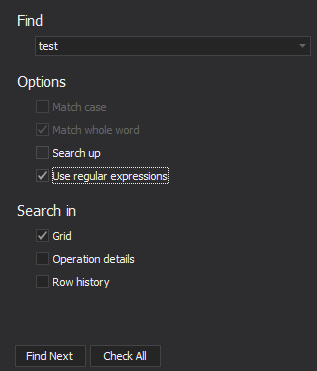
Find/replace feature is available both in the grid, as well as in the internal editor so locating specific operations or text is quite easy
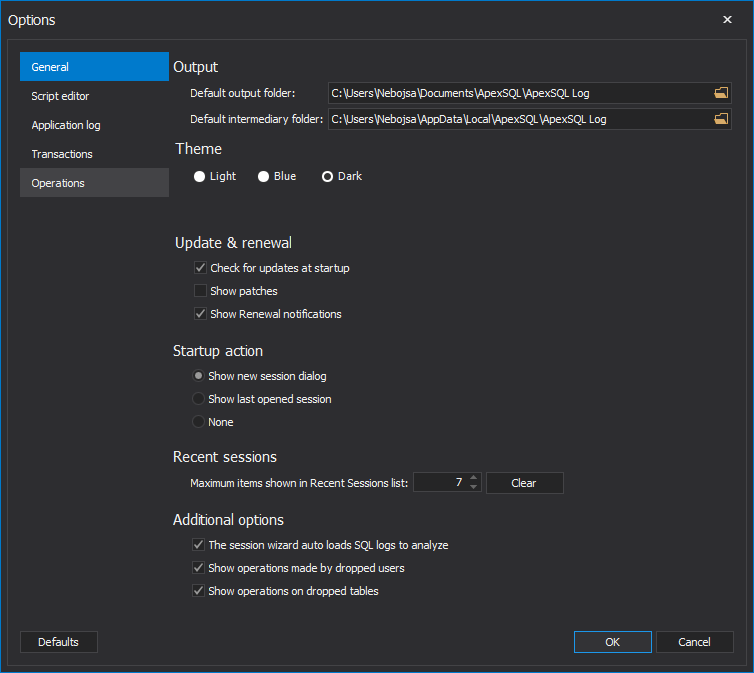
Clicking on the “Options” button in the main ribbon allows users access to the variety of options organized in different tabs.
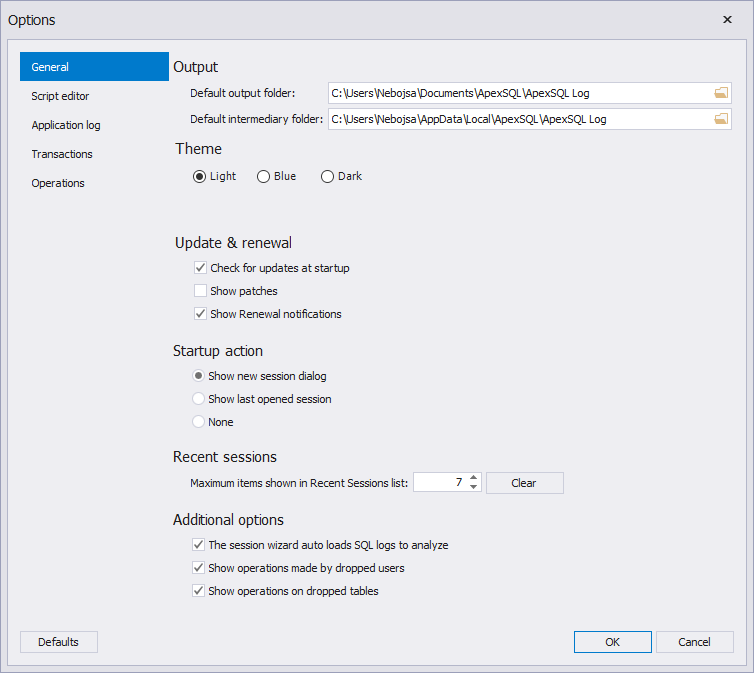
The “General” tab allows customization of general application options, including theme selection, output and temporary folder locations and more
For those that prefer brighter themes, Light theme is most likely choice
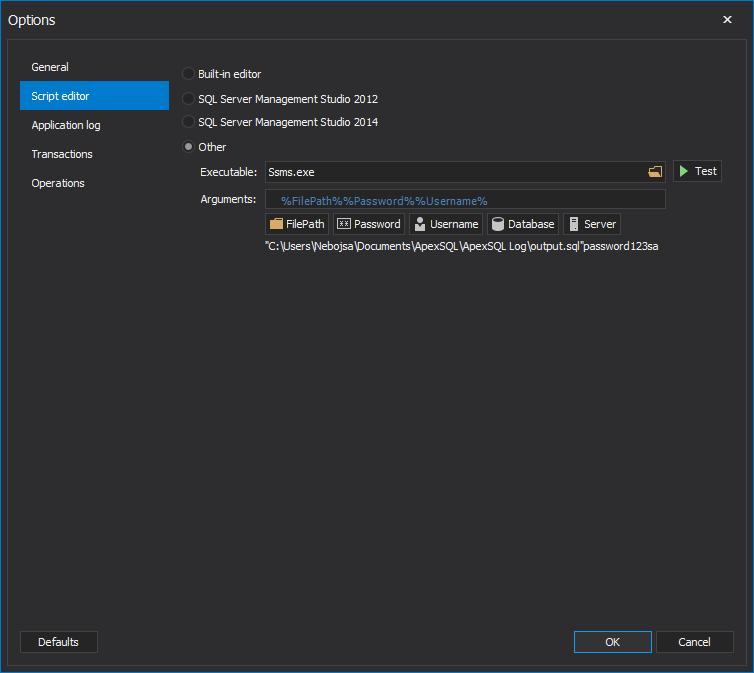
The “Script editor” tab allows users to choose default editor for all generated scripts
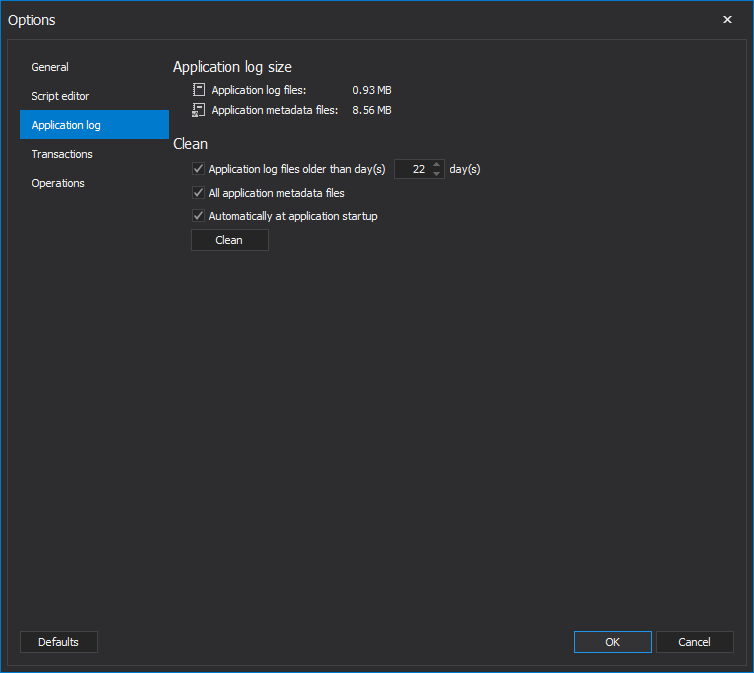
The “Application log” tab allows users insight into application log and metadata files information as well as ability to perform cleanup tasks
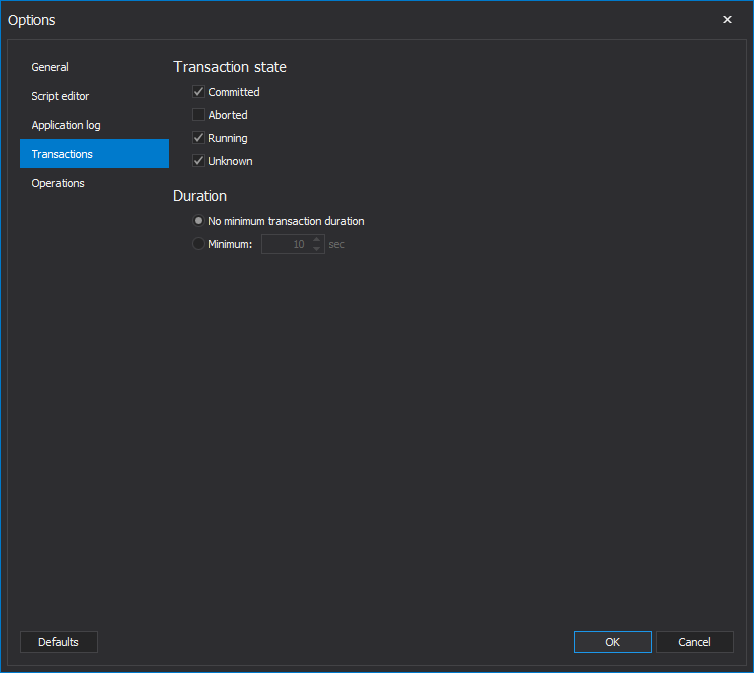
The “transactions” tab allows users to choose state and duration of transactions that will be considered when auditing
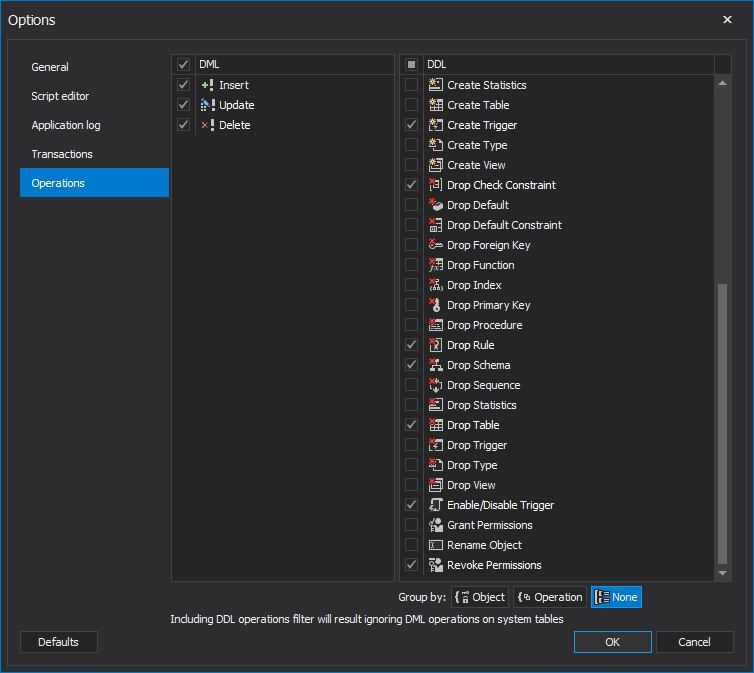
Finally, the “Operations” tab allows users to choose default operations which will be included in auditing tasks
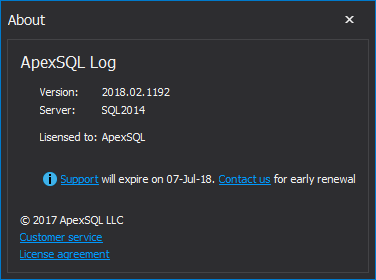
Clicking on the “About” form in the “Resources” tab will show the form which includes details on the application version and licensing information
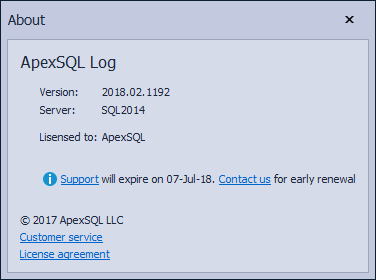
And one for those that like it in blue
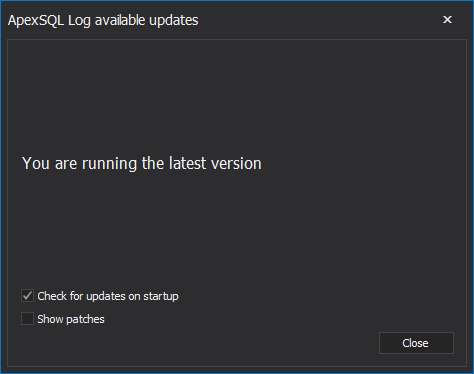
Clicking on the ‘Get updates” button in the same tab initiates a check for the latest available version of the tool
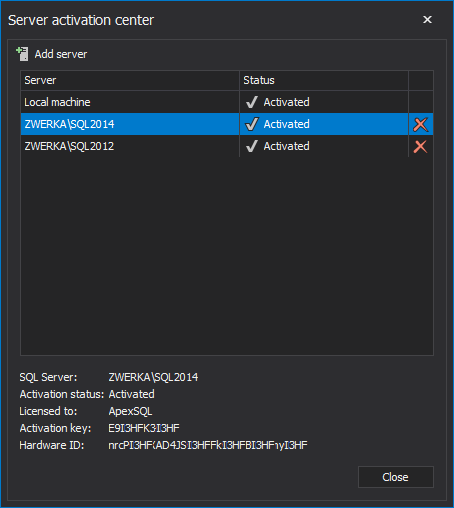
Clicking on the “Activate” button in the “Resources” tab brings forth the server activation center where users can see trial information and activate their SQL Server instances
November 28, 2017


