


Installing ApexSQL Recover is a simple 3-step task.
First, users choose between installing main application and server-side components
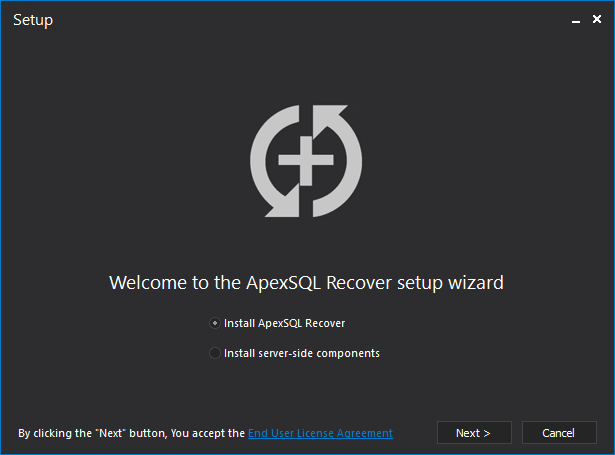
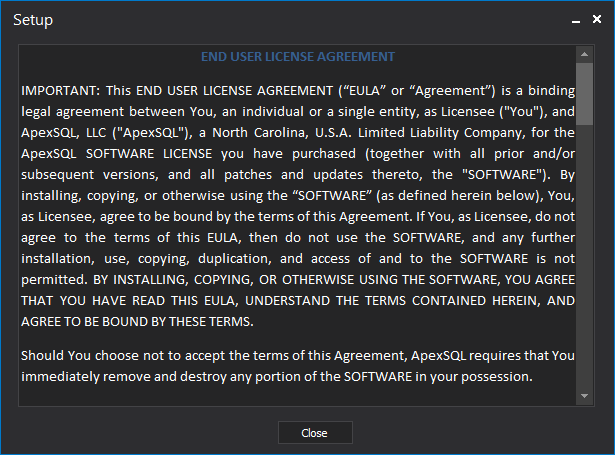
In the same step, user can check ApexSQL LLC EULA
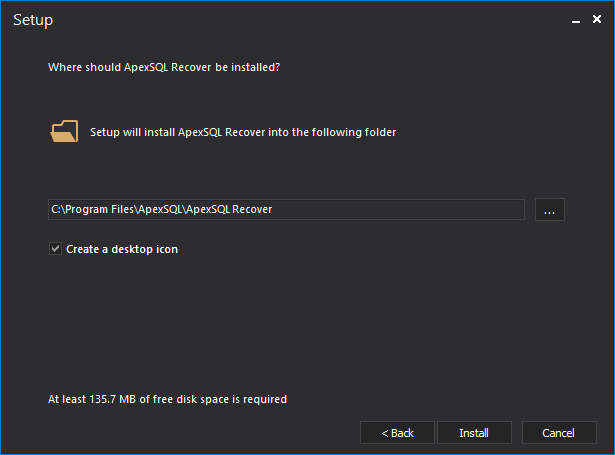
In the second step, folder and desktop icon choices are made
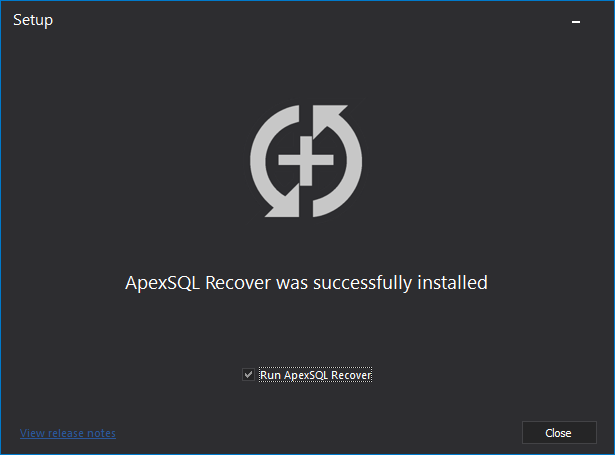
And once the installation is complete, users can view latest release notes and opt to immediately start the application once the installation wizard is closed
ApexSQL Recover main ribbon includes 3 tabs: Home, View and Resources
The “Home” tab includes all options for transaction log auditing, recovery and extraction tasks, as well as result manipulation and general tools, grouped into organizational categories
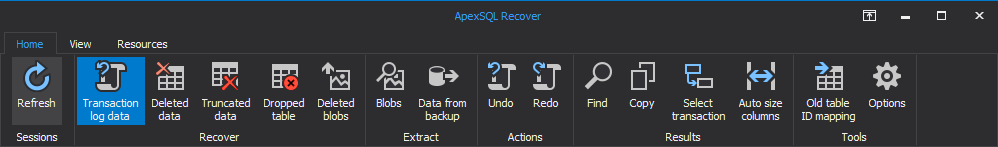
The “View” tab allows users to choose which panels will be shown or hidden

The “Resources” tab includes all support and licensing options which allow users to directly get in touch with ApexSQL support team and to apply/check their licensing

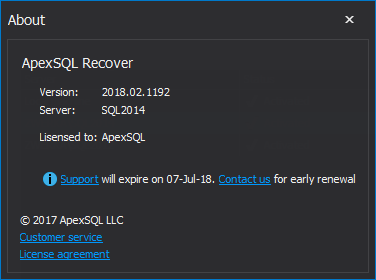
Clicking on the “About” button in the “Resources” tab will show the about form which provides information on the current application version, as well as licensing details
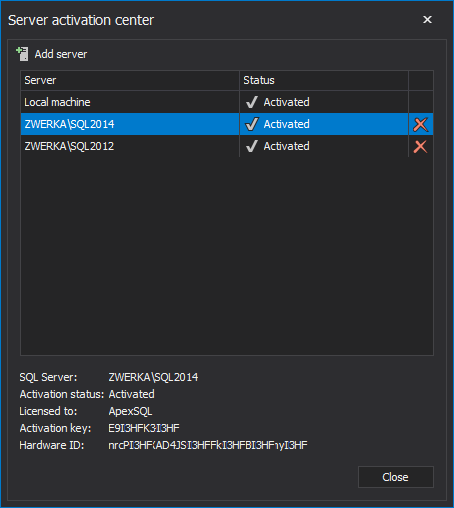
Clicking on the “Activate” button in the same tab launches “Server activation center” where users can add and license/activate local and remote SQL Server instances

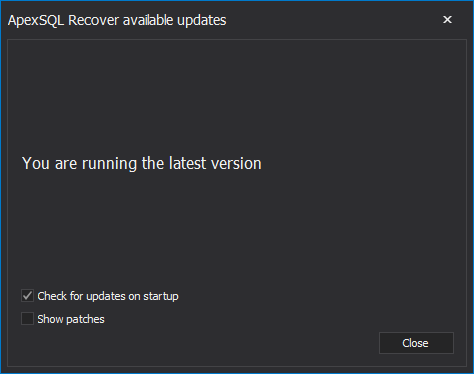
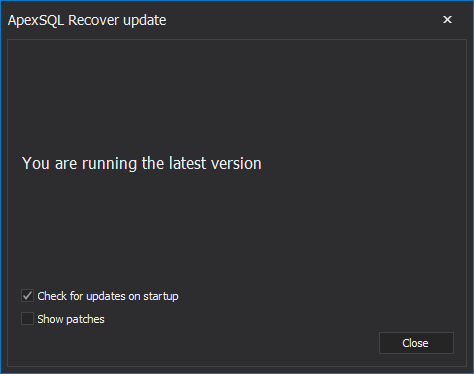
When users want to check if there is a newer version of ApexSQL Recover available, they only need to click on the “Get updates” button and wait for few minutes for the check to complete
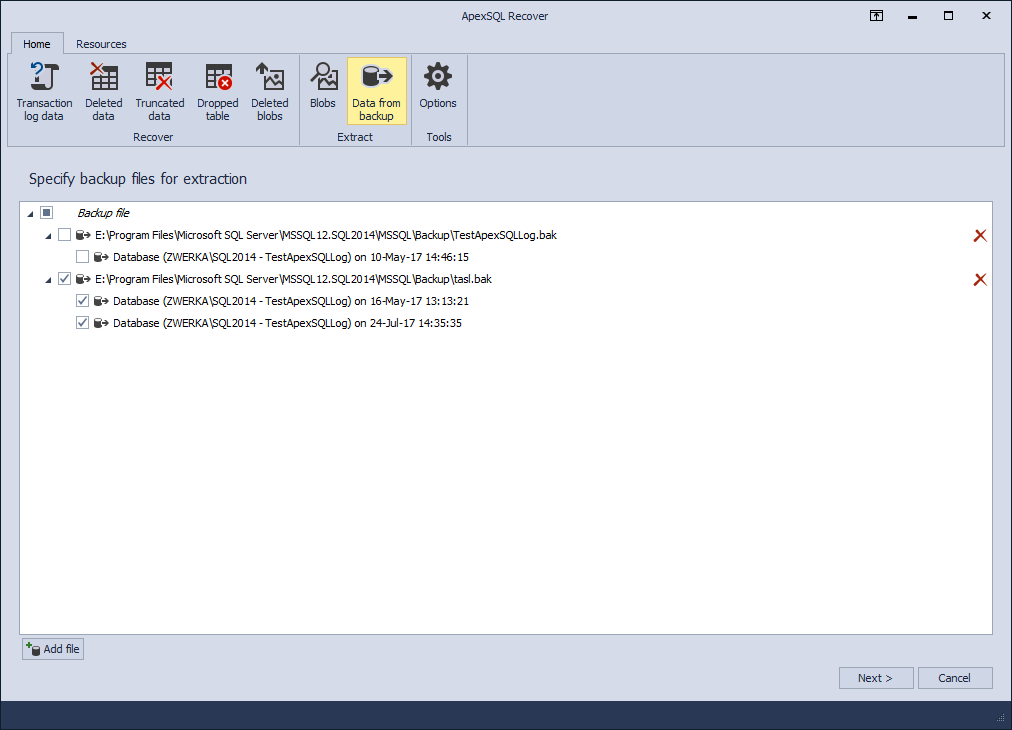
ApexSQL Recover allows users to perform 2 different extraction tasks. Extracting data from backup starts by selecting a specific backup

And in blue theme
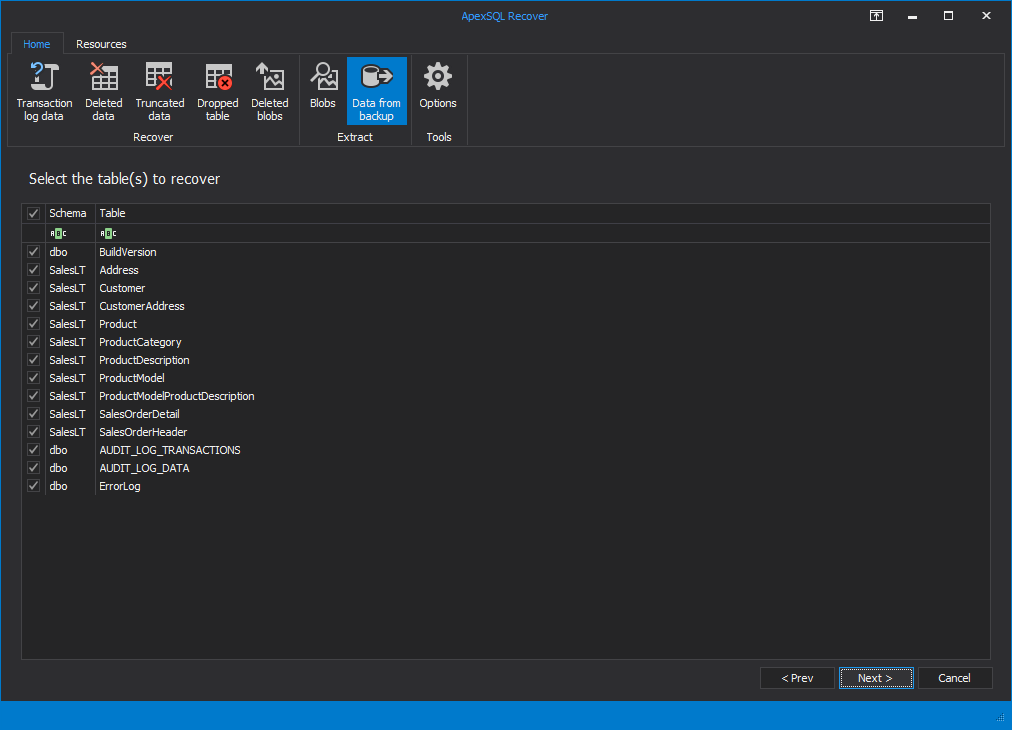
Data extraction task continues with the selection of tables that will be extracted
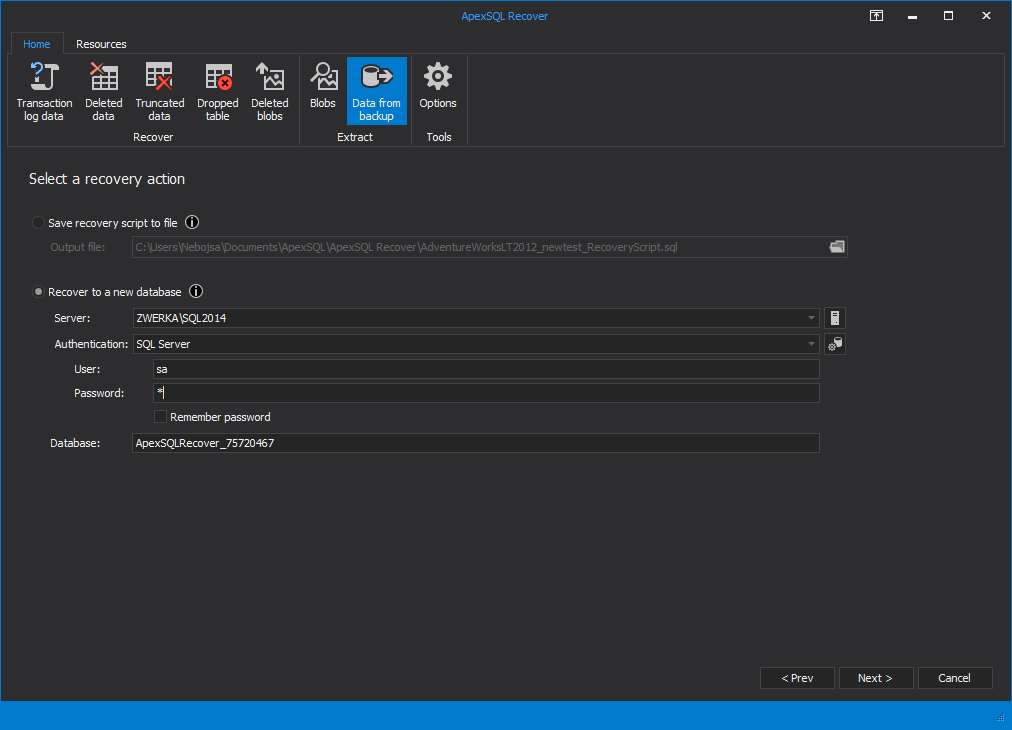
Next, users can opt between extracting to a .sql script or directly to a new database
Finally, a choice between extracting both structure and data or only table structure will finalize the wizard

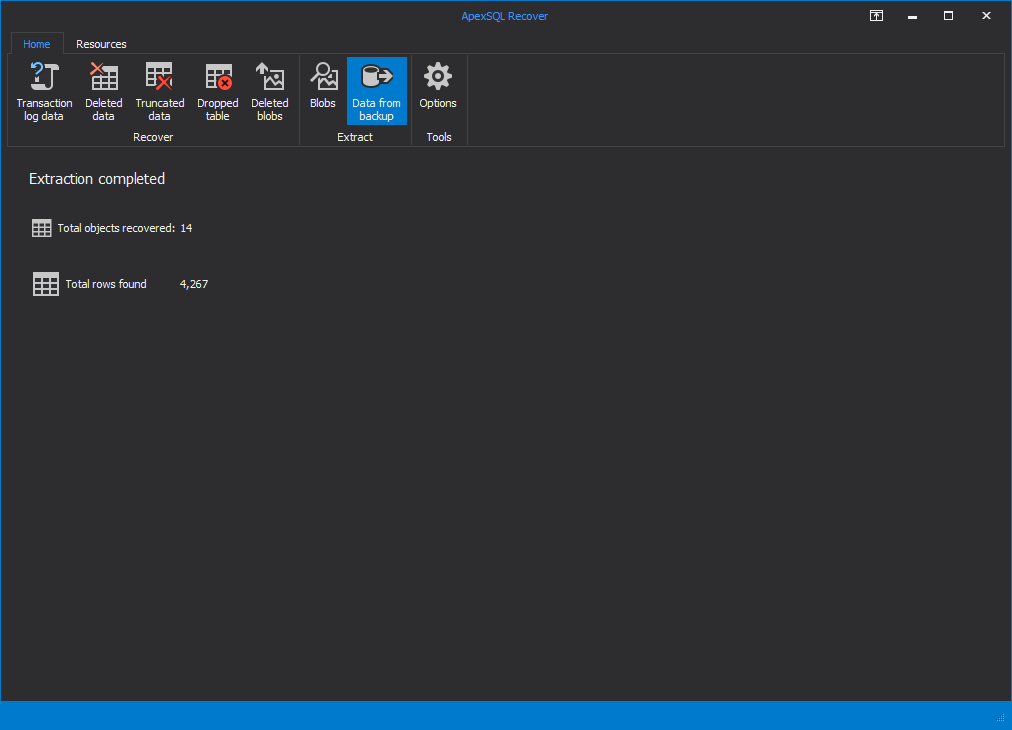
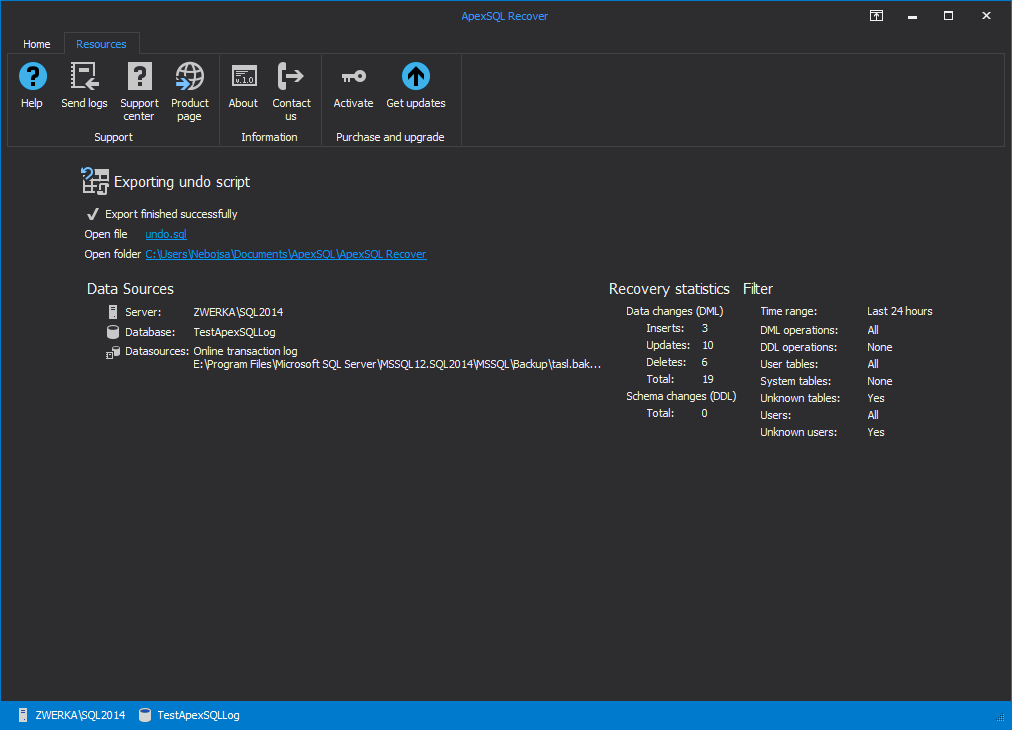
Once the extraction is completed, summary will show number of recovered object and rows
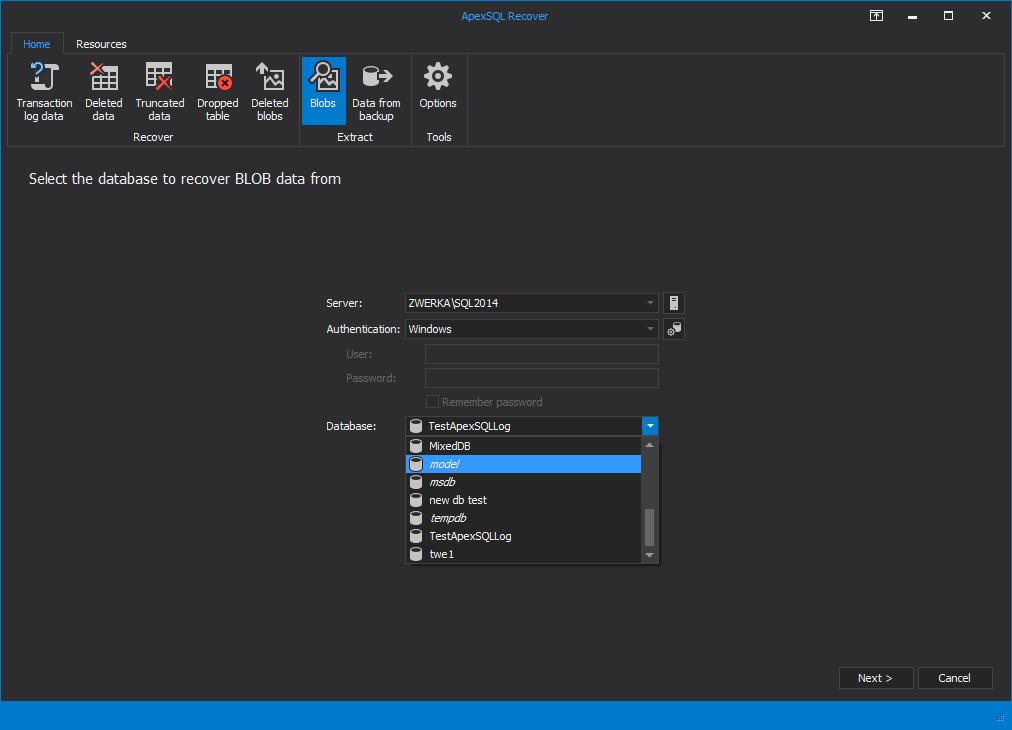
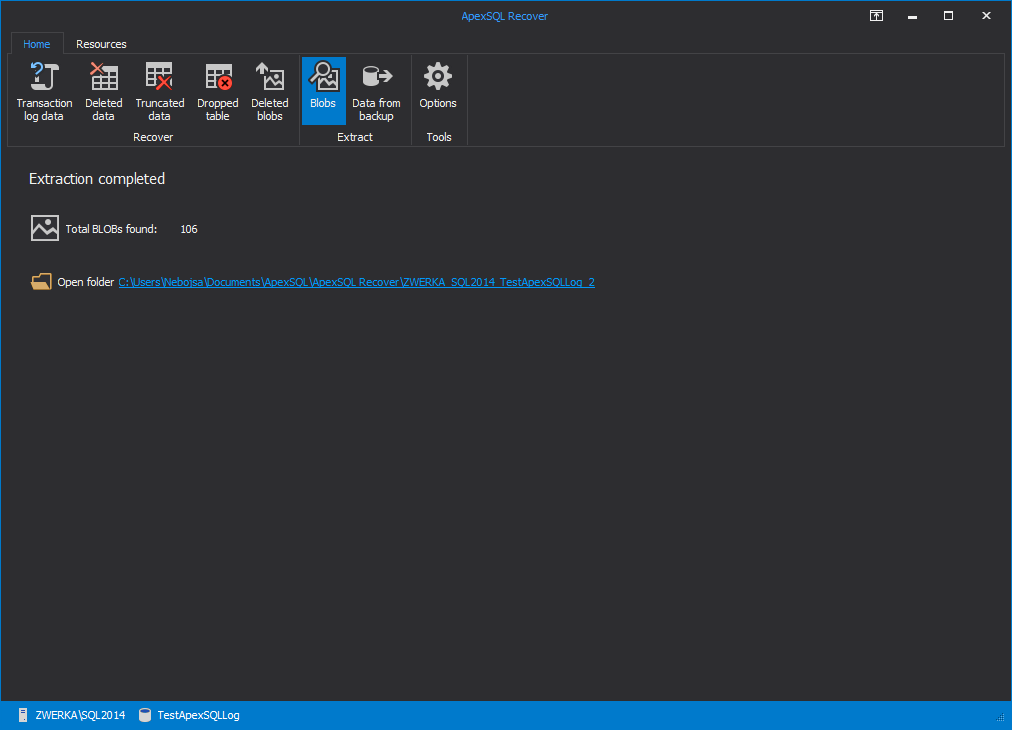
Next in line is the blob extraction job which begins by selecting a database from which the blobs will be extracted. Users will need to provide connection credentials
The only remaining tasks is to select a folder where blobs will be extracted

Once the processing completes, quick summary information is shown
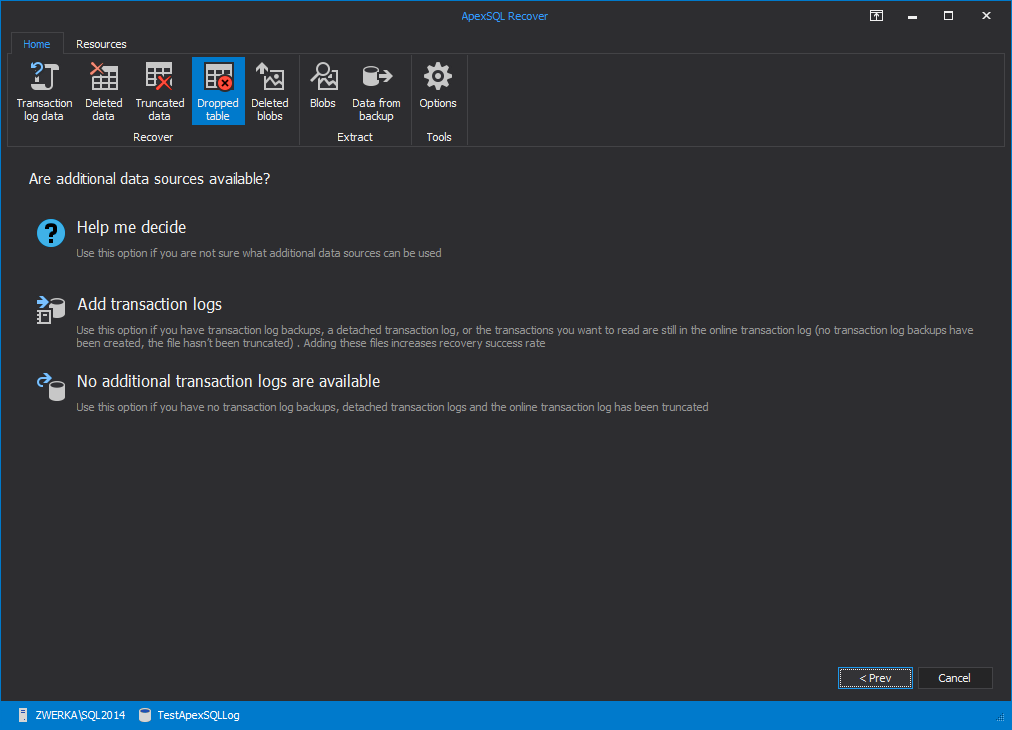
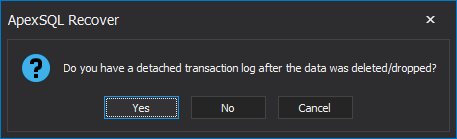
When initiating a recovery from DROP TABLE operation, first task is to provide available recovery sources. Users can opt to add transaction log files, to skip adding any, or to receive some help from the app to help them decide on the best course of action
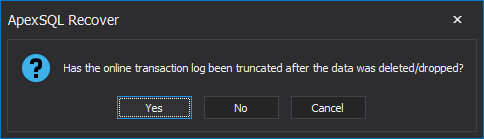
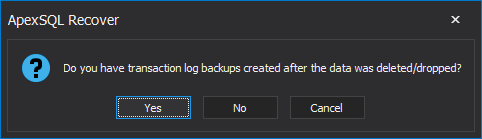
If users opt to receive help, a quick series of questions is prompted and a recommendation is shown based on the answers
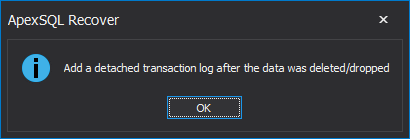
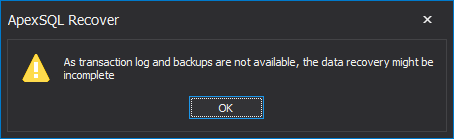
And for the recommendations:
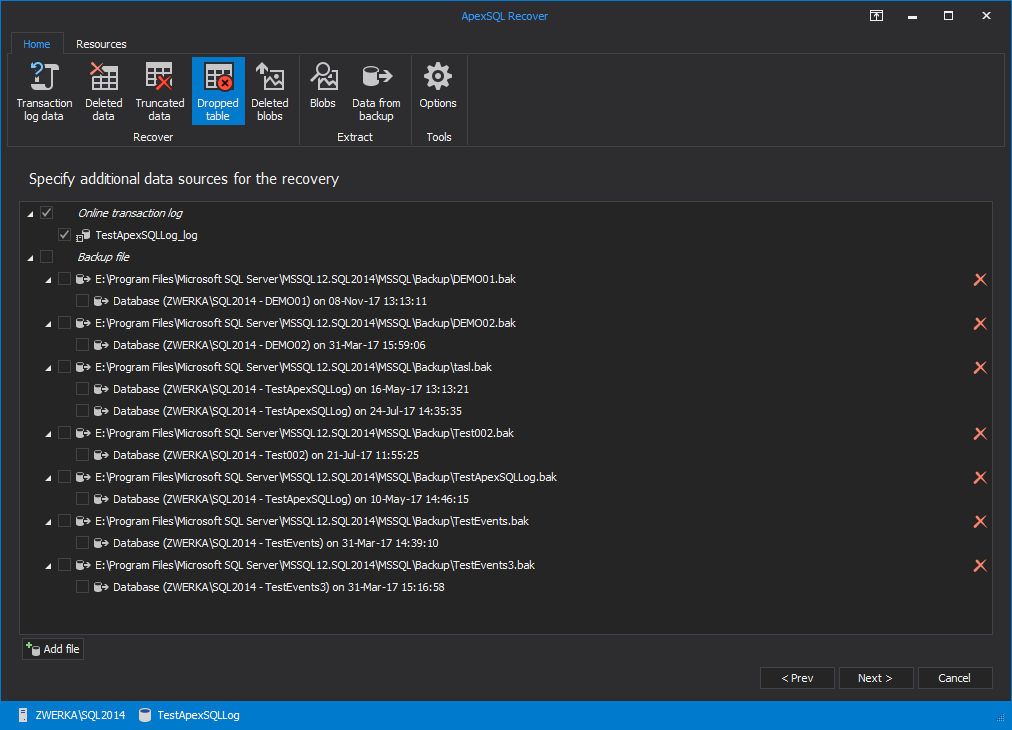
In the “Specify additional data sources” step of the recovery wizard, users can add transaction log files and backups which will be used during the recovery process
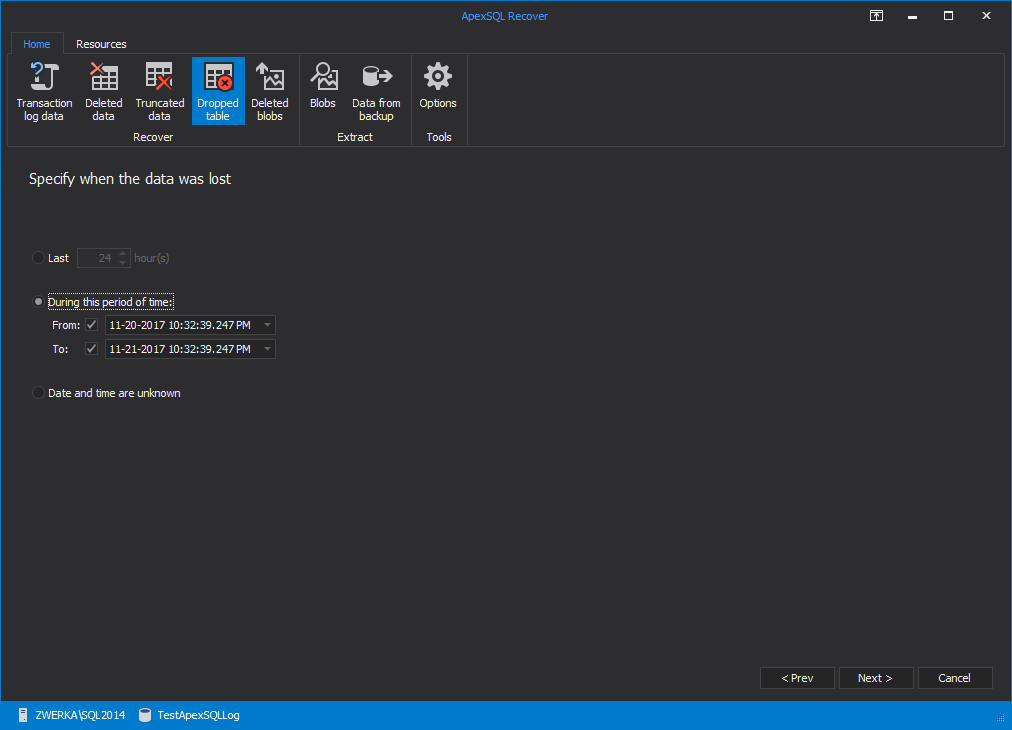
Next, users can define time period that will be considered for the recovery process
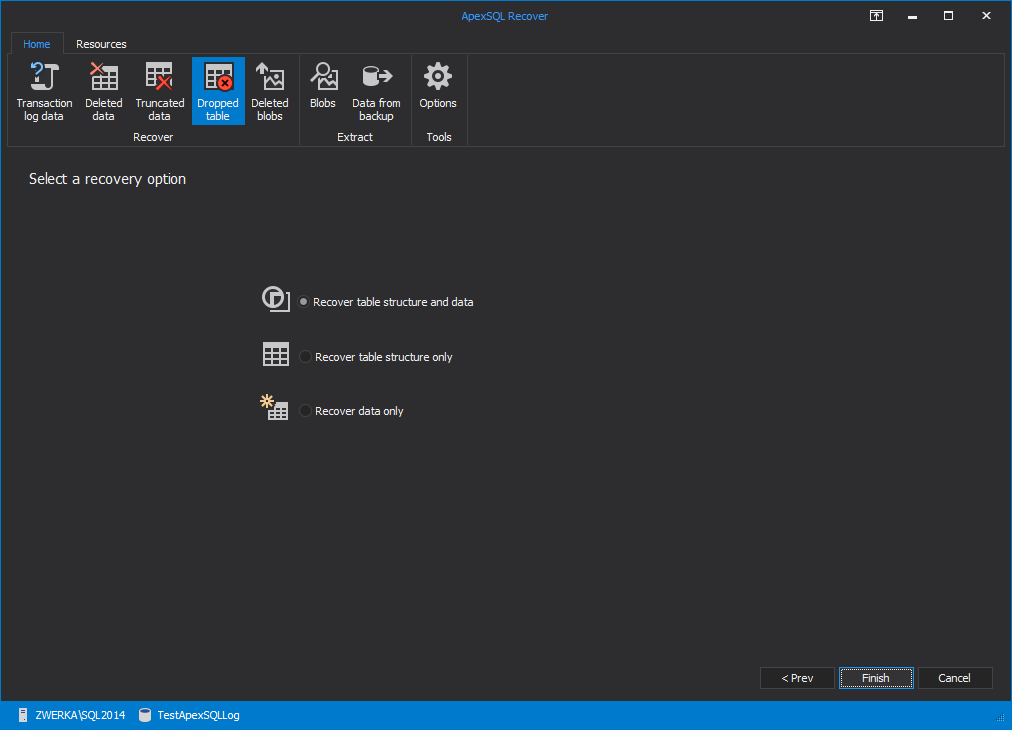
As before, in the next step of the recovery wizard, users choose between a script and a recovery directly to the database

As well as what to recover
When transaction log auditing is initiated, in the first step of the wizard, users need to specify SQL Server and database as well as to provide connection details

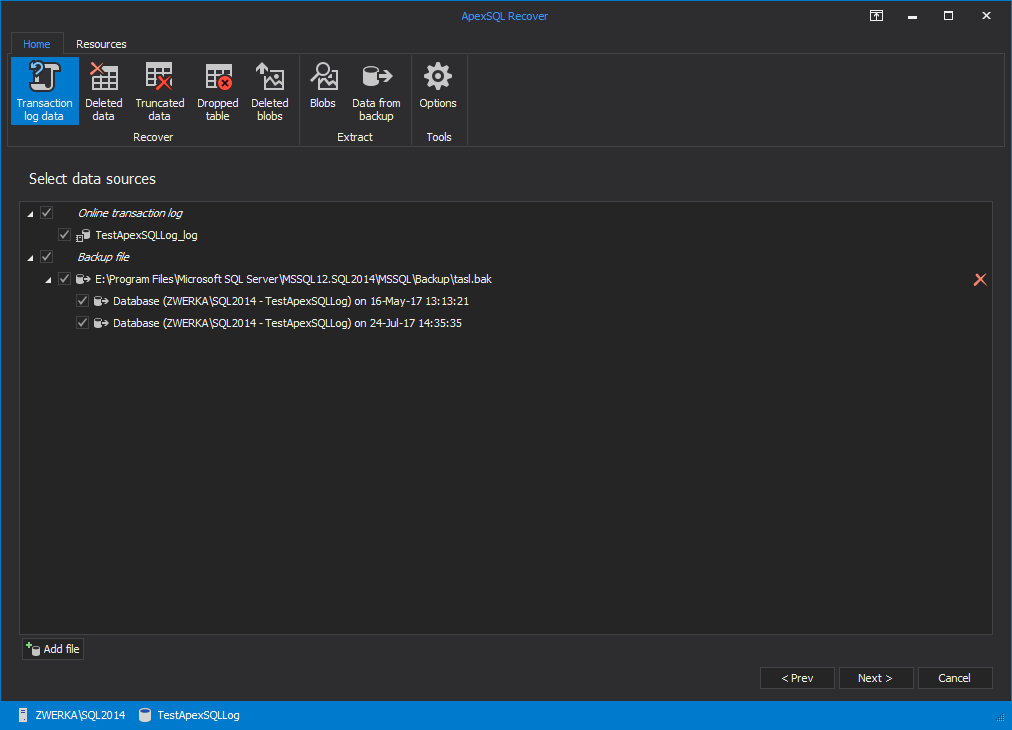
In the next step of the wizard, transaction log files and backups can be added for auditing
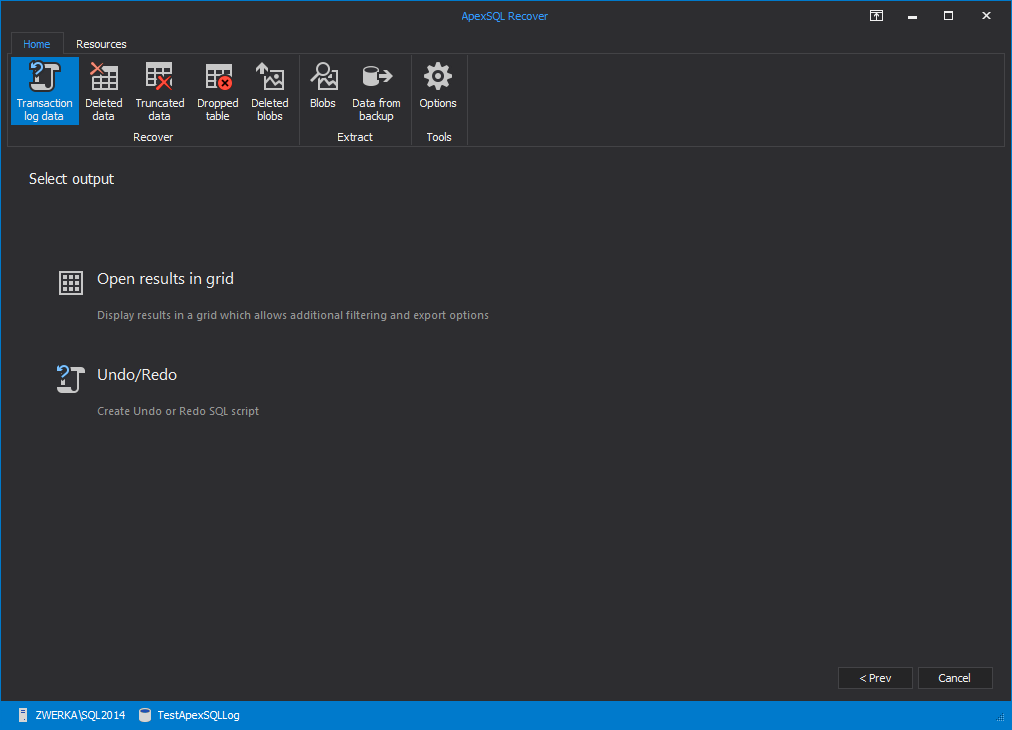
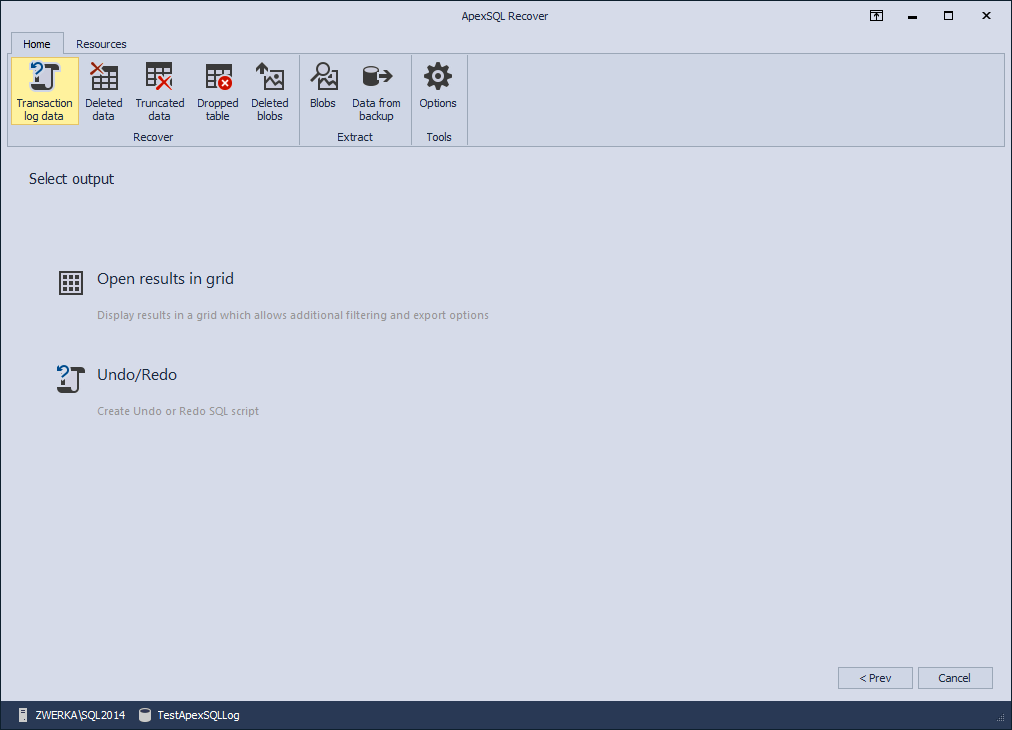
Auditing transaction log files has two possible outputs. Users can opt to create undo/redo scripts directly, or choose to audit results to grid and explore them first before they opt for recovery
Also in blue…
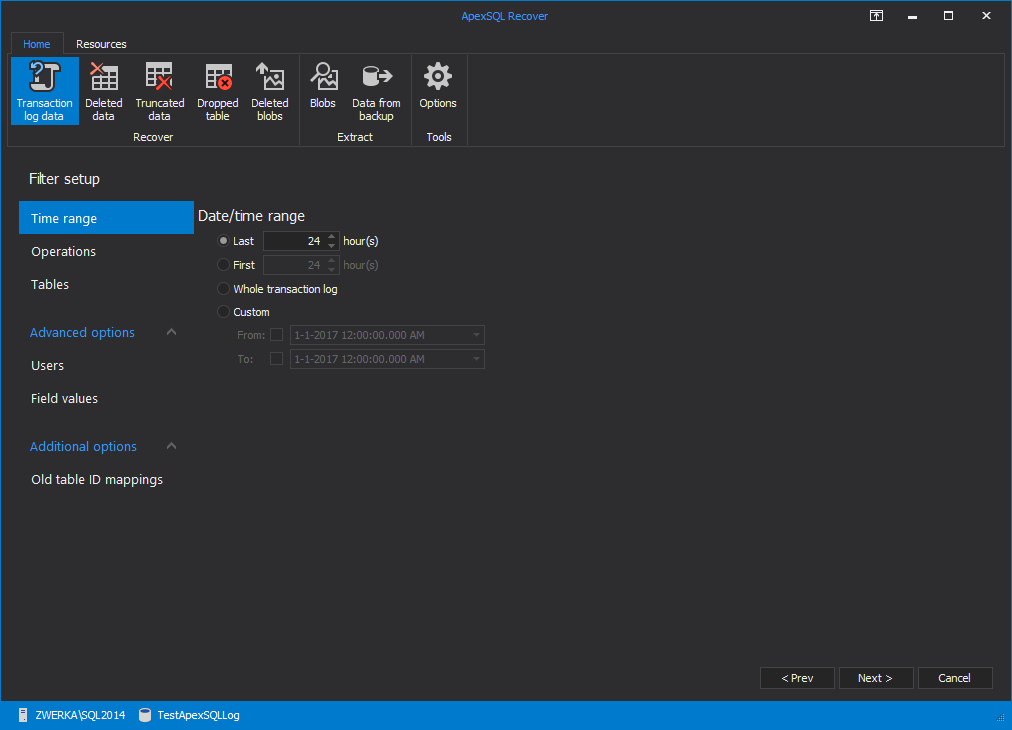
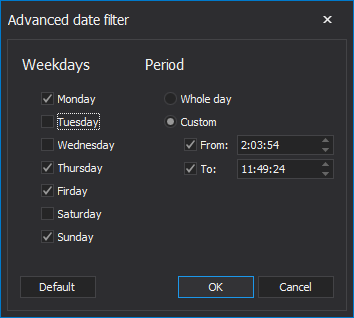
In the next step of the transaction log auditing wizard, users can use variety of different filters to fine-tune the auditing results with time/date filters being a great starting point
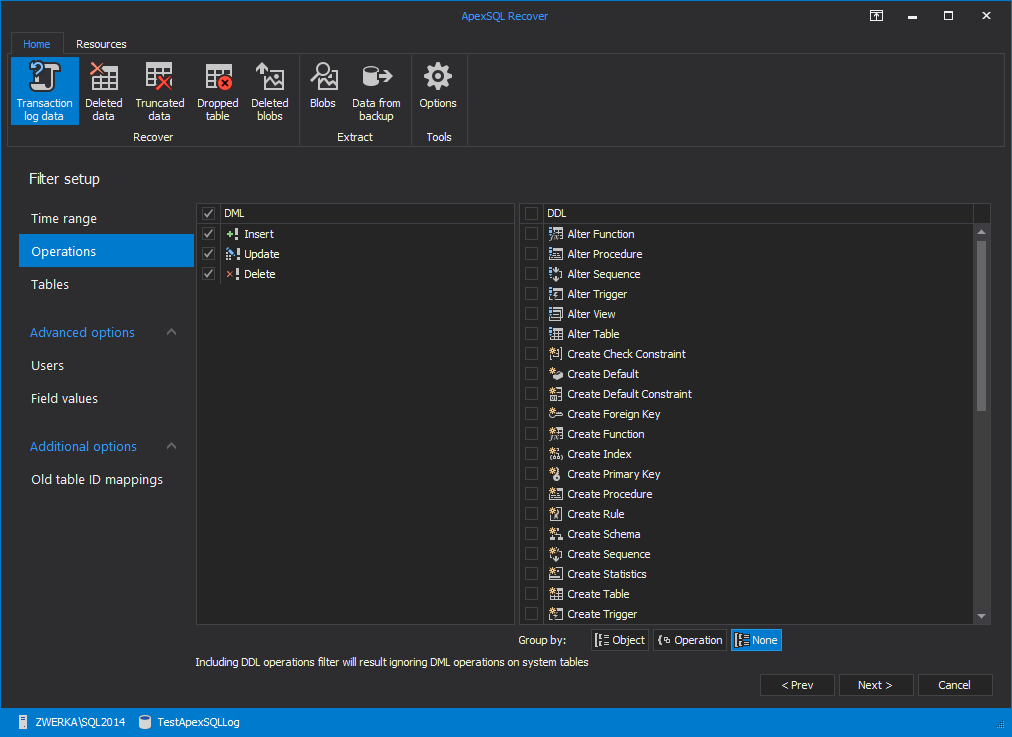
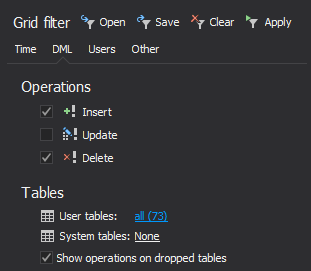
In the “Operations” tab users can choose to filter DML and DDL operations for the auditing task
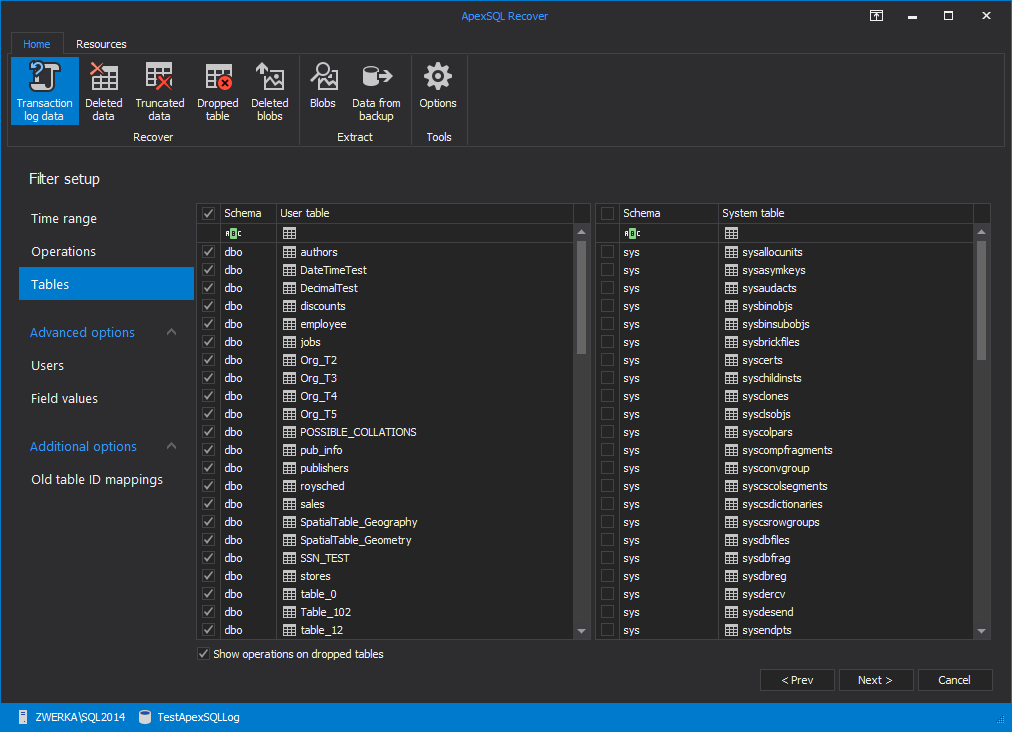
Similar, in the “Tables” tab of the filter setup, users can choose which tables will be included in the process
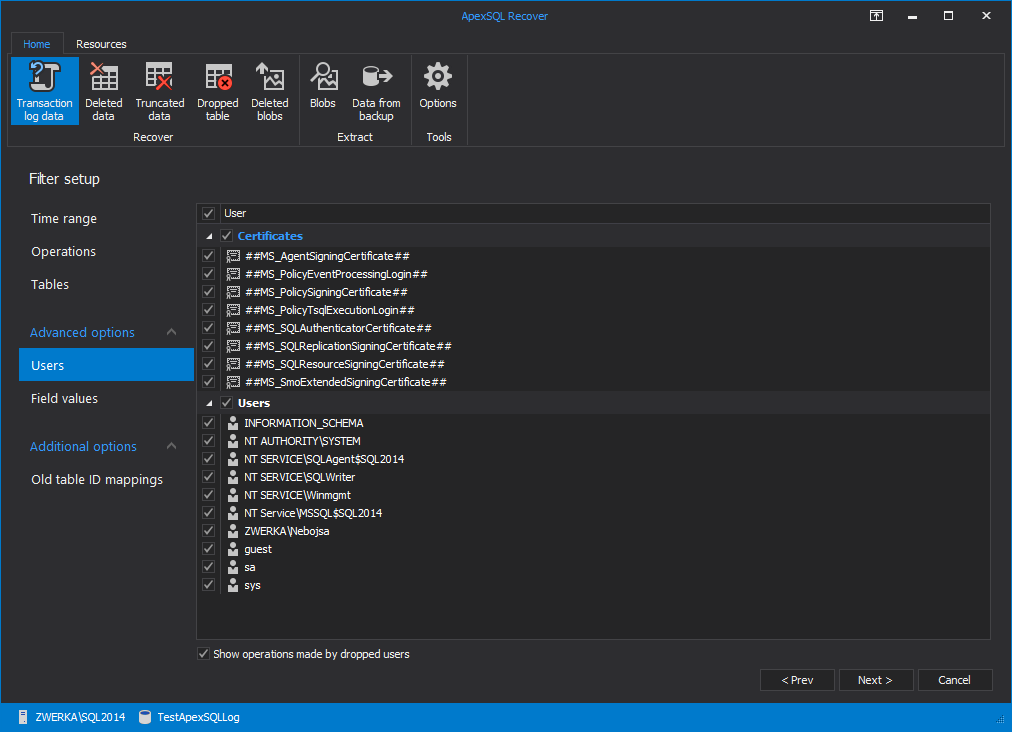
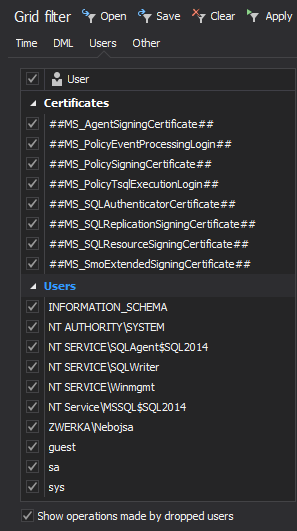
In the “Users” tab, specific certificates and users can be filtered for the recovery job
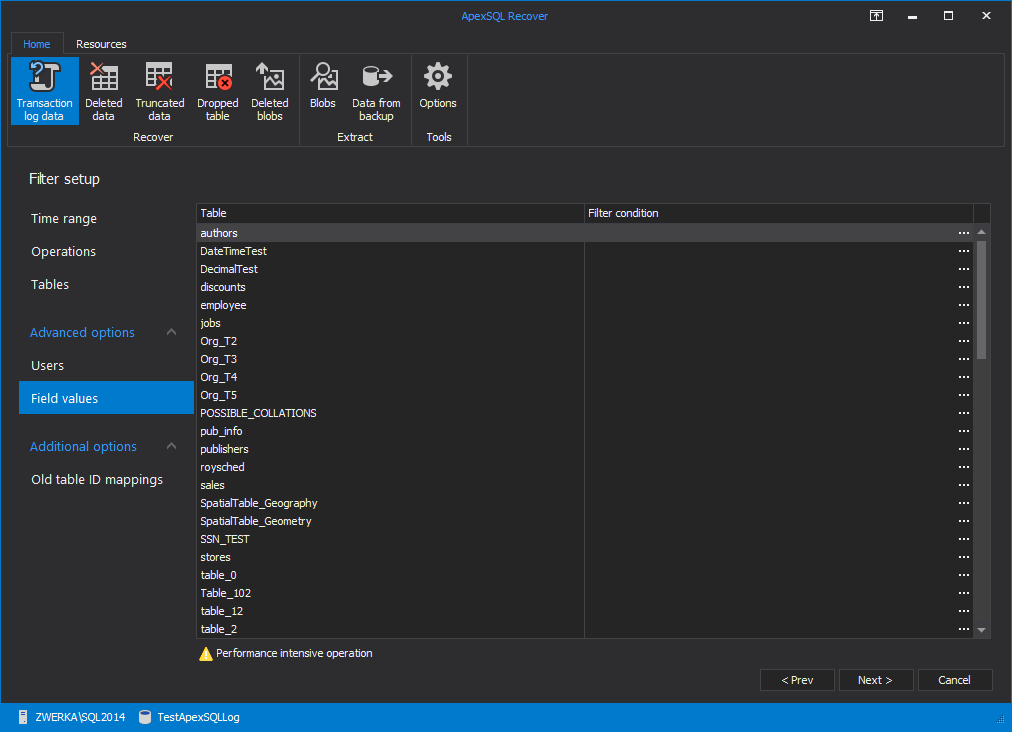
Users can also impose specific field values filter in the “Field values” tab
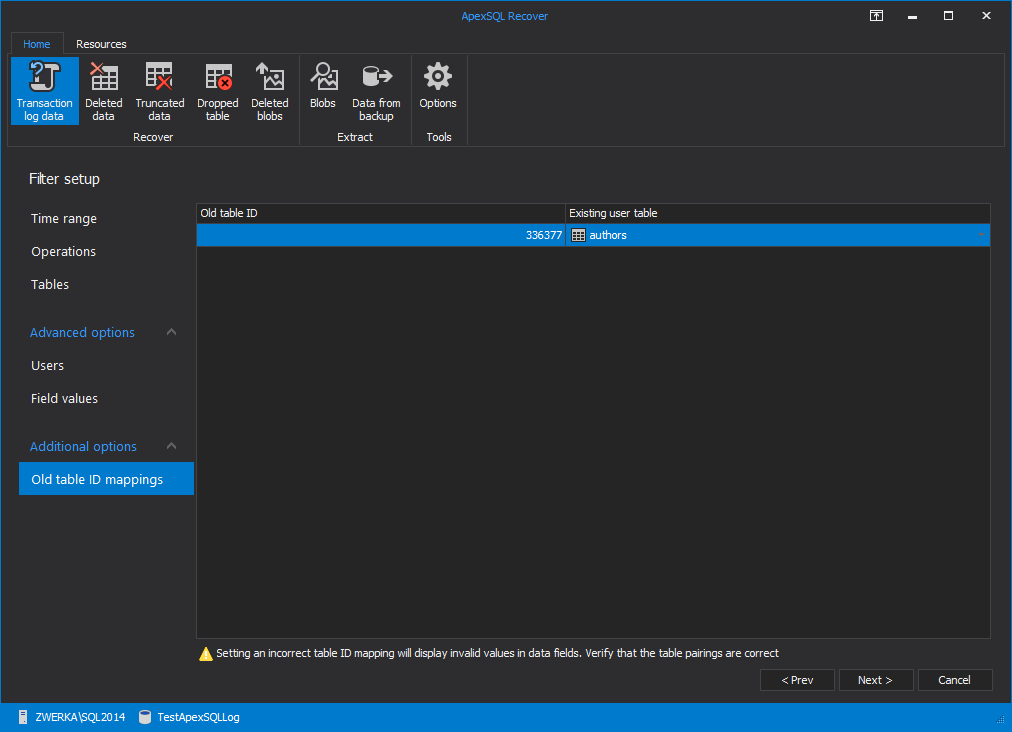
And also map dropped tables to their newly-created replacements for re-created tables
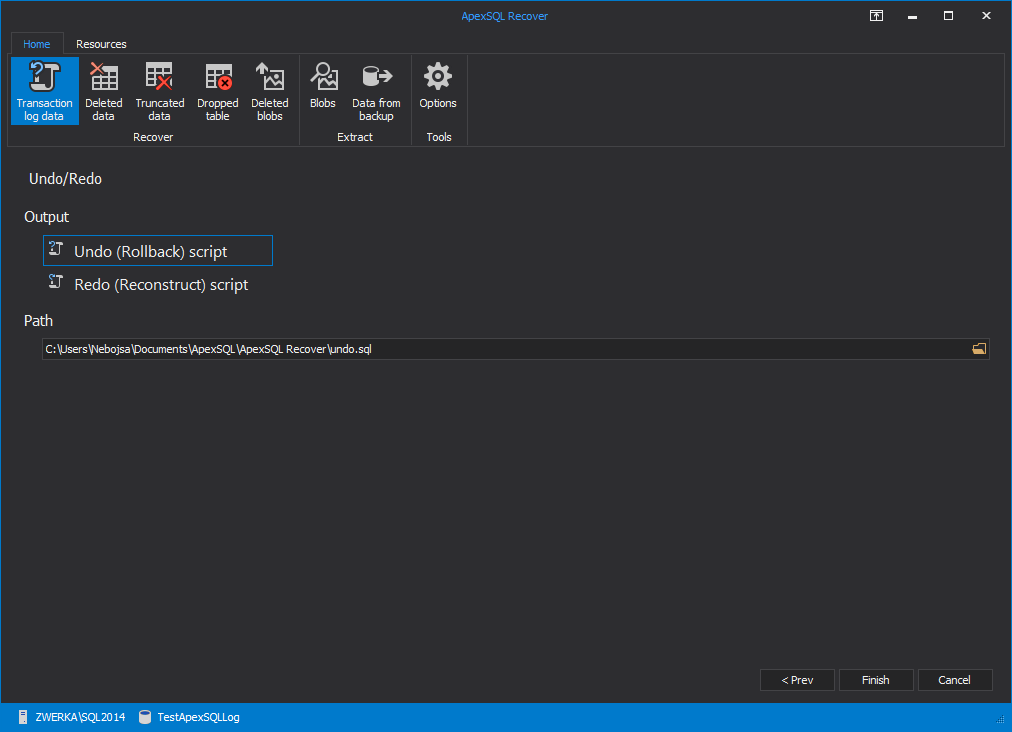
If users opts to create undo or redo script without auditing data inside the grid they simply need to choose the output path and click on the “Finish” button
After short processing, undo/redo summary is shown where users can see the results and access created recovery script
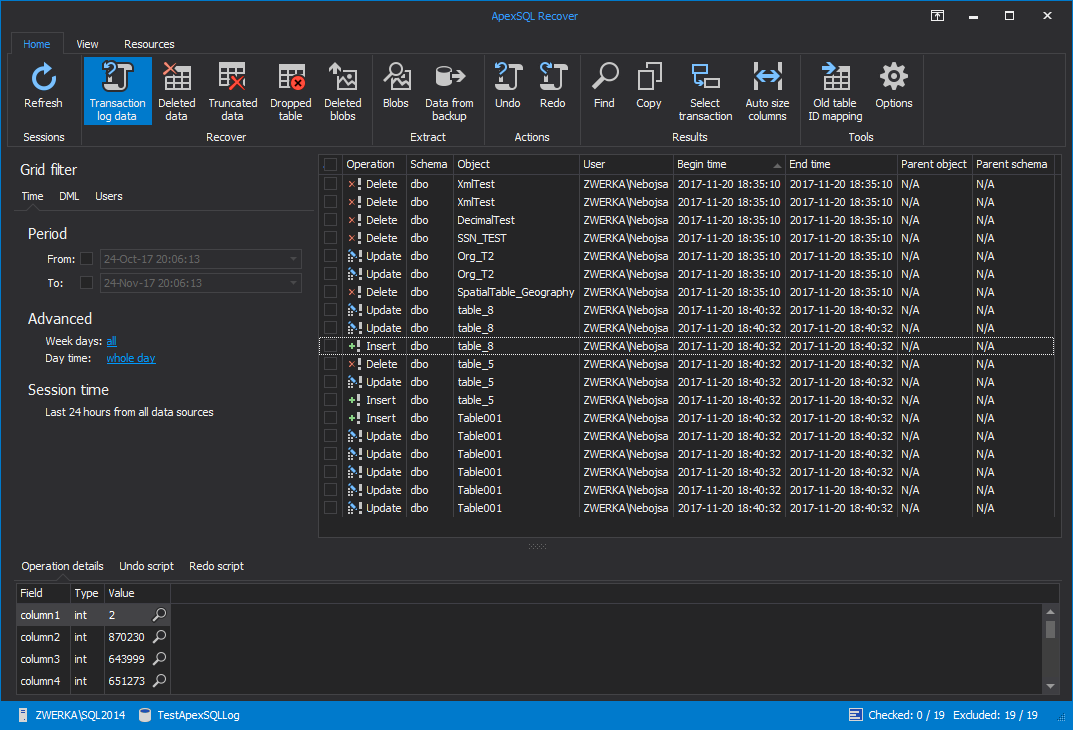
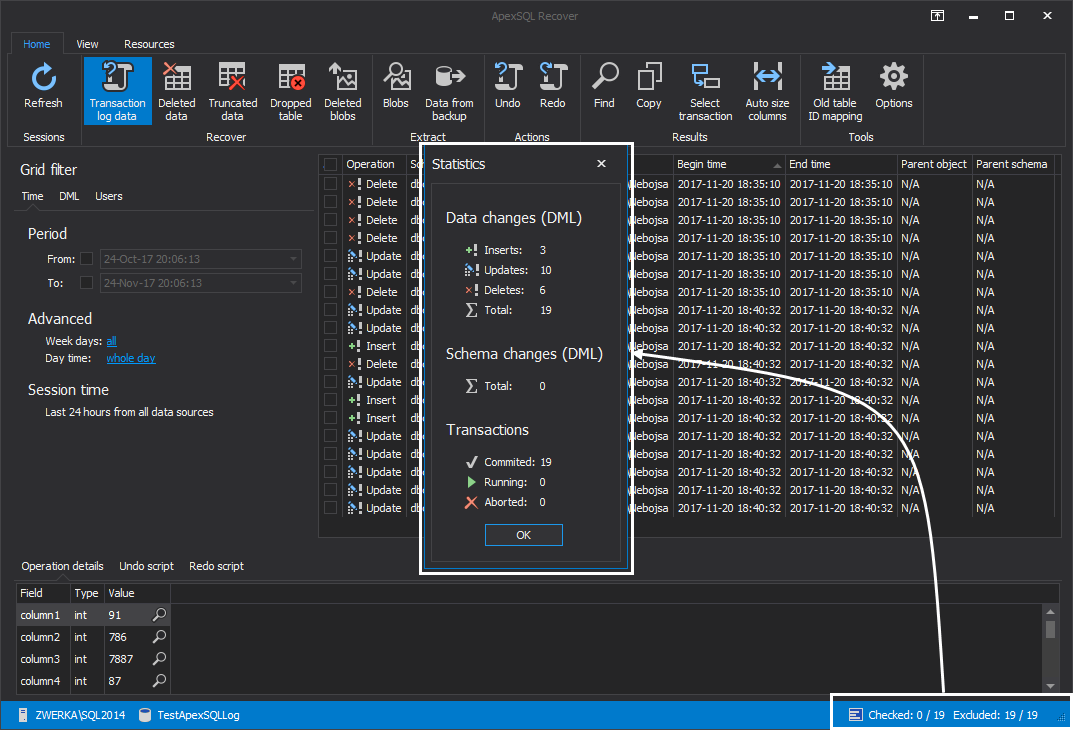
If user opt to open results in grid instead of directly creating undo/redo scripts, after short processing, ApexSQL Recover will display auditing results in a comprehensive grid where they can be explored before advancing through with the actual recovery
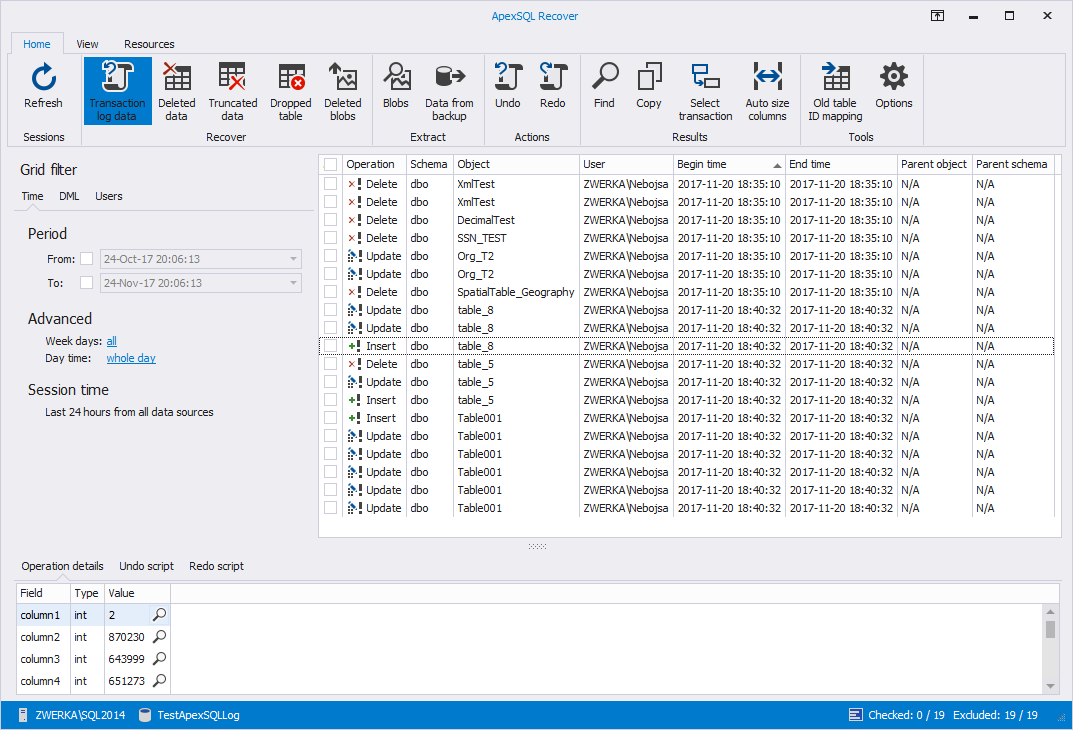
Light-themed grid may be more appealing to some
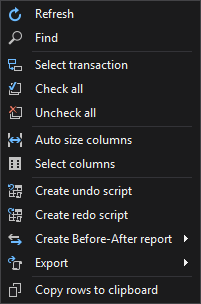
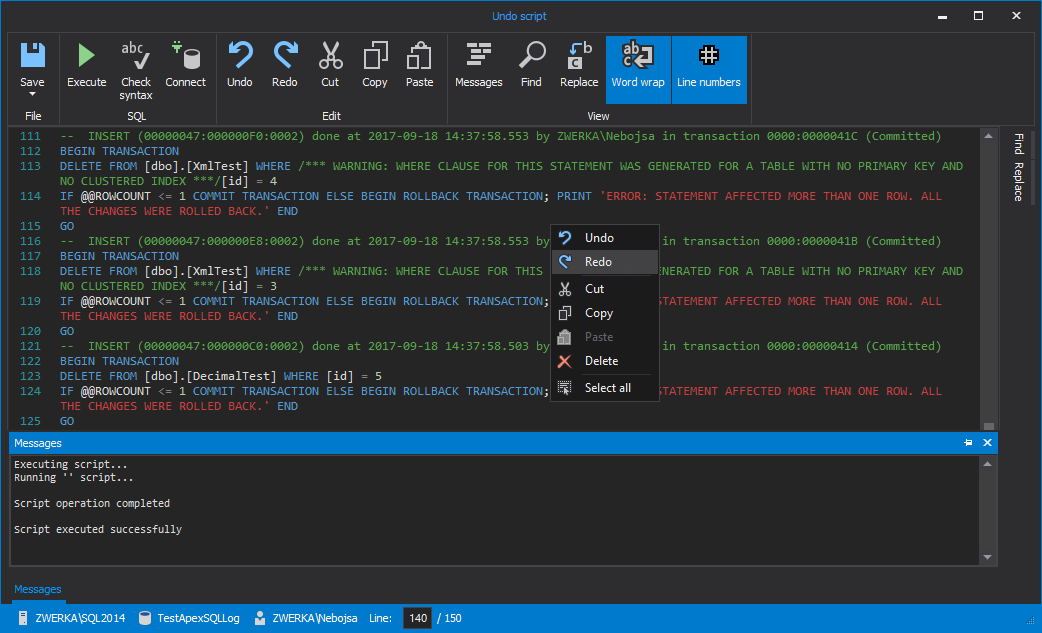
Aside from using different options from the main ribbon, user can find all available options in the convenient context menu
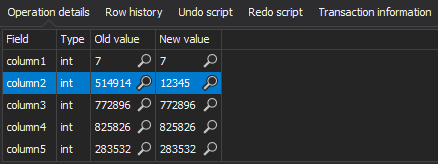
In the grid, users can look in the bottom panes for more details on audited operations. The “Operation details” pane offers plenty of operation on objects or fields affected by the grid operations
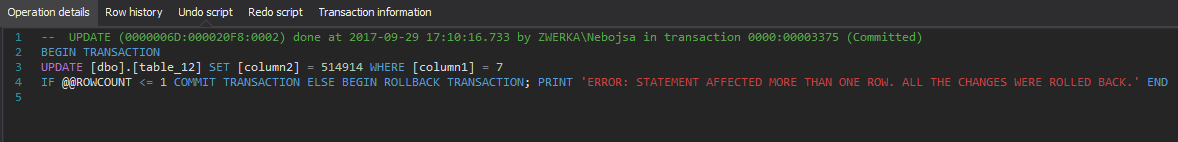
The “Undo script” shows full rollback script for the selected operation
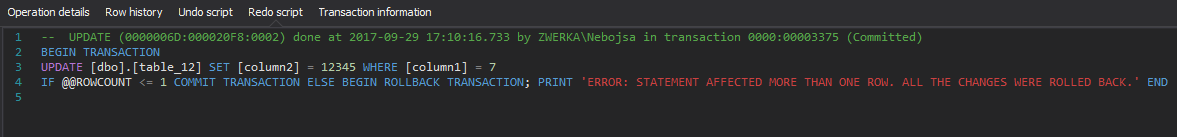
While “Redo script” pane shows a replay script
Auditing results to grid not only allows users to investigate operations within their transaction log files and backups, but also gives an opportunity to further filter out the results for precise recovery tasks. Grid offers operation and table filters
Time and date filters
User and certificates filters
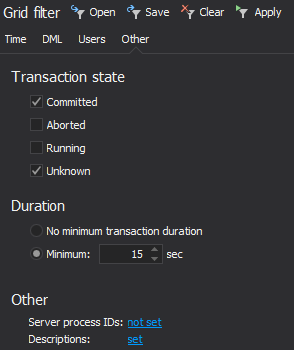
As well as several other filters, also available during the auditing wizard
Users can also check auditing stats by clicking on the stats in the bottom-right
Auditing results to grid allows users to pick specific operations and generate rollback or replay scripts only for selected few operations. Once generated, undo/redo script can be opened inside internal editor where it can be edited and finally executed
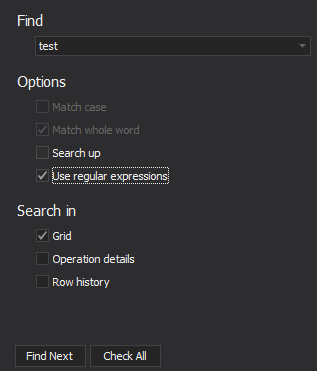
Find/replace feature is available both in the internal editor and inside the grid, and will allow users to quickly find specific entries
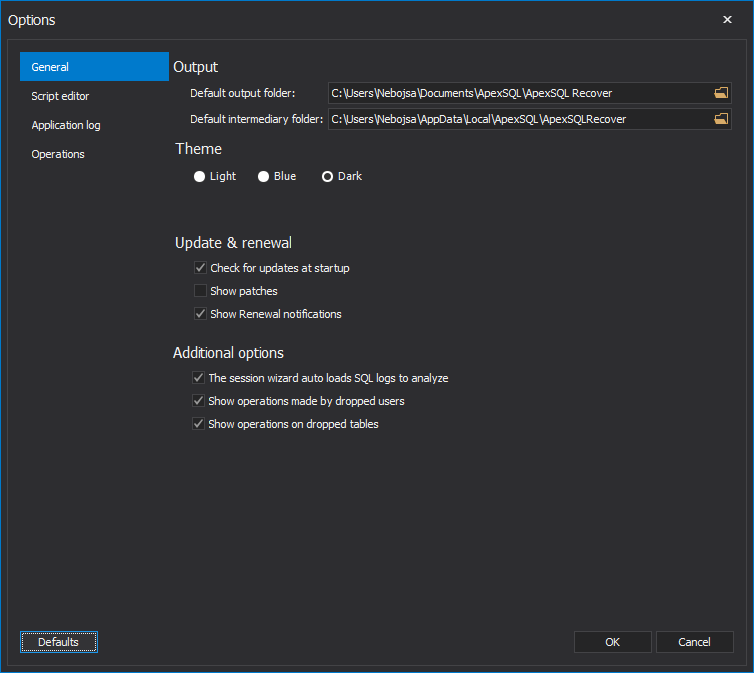
The Option form is accessed via the main Ribbon by clicking on the “Options” button. In the “General” tab, users can choose general options including output location, theme and more
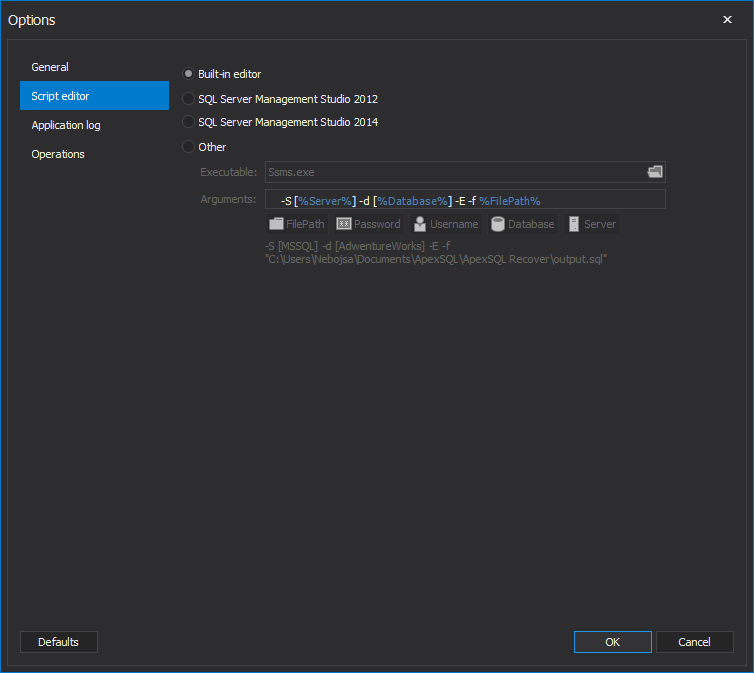
In the “Script Editor” tab, a default editor for all generated scripts is selected
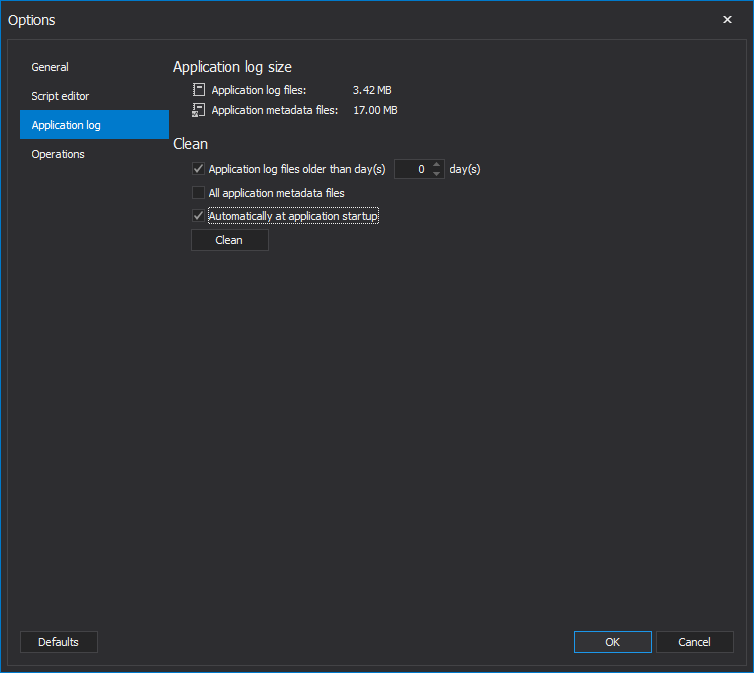
In the “Application log” tab, users can perform application log and metadata files cleanup tasks
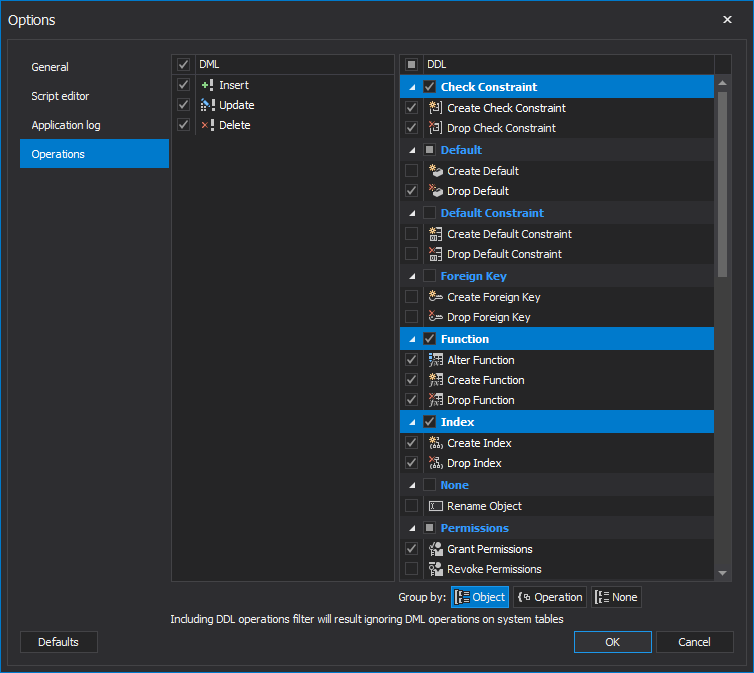
Finally, in the “Operations” tab users can choose default DML and DDL operations which will be included in the transaction log auditing tasks
Clicking on the ‘Get updates” button in the same tab initiates a check for the latest available version of the tool
Clicking on the “Activate” button in the “Resources” tab brings forth the server activation center where users can see trial information and activate their SQL Server instances
Clicking on the “About” form in the “Resources” tab will show the form which includes details on the application version and licensing information
And one for those that like it in blue
November 28, 2017


