


ApexSQL Defrag is database administrator tool used for SQL Server index management. It represents all around solution for SQL Server index monitoring, analysis and maintenance.
Detailed index fragmentation analysis
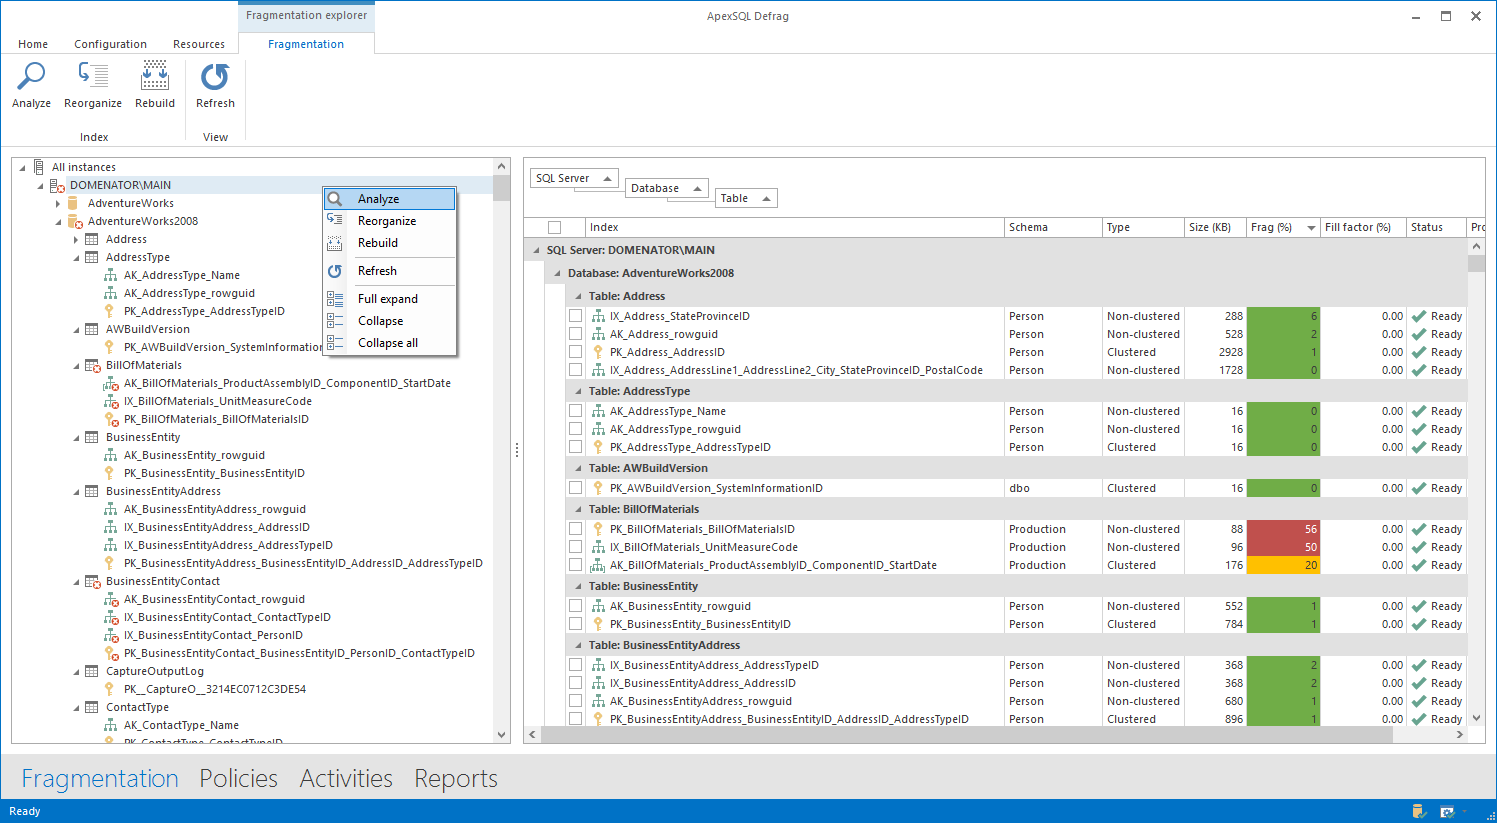
ApexSQL Defrag can be used to run detailed index fragmentation analysis. The application allows the user to perform the analysis on the server, database, table, or single index level with a single click. To run the analysis, right click on an object (server, database, table or index) in the server explorer, and select Analyze. The application provides detailed results for each analyzed index. It shows the server, database, schema and table for the selected index, as well as the index type, index size, fragmentation percentage and fill factor.
Indexes with high and medium fragmentation can be easily detected after the analysis in two simple ways:
-
By the icons in the server tree – Each object with medium (10% – 30%) or high (>30%) fragmentation gets the suitable warning overlay
-
By the color in the Frag (%) column – The results in the Frag (%) column are sorted descending, so that the indices with highest fragmentation get listed first. Additionally, each of the fragmentation level uses its own color. By the default, red is assigned to all highly fragmented indexes with fragmentation percentage of 30% and higher. Yellow and green are for indexes with medium and low fragmentation. These are all default settings, and can be easily customized in Options if needed.
All results are displayed in highly customizable grid. The results can be sorted or grouped by any column. Just drag and drop the column heading to Group by box to group the results by that column. Sort the results by the column values ascending or descending by clicking on the column heading.
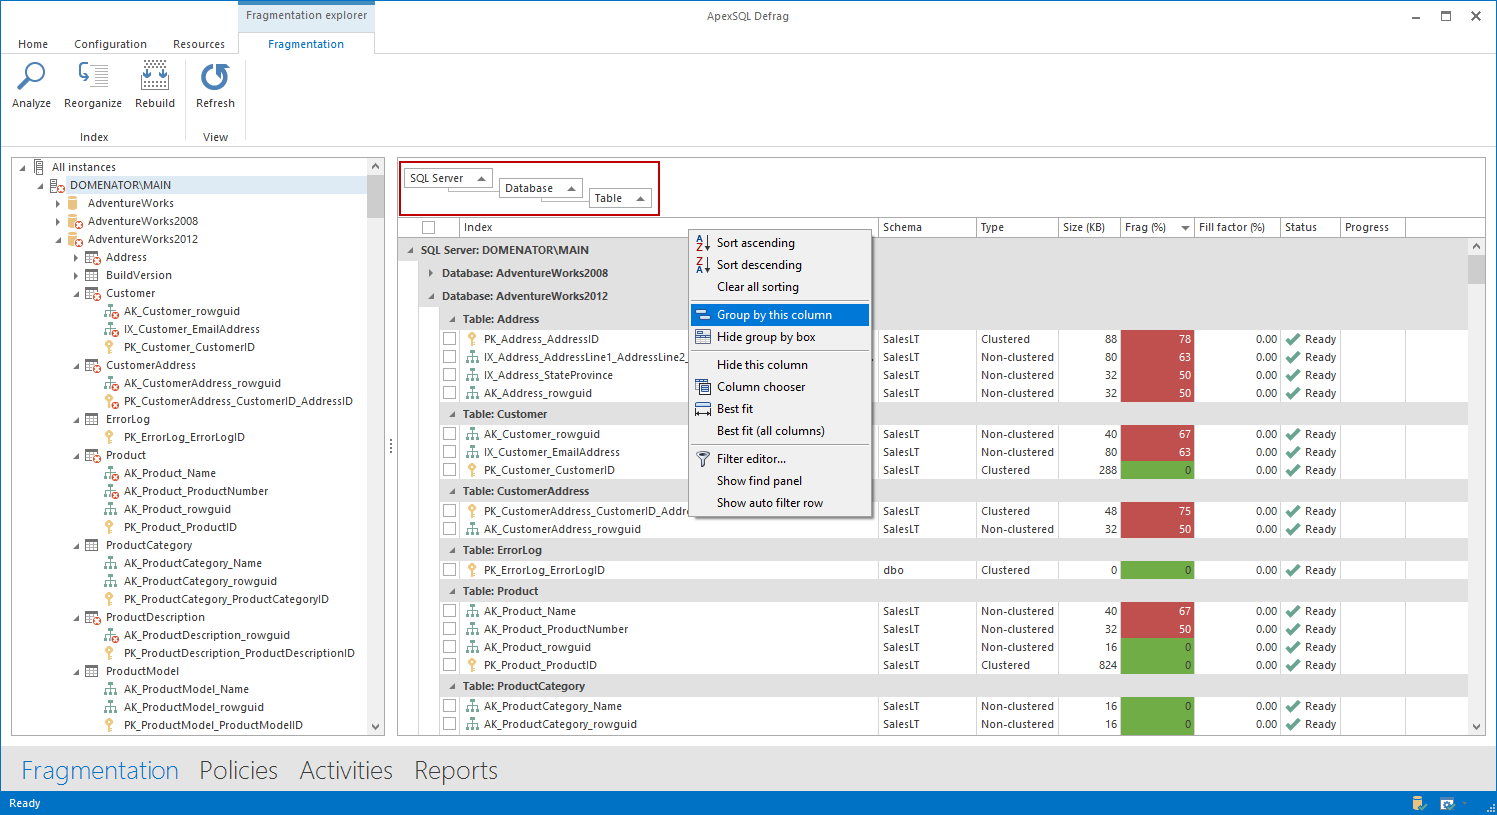
The grid also supports the use of simple filters, auto filter, and custom filter.
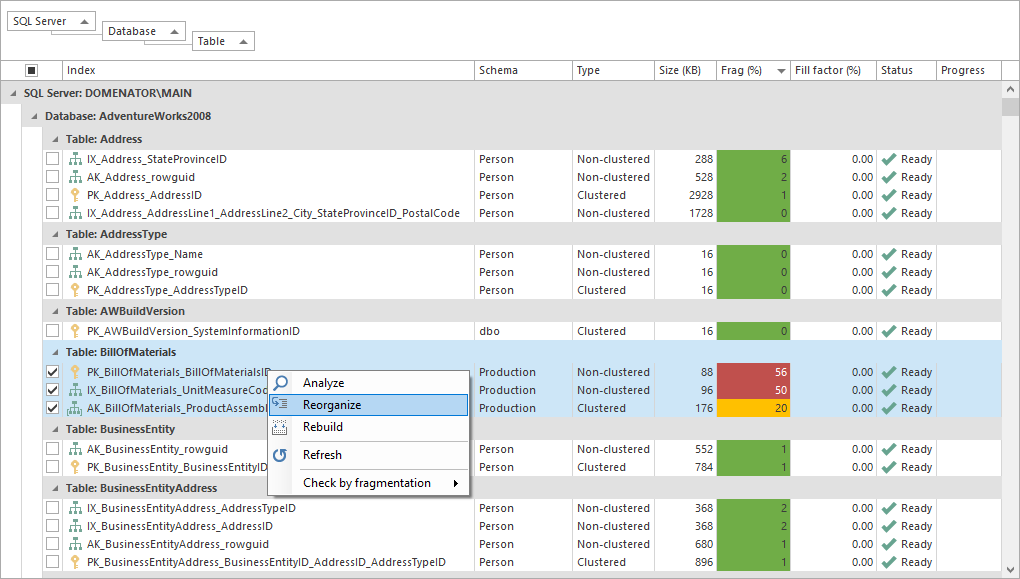
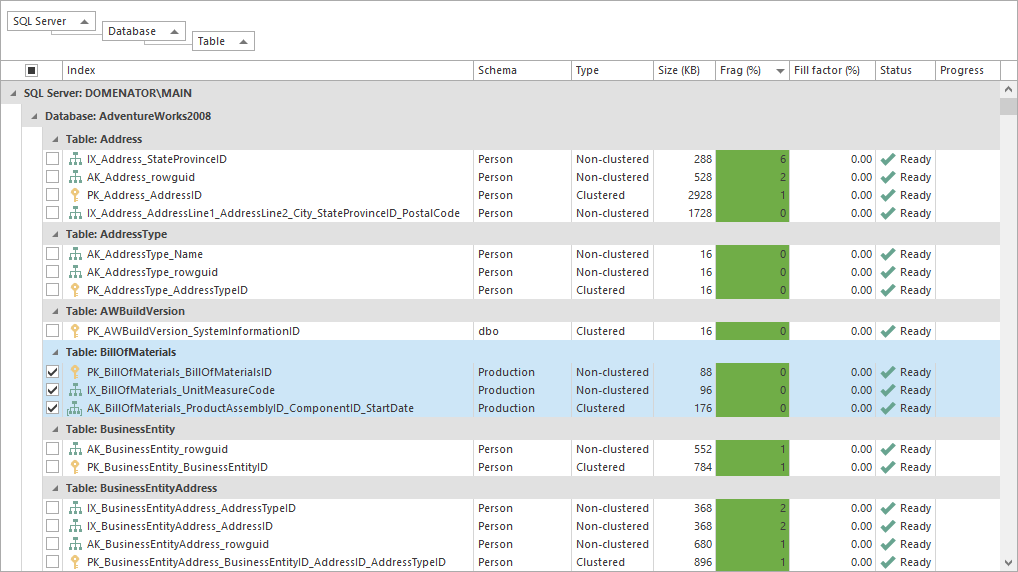
Rebuild and reorganize fragmented indexes
The main purpose of the application is the index fragmentation maintenance. To rebuild or reorganize indexes belonging to a table, database or entire server, select the indexes in the grid, and click on rebuild/reorganize option in the context menu.
Create and manage customizable policies
To automate all index maintenance tasks, use custom ApexSQL Defrag policies. Each policy will automatically analyze and perform rebuild or reorganize index operations according to the set parameters.
-
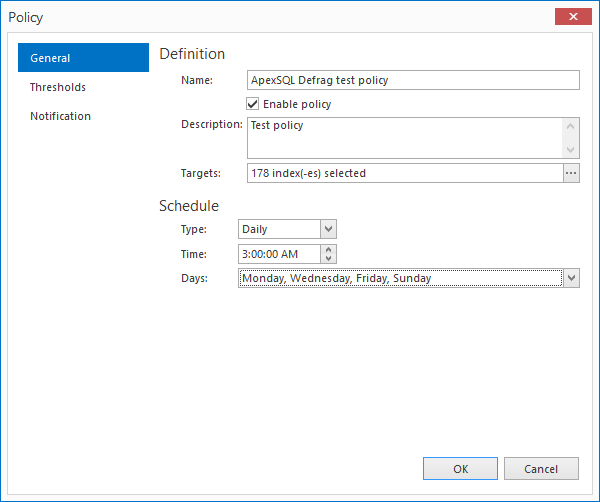
To create a new policy, select the Policies view, and click on the Create button.

-
In the General tab of the wizard, set the policy name and specify the indexes that will be managed by the policy. Define the schedule for the selected operations.
-
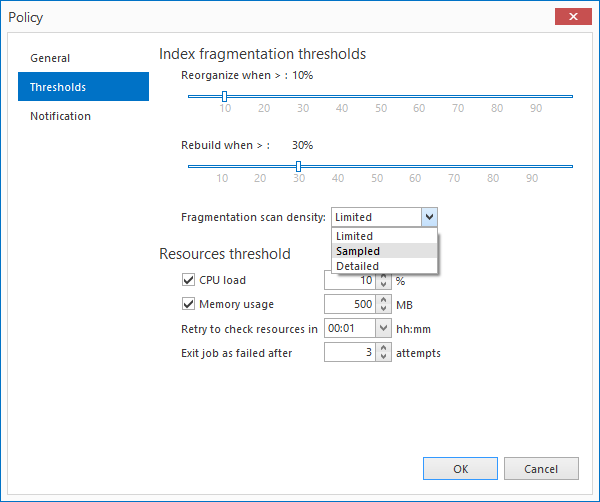
In Thresholds tab, set the thresholds for reorganize and rebuild index operations, as well as fragmentation scan density. In the same tab, configure CPU load and Memory usage thresholds to automatically limit available server resources for the job.
-
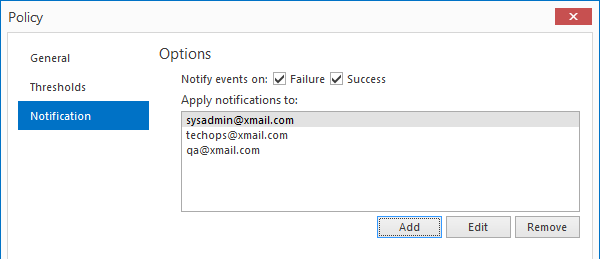
Optionally, configure the email notification reports for the policy in Notification tab
-
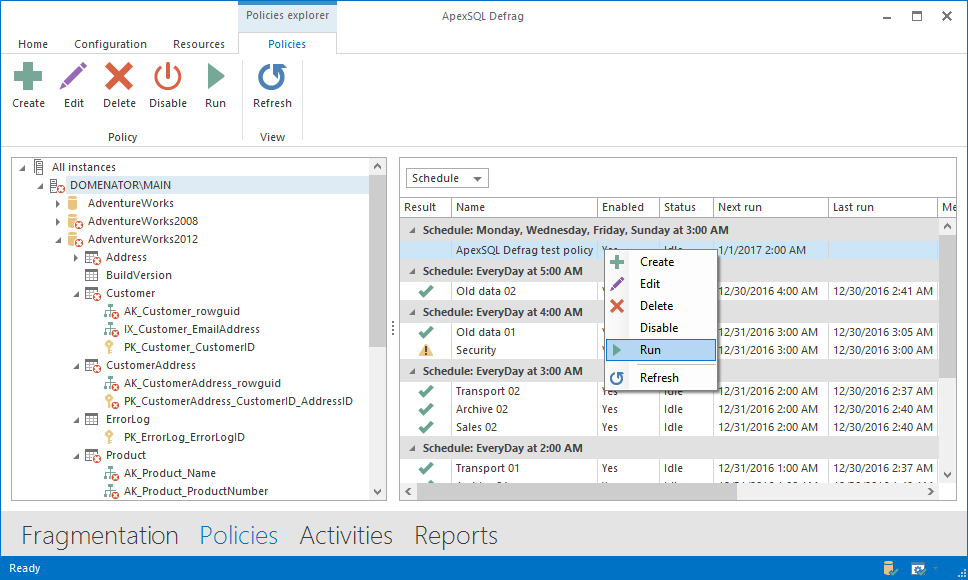
As soon as the policy is created, it is available in the policies grid. If needed, the created policy can be executed immediately by clicking on Run button. To prevent the policy from running in the future, use the Disable option. To modify the policy settings, use Edit button.
Monitor all defragmentation jobs and policies from a central location
There is no need to install any procedures or services on the remote servers in order to run or monitor defragmentation jobs – installation of ApexSQL Defrag agent service is required only on local machine that is used as a control point. All available SQL Server instances can be added to the server list.
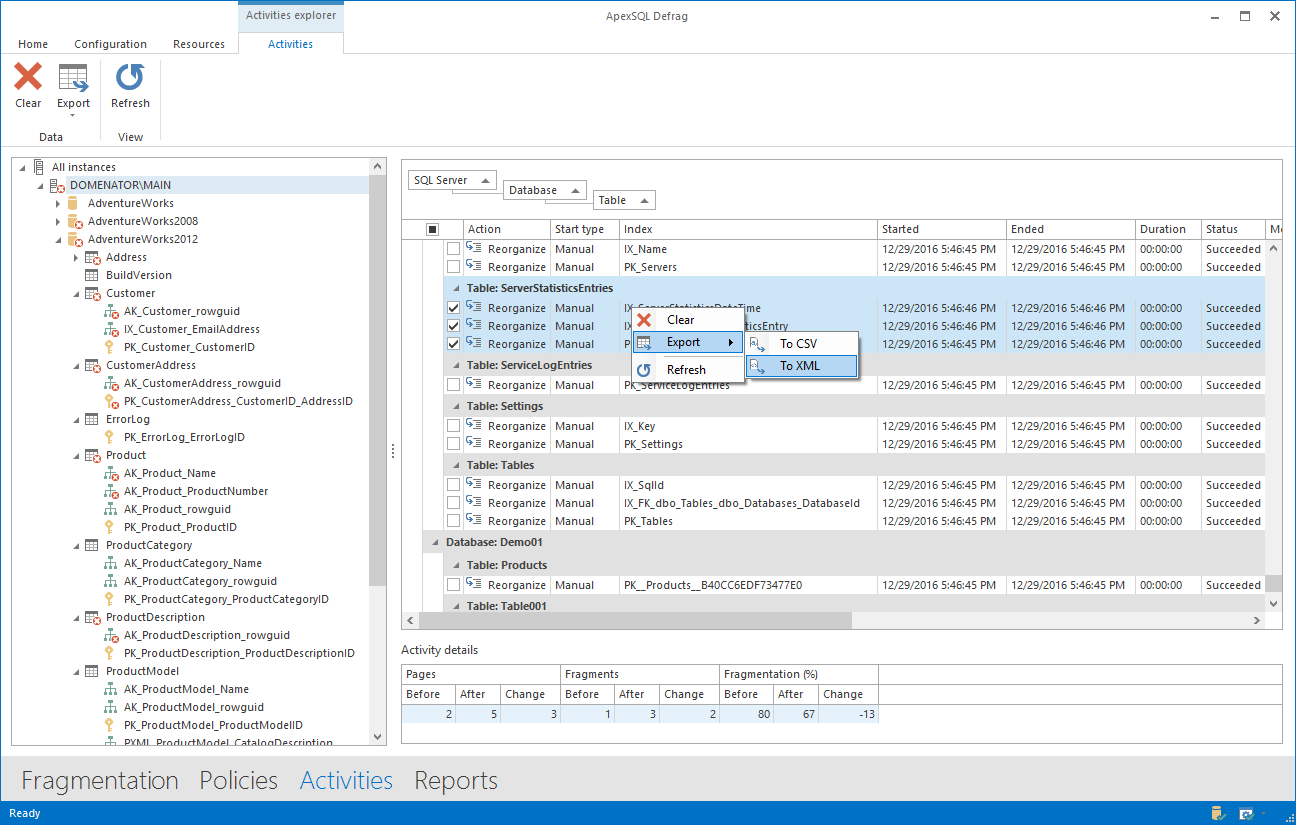
Records for all jobs executed by ApexSQL Defrag on local or remote servers can be found in the Activities grid. The grid shows each action performed on a specific index, start and end time of the job, as well as duration and status for the job.
The changes made by the last running job for the selected index are displayed in Activity details grid. The grid shows before and after values for index page and index fragment count, as well as values for fragmentation percentage.

Same as with fragmentation analysis grid, all entries in activities grid can be grouped or sorted by any column. The same filtering options are also available for the activities grid.
Export the activities to CSV or XML
All activities presented in the grid can be exported as CSV or XML files. To do so, mark the check boxes in front of the entries that need to be exported, click on the Export button, and select the preferred export format.
Index fragmentation reports
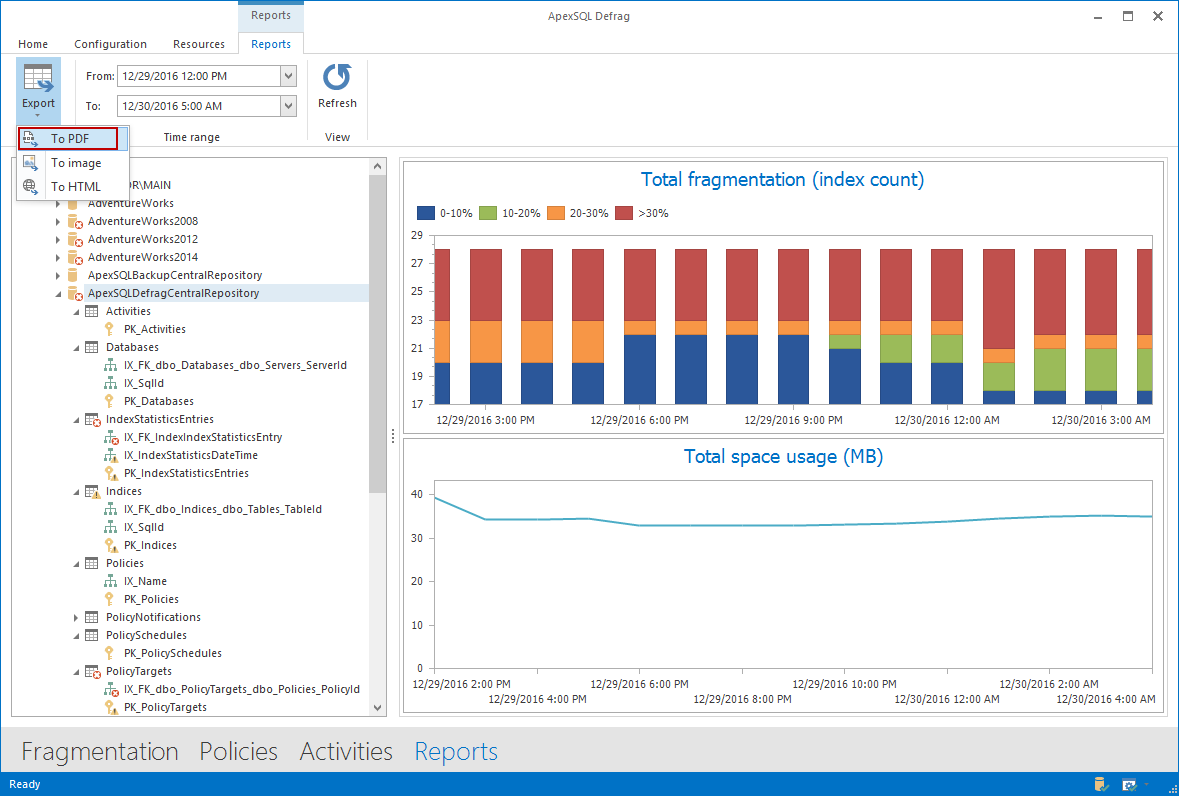
Get the index fragmentation reports for a single index, table or database. All reports are presented as line or bar charts, and can be exported as PDF, image, or HTML document. It is also possible to set the precise time range for any report.
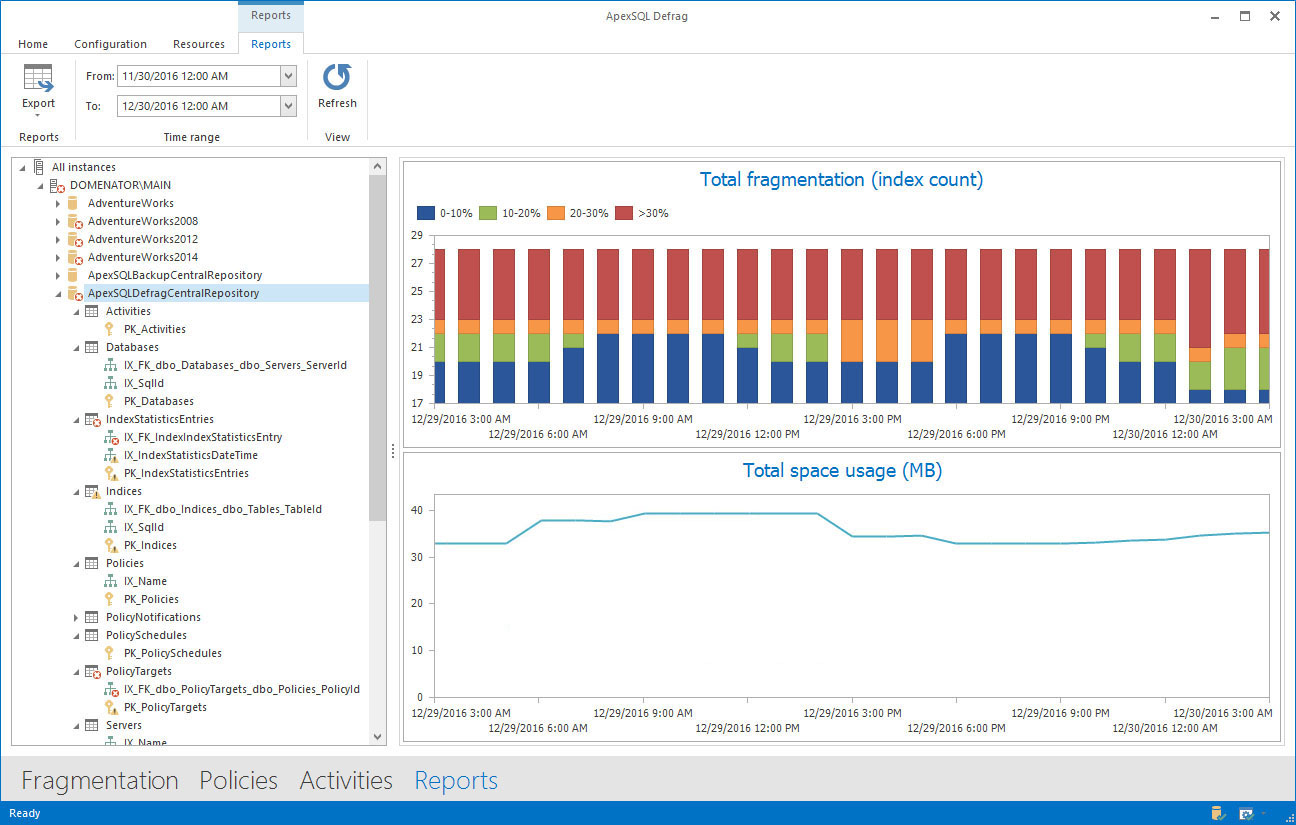
To generate the report for a database, click on Reports, and select the database from the server explorer on the left. The report will be generated automatically for the past several hours. If you need the report for another time range, change the parameters in Time range boxes. The database report shows two charts:
-
Total fragmentation chart – bar chart that shows index count for each fragmentation group at a specified time.
-
Total space usage chart – line chart that tracks the total disk space used by the indexes over the specified period of time. The chart is ideal for displaying the changes in index size on any database
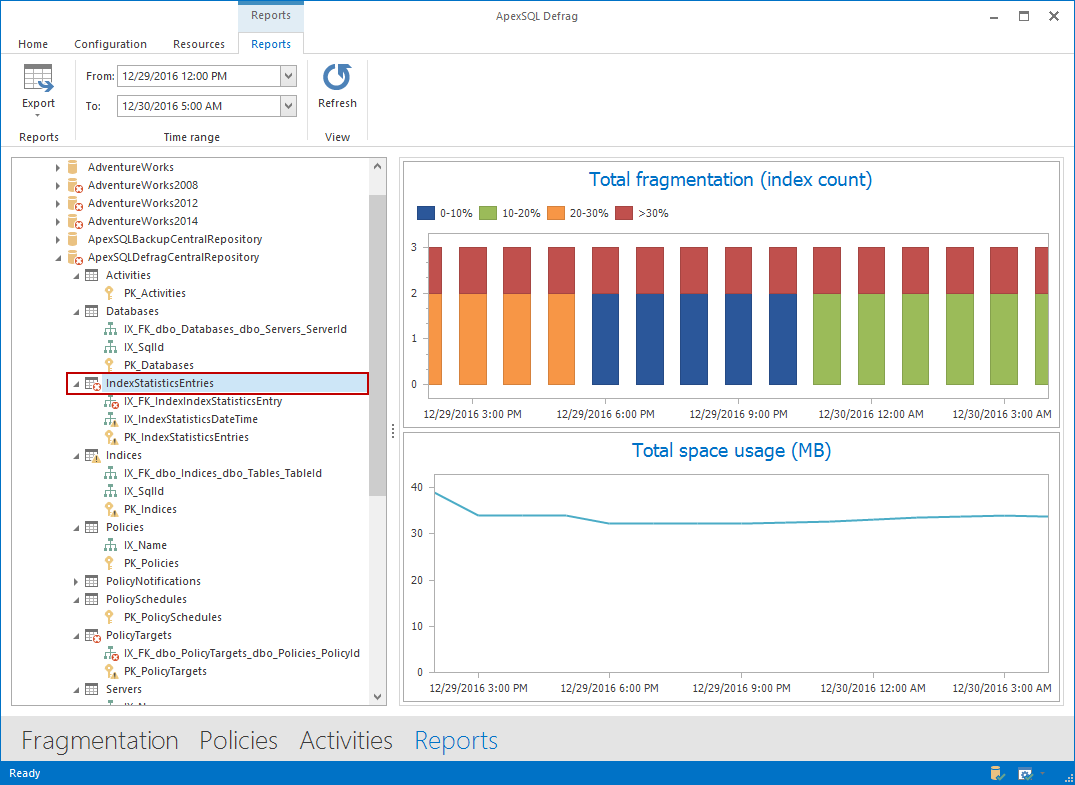
To create the report for a table, instead of the database, select a table in server explorer. Total fragmentation and total space usage charts are generated, but in this case, they only contain the data for the selected table.
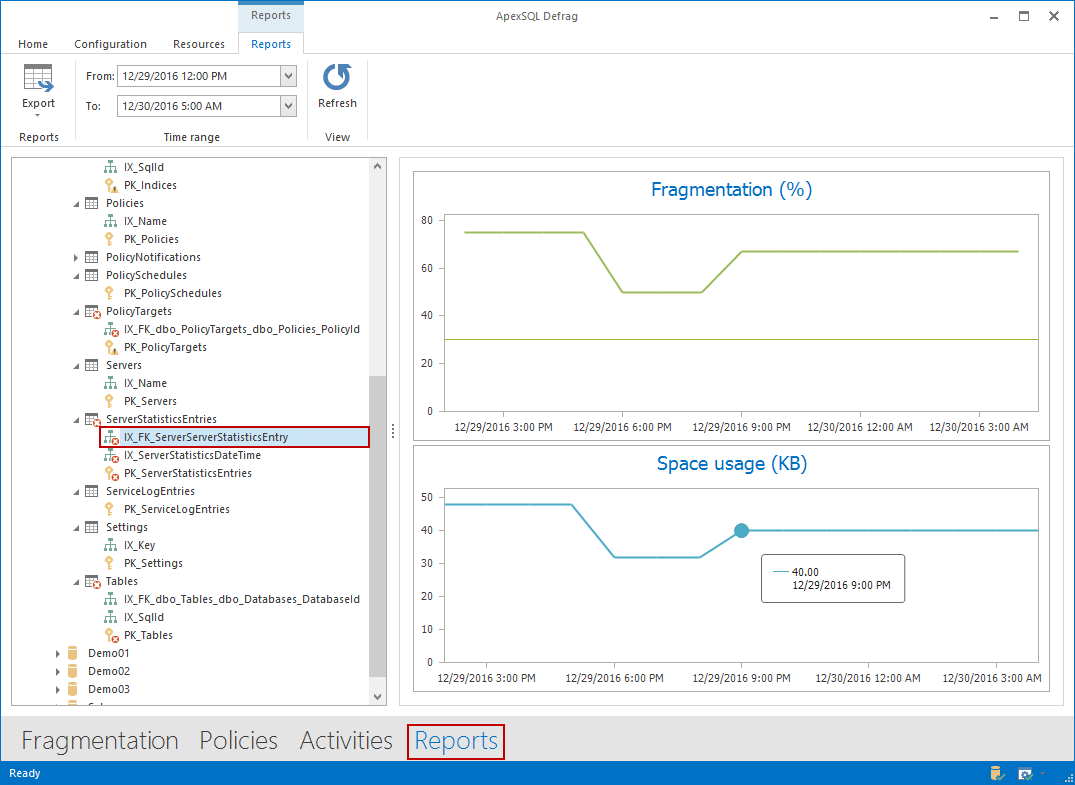
Reports for a single index are obtained in a same way as database and table reports, but are slightly different. Index report also contains two charts:
-
Fragmentation chart – line chart that displays the change of fragmentation percentage over time for the selected index.
-
Space usage chart – the chart shows the size variation for the selected index over the specified period of time.
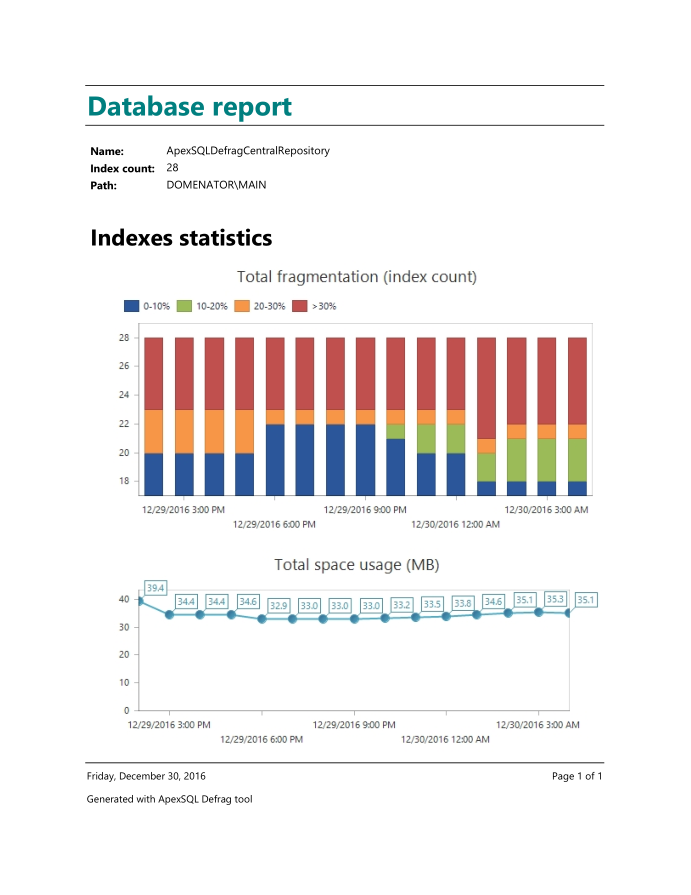
Export the fragmentation reports to PDF, image or HTML
All generated reports can be easily exported to one of the popular document formats. To export the created report, click on the Export button, and select the preferred format from the drop-down menu.
The document is created and formatted automatically.
January 4, 2017


