


Upon starting ApexSQL Defrag, we are greeted with the main grid with indexes and their appropriate information, such as fragmentation, to which table they belong, schema they belong to, type, size and other relevant information.
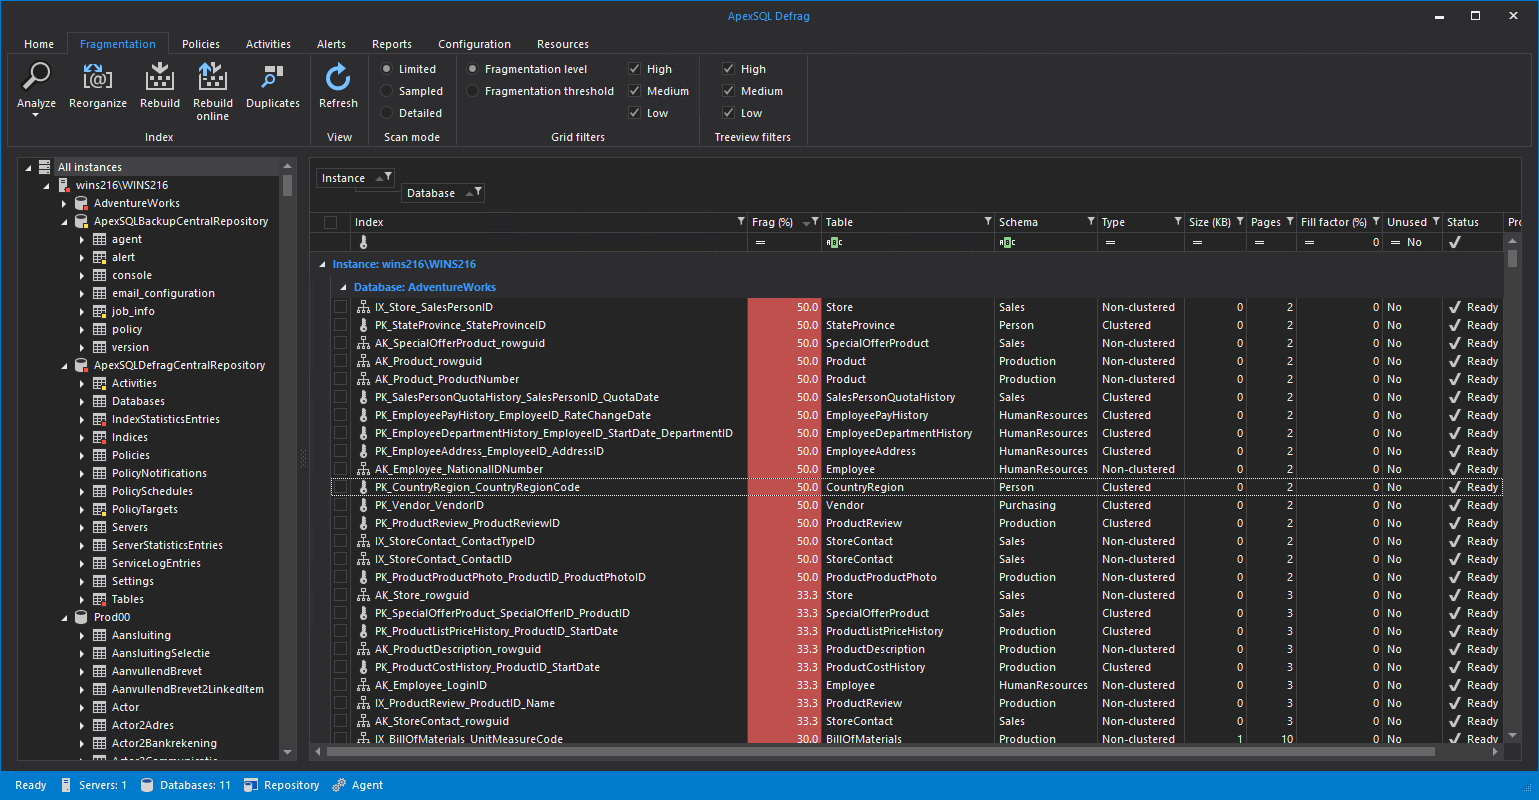
ApexSQL Defrag consists of a couple of tabs in the main ribbon, each suited for its specified purpose.
Home tab
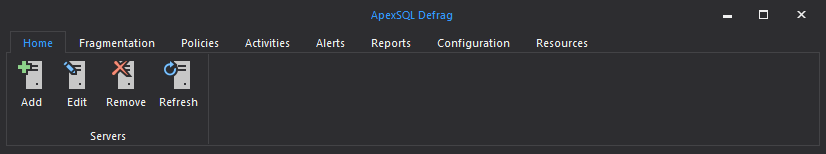
- Add allows us to add a new server to ApexSQL Defrag
- Edit is used to edit a connection of the selected server
- Remove removes the server and all the information and policies created for it
- Refresh checks the connections to the servers
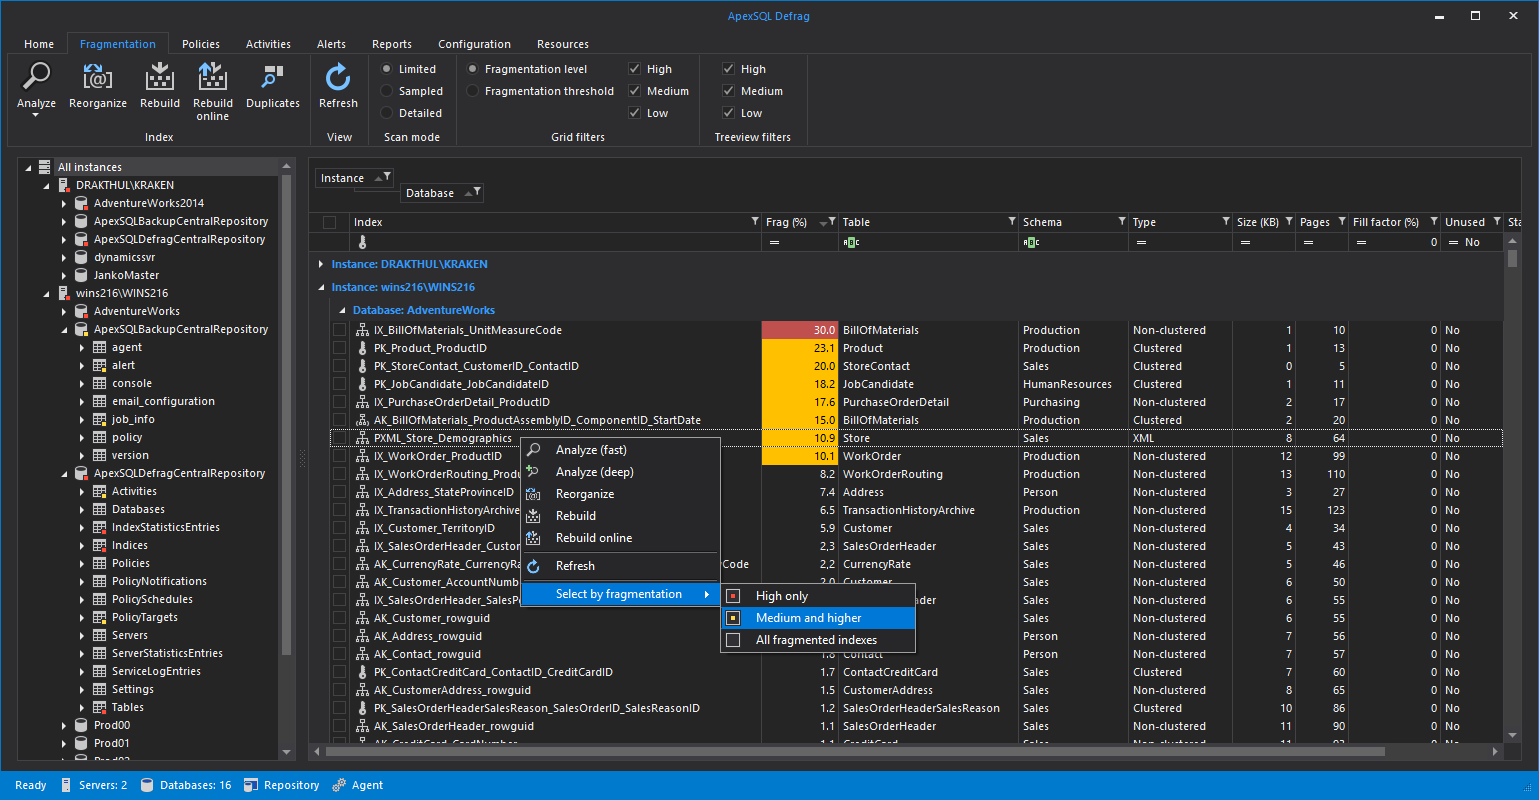
Fragmentation tab
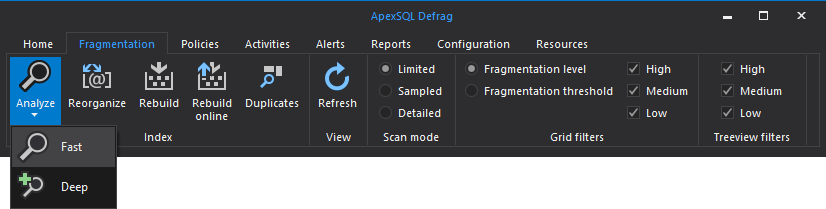
- Analyze – with drop-down menu for Fast and Deep analysis of the index fragmentation of the selected server, database, table or single index
- Reorganize – reorganizes all of the selected indexes
- Rebuild – rebuilds all of the selected indexes
- Rebuild online – does a rebuild of the selected indexes with keeping them online and available. This feature is available starting from SQL Server 2005
- Duplicates – scans the selected server for any duplicate indexes, showing them in a separate window with the possibility of creating a T-SQL script to delete duplicate indexes
- Refresh – Refreshes the fragmentation grid view
- Scan mode – Here, the user can choose between three different types of index fragmentation scan: Limited, Sampled, Detailed
- Grid filters – The fragmentation grid view can be customized to show indexes based on their fragmentation level (High, Medium, Low), or by fragmentation level, where the user can specify manually the percentage of index fragmentation threshold, and indexes with the percentage below the specified won’t be shown
- Treeview filters – where the user can set which databases are going to be shown in the treeview explorer based on their fragmentation
Policies tab
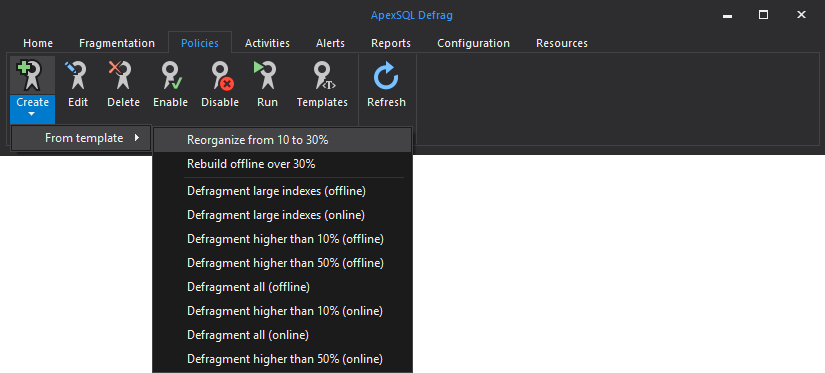
- Create – with drop-down menu for creation of policies based on a template
- Edit – allows us to edit a selected policy
- Delete – allows us to delete one or more policies
- Enable – enables selected policies
- Disable – disables selected policies
- Run – starts selected policies immediately, regardless of their schedules
- Templates – opens a new window where the user can view templates, edit, add new or delete user-created templates
- Refresh – refreshes the policy grid view
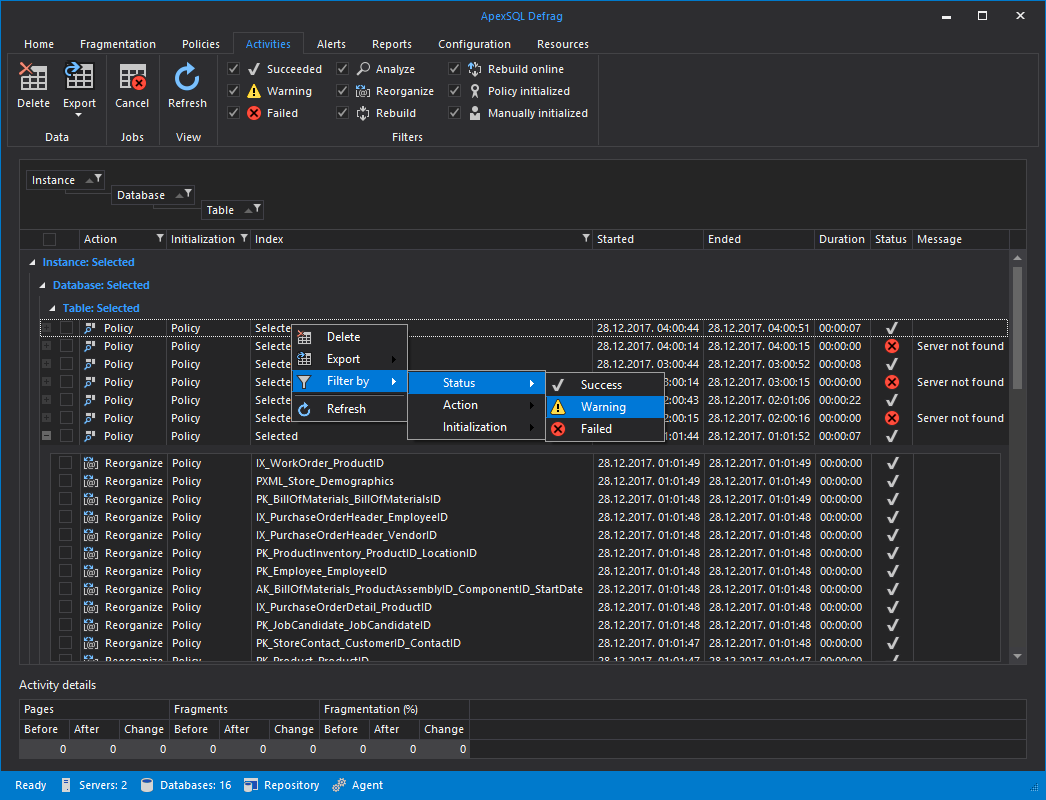
Activities tab
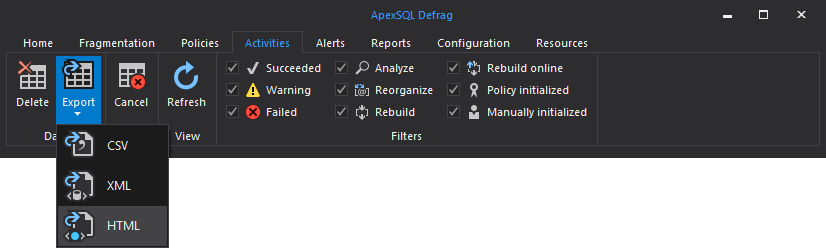
- Delete – deletes the selected activity entries from the activities grid view
- Export – with its drop-down menu to choose the format of exporting the selected activities
- Cancel – cancels the pending tasks
- Refresh – refreshes the activities grid view
- Filters – where the user can select which kind of activity will be displayed in the activities grid view
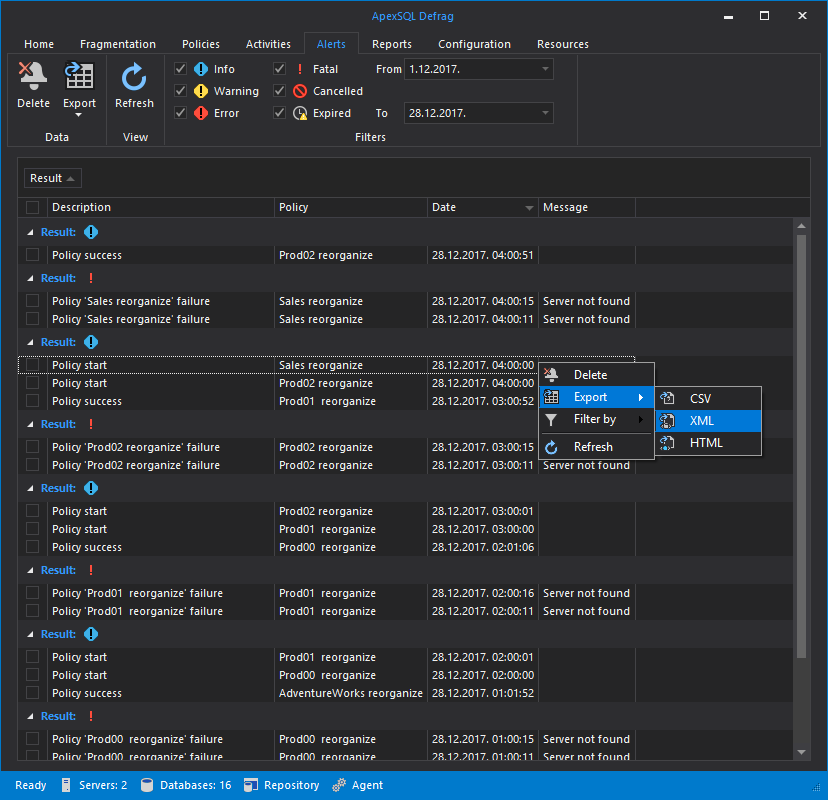
Alerts tab
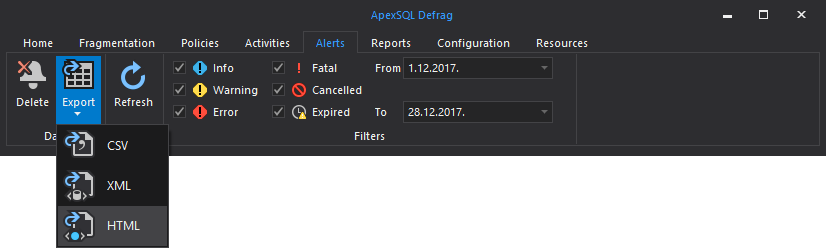
- Delete – deletes the selected activities
- Export – with its drop-down menu to choose the format of exporting the selected alerts
- Refresh – refreshes the alerts grid view
- Filters – where the user can select which kind of alert and time range will be displayed in the alerts grid view
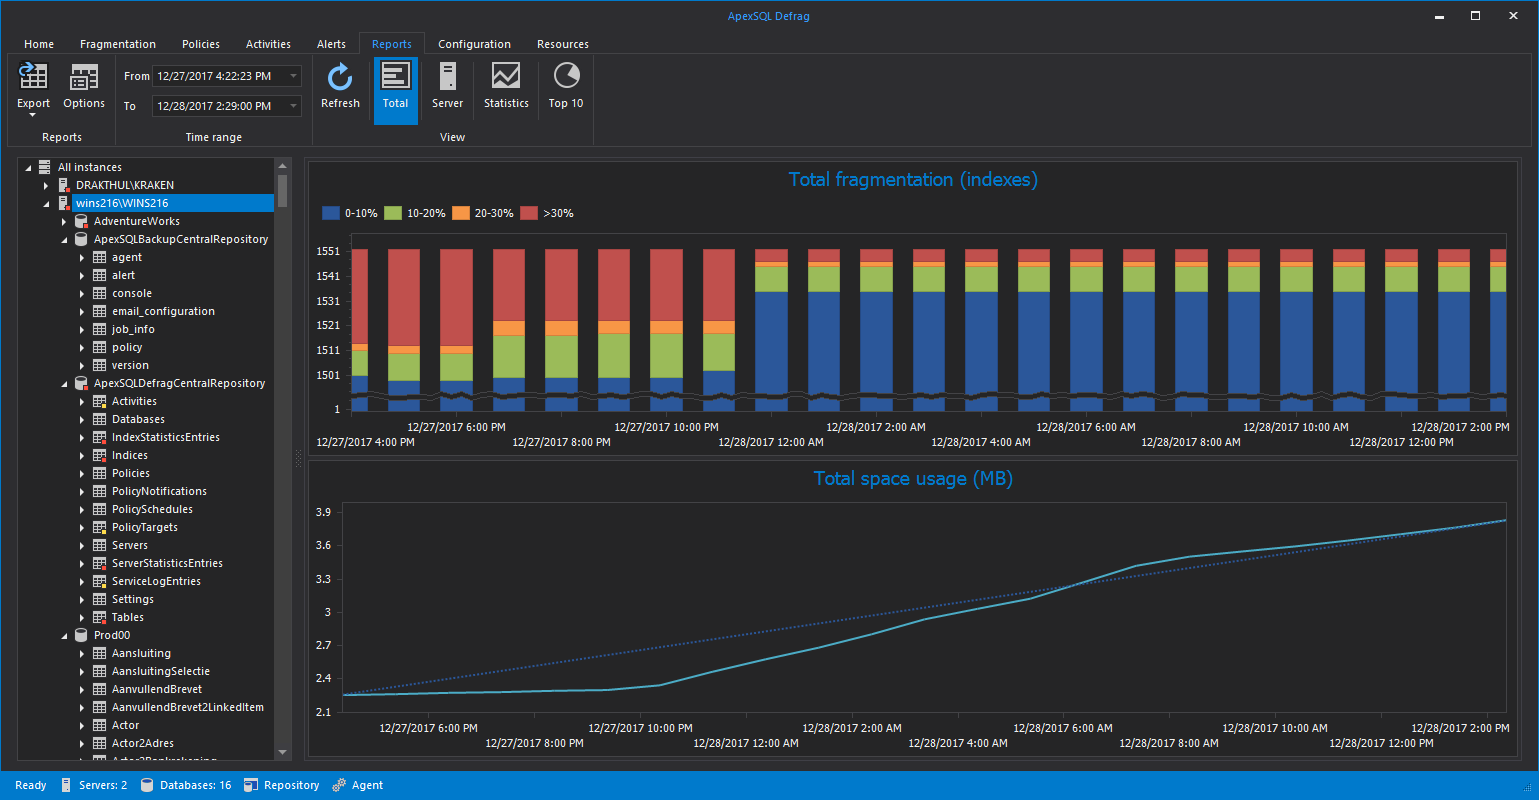
Reports tab
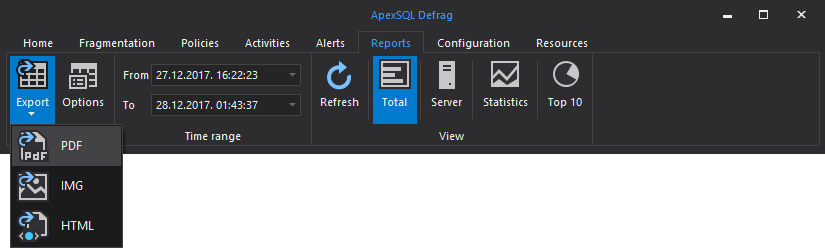
- Export – with its drop-down menu to choose the format of exporting the selected reports into output including PDF, image and HTML
- Options – which opens a new dialog for precisely configuring the export options for the reports
- Time range – where the user can define start- and end-point for the reports graphs to be shown
- Refresh – refreshes the reports grid view
- Total – shows the total fragmentation and space usage of all the indexes selected in the treeview explorer, be it a single index, a table, database, server or all of the servers added to ApexSQL Defrag
- Server – this option is only available when a server is selected in the tree view explorer and displays total index fragmentation and space usage on a server level
- Statistics – shows the statistic information for the selected object in the treeview explorer
- Top 10 – shows top 10 fragmented clustered and non-clustered indexes in the treeview selected server or database, or across all of the servers added to ApexSQL Defrag
Fragmentation grid view
Here the user can view all of the indexes sorted by fragmentation in descending order by default, as well group the view by one or more of the available columns for a more organized view, as well as perform actions upon selected indexes.
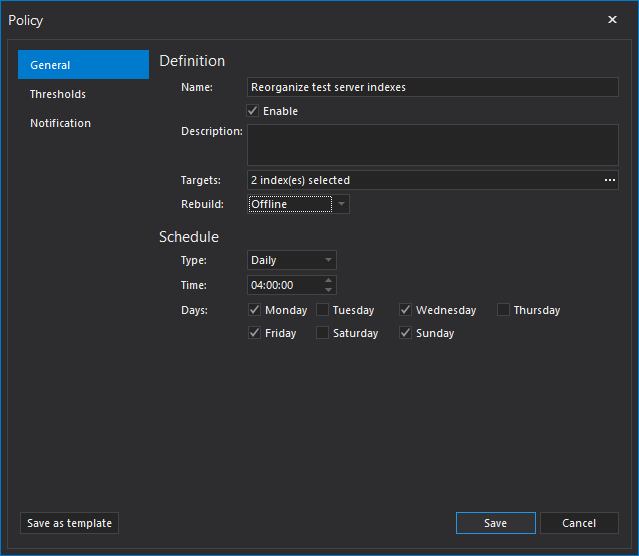
From the Policies tab, the user can start a policy creation dialog.
General tab – where the user can set name, description, which indexes are going to be affected with this policy, and schedule when the policy will be performed
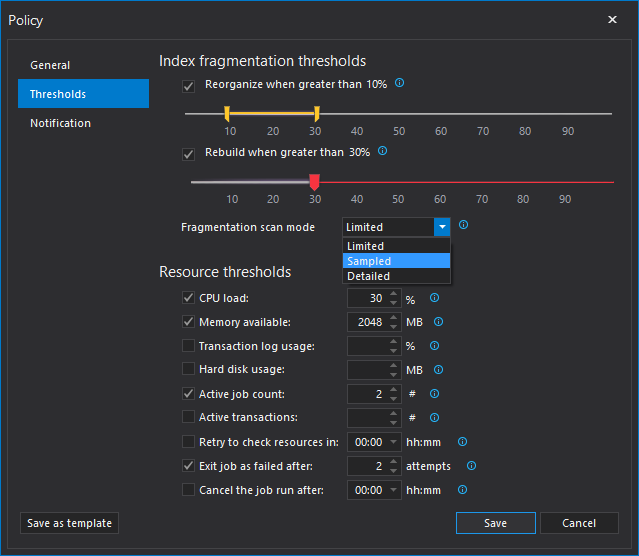
Thresholds tab – where the user can fine tune the settings of the policy, such as whether to reorganize, rebuild, or both, setting the fragmentation percentage thresholds as well as set some resource thresholds based on the environment of the server
Notification tab – where the user can setup a notification system for different policy endings
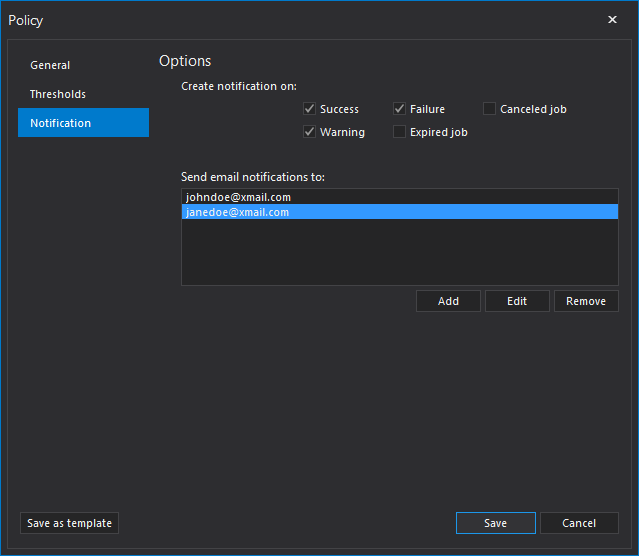
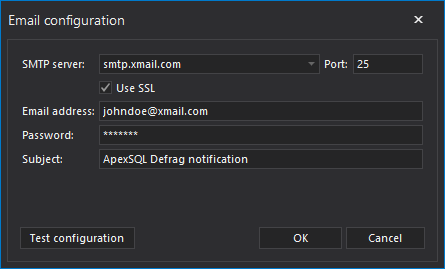
To be able to send notifications, the user must first configure the email settings, either from the Options in the Configuration tab of the main window, or when prompted when first creating a policy.
After having set up a couple of policies and letting them run, the activities grid view will populate. We can group the view by any of the available columns and view them.
Similarly, as with Activities, the user can also view all alerts thrown while performing index defragmentation, whether manually or by scheduled policies.
The reports tab shows us insight as to how the fragmentation and space occupied for the selected object in the treeview explorer has changed over time, with trendlines for predicting future changes.
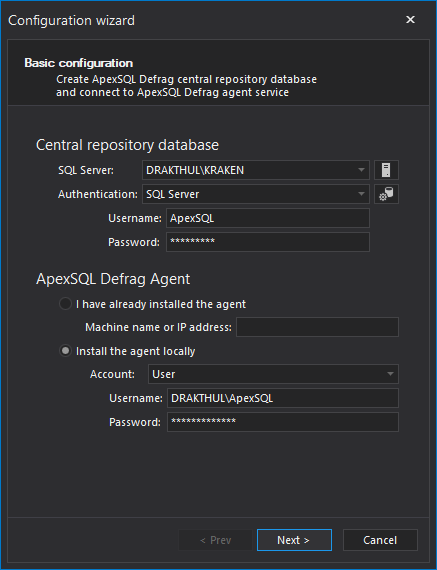
If a user would wish to change the location of the central database repository or reinstall ApexSQL Defrag, it can be done by going to Configuration tab and selecting Run wizard. The configuration wizard is also initiated on the first start of ApexSQL Defrag.
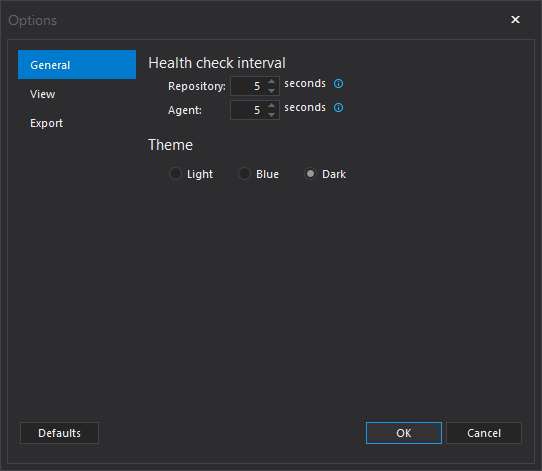
In the Options under the General tab, the user can change the Health check intervals and the theme of the application.
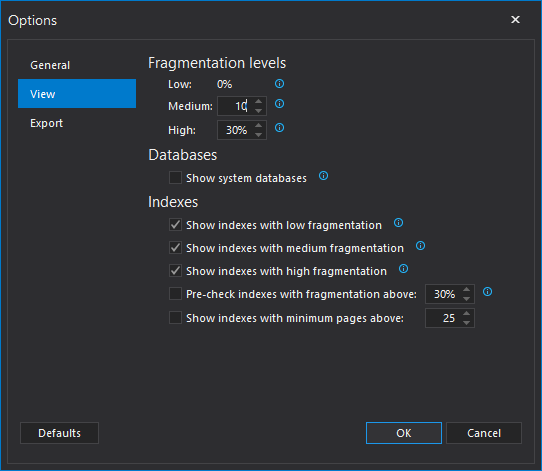
Under View tab, the user can set the percentages of fragmentation for medium and high levels of fragmentation, as well as choose whether to show system databases or not and more.
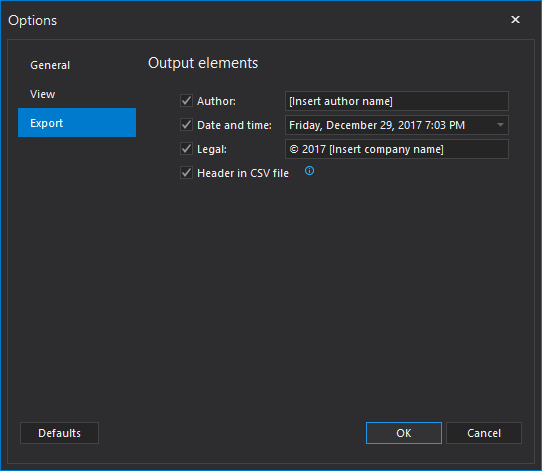
Under Export tab, the user can change some of the output elements contained within the export documents.
January 3, 2018


