


AlwaysOn
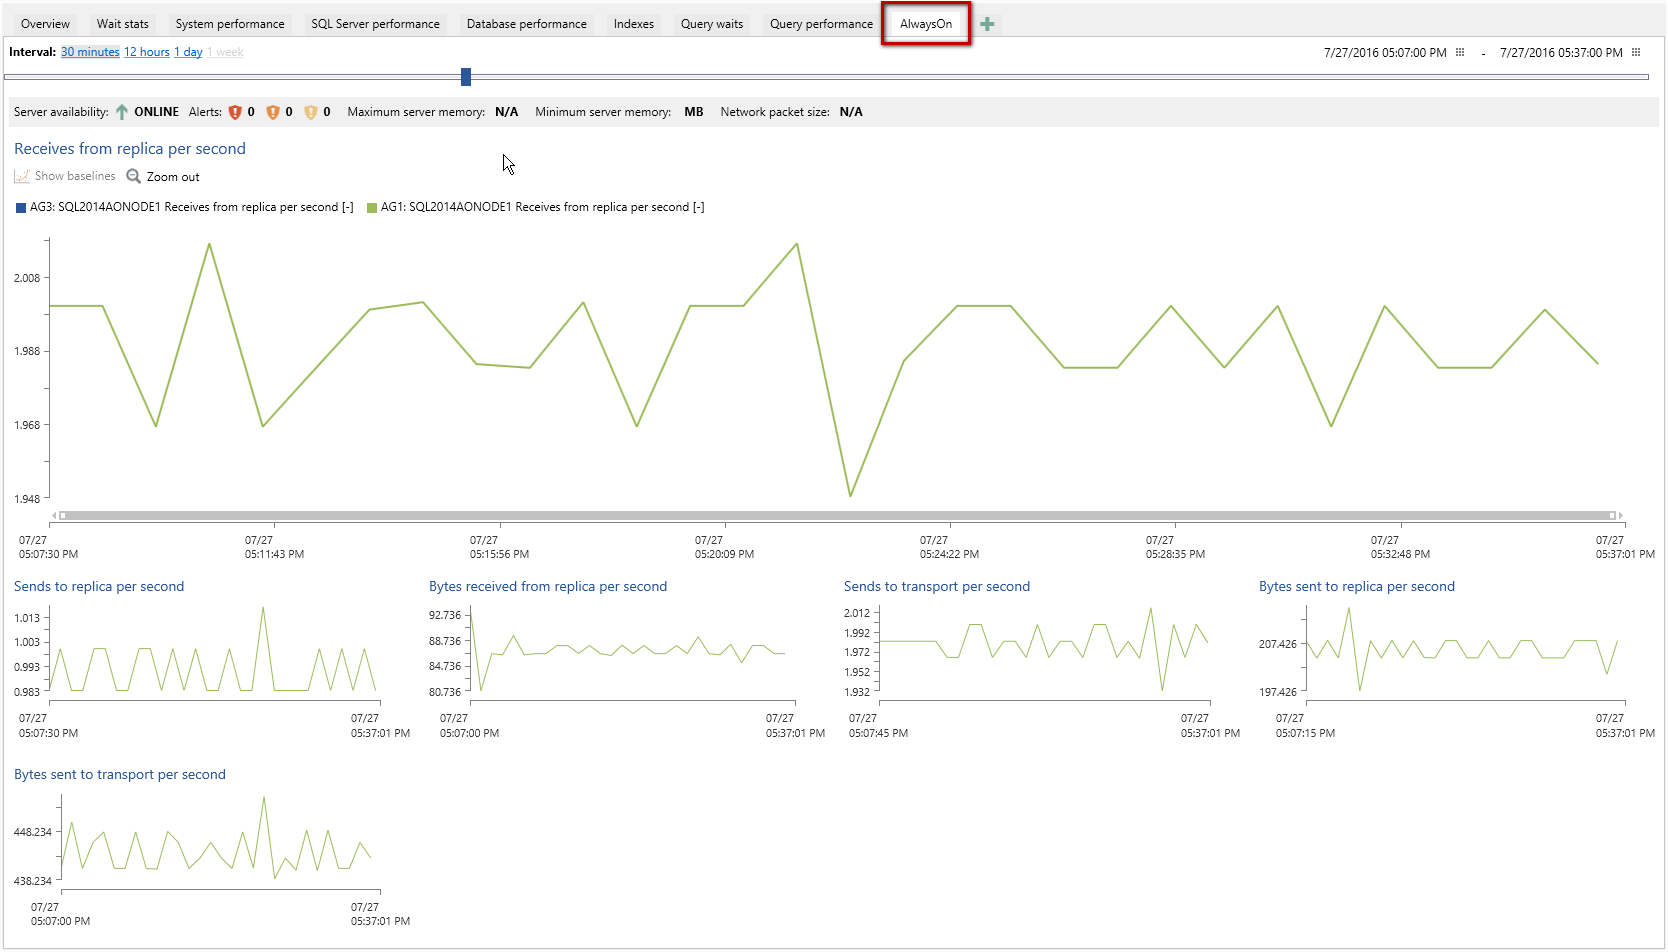
Full support for AlwaysOn availability groups monitoring with graphical presentation of topology for all WSFC nodes and AG replicas including the full info and relations between the replicas, has been introduced
AlwaysOn monitoring also includes monitoring of the most important AlwaysOn counters and their graphical presentation
Always On alerting
In addition, all AlwaysOn Availability Group replica and database metrics, as well as AlwaysOn status counters can be fully configured to create alerts when a defined threshold is breached or status changed
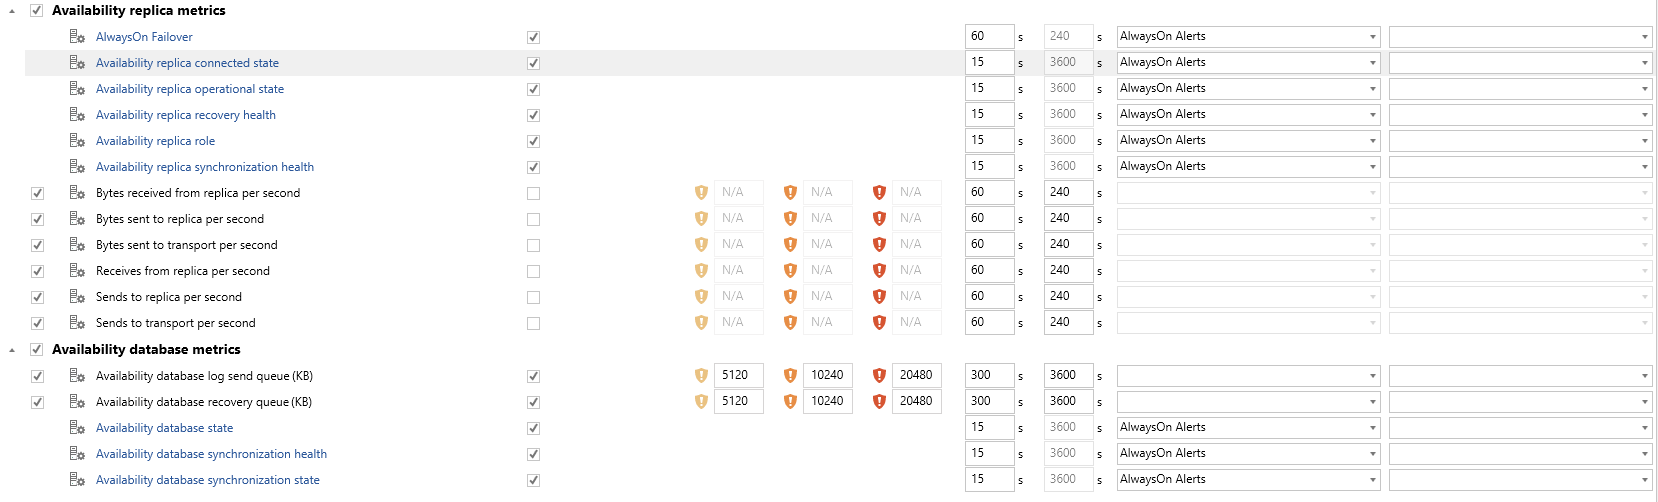
More details about this can be found in the Monitoring AlwaysOn Availability Group KB article
Improve query waits improvements
Individual query waits and query performance collection have been improved with more statistical details
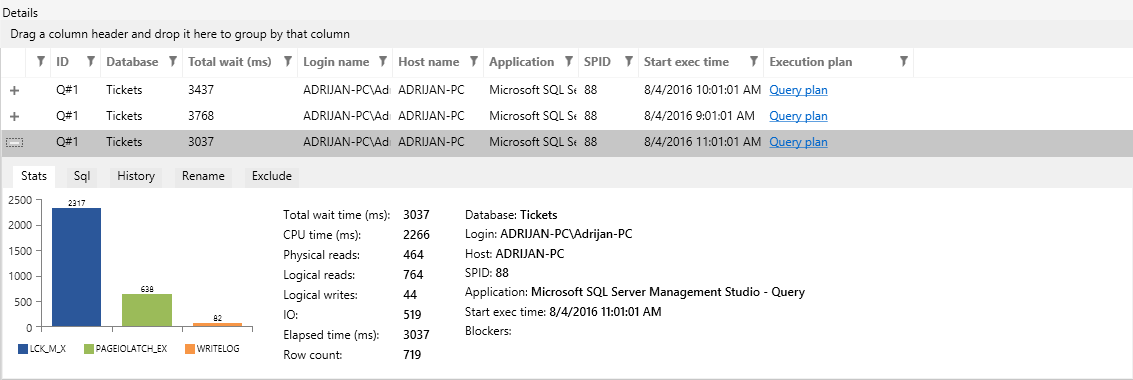
ApexSQL Monitor can now display the historical view of query waits for a selected period of time for each individual query, including statistics like the number of executions, I/O operations, data rows affected in that period etc.
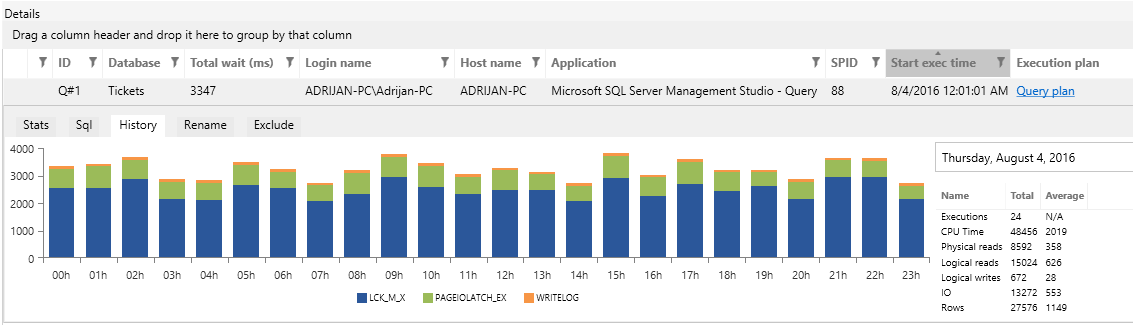
Whether high wait times occur regularly during specific time of day can be ascertained to allow investigation of other parameters such as known time range
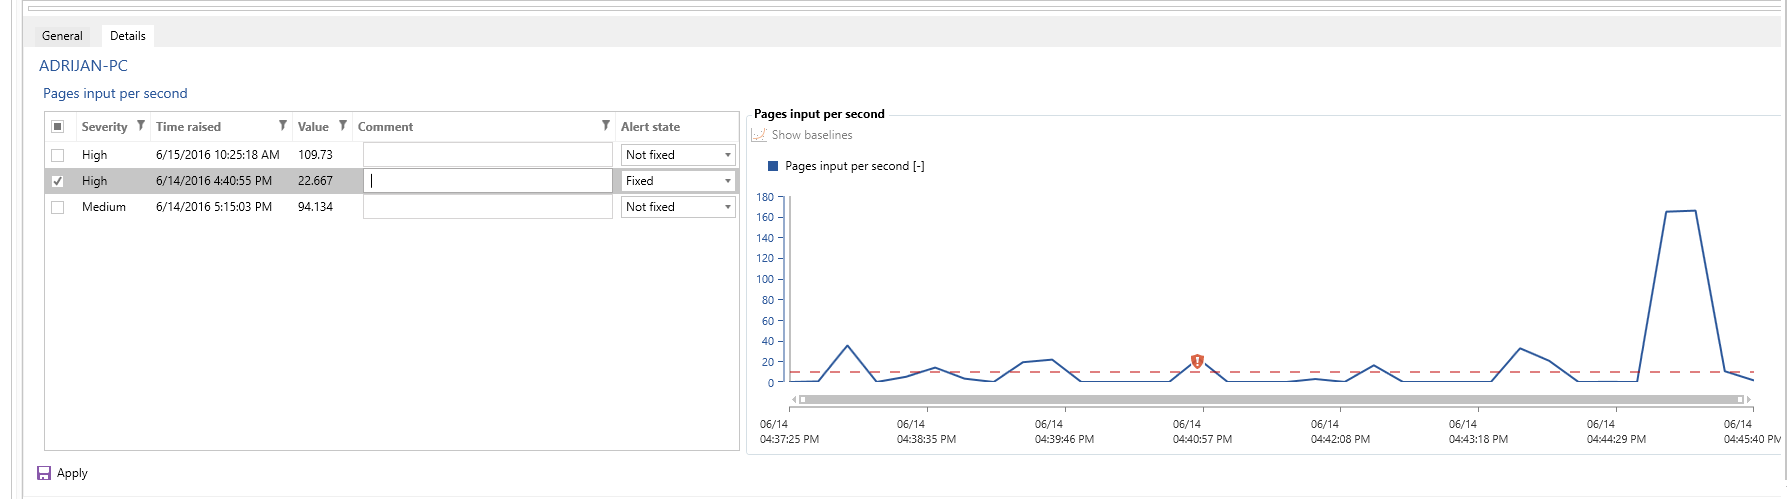
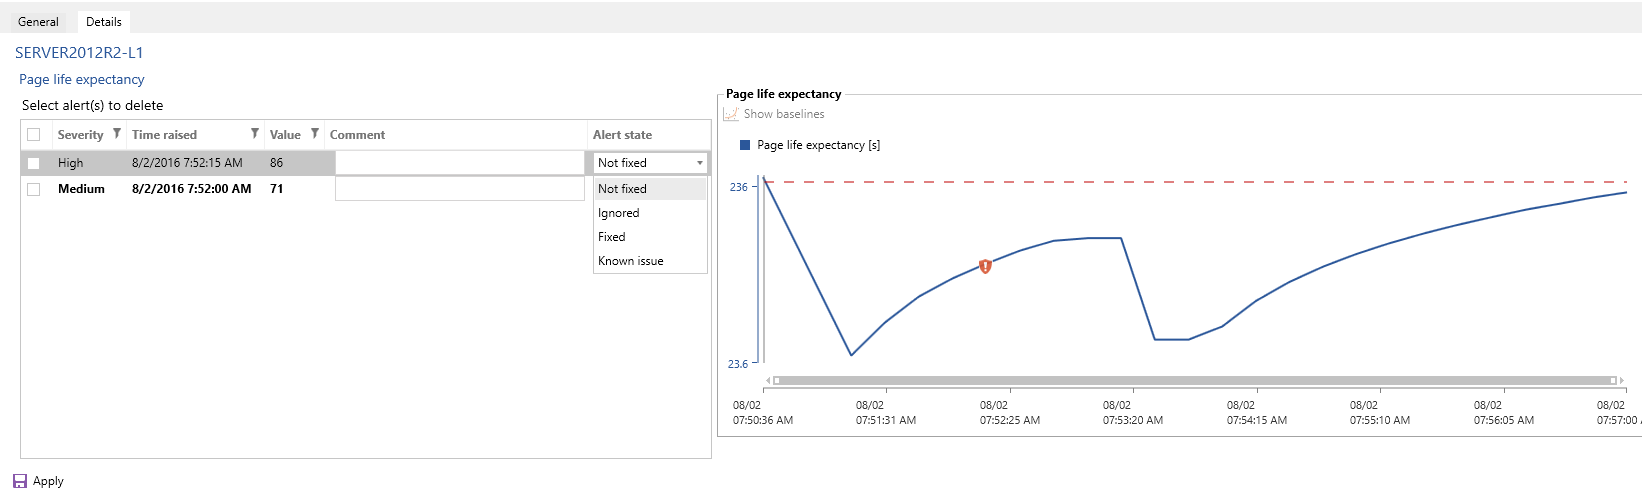
Alert resolution and comments
The ability to resolve each individual alert has been introduced. In addition, comments on resolution that will help add context and explain the resolution can be added. An administrator can also now make comments on resolving alerts mandatory to ensure all alerts are attended to
Reporting on active and resolved alerts has also been added.
Smarter alerting
The new alerting engine ensures that only alerts that conform to the user defined alert period are triggered. More can be seen here: How to suppress excessive alerting using Alert periods
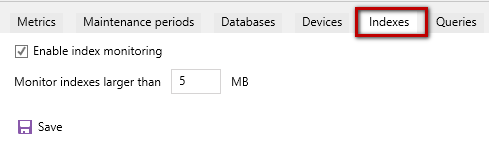
Index monitoring
Index monitoring including index metrics and graphical presentation of index metrics has been added
The application allows users to configure index monitoring in “fire and forget” mode. All that has to be configured is the minimal size of an index to monitor. The rest will be handled by the application itself, e.g. by default the minimal index size that will trigger the index monitoring is 5 MB. All indexes that are smaller than that size will not be monitored, but the application will constantly track the size of all indexes, and the moment an index size reach 5 MB, it will be automatically added for monitoring… in the same manner if the index size drop below 5 MB it will be automatically excluded from monitoring
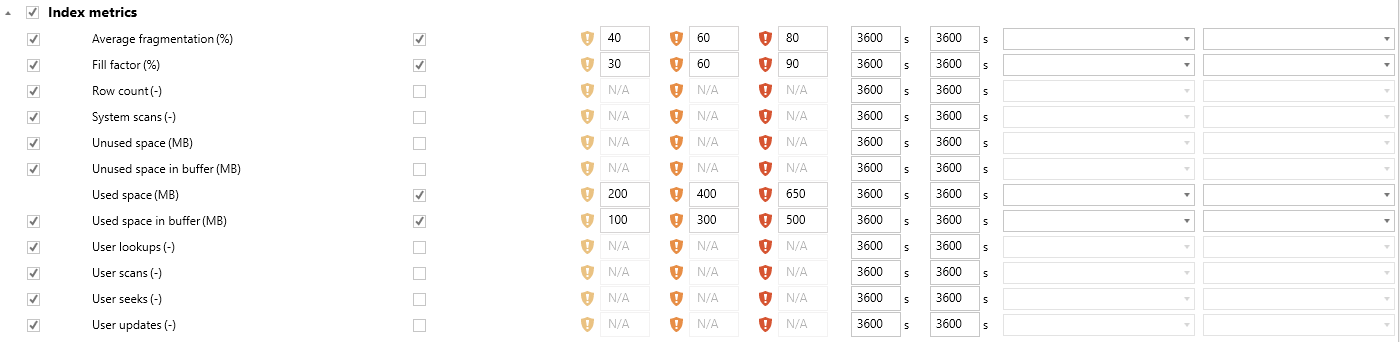
User defined index monitoring alert thresholds
ApexSQL Monitor can now be configured to ensure alerting on all index metrics according to user defined thresholds
|
Quick tip:
Index metrics thresholds are not configured and alerting is not turned on by default, as specific thresholds are strongly dependent on individual user systems and configurations. In order to prevent unnecessarily/excessive alerting, index thresholds should be configured when alerting is turned on for desired index counters |
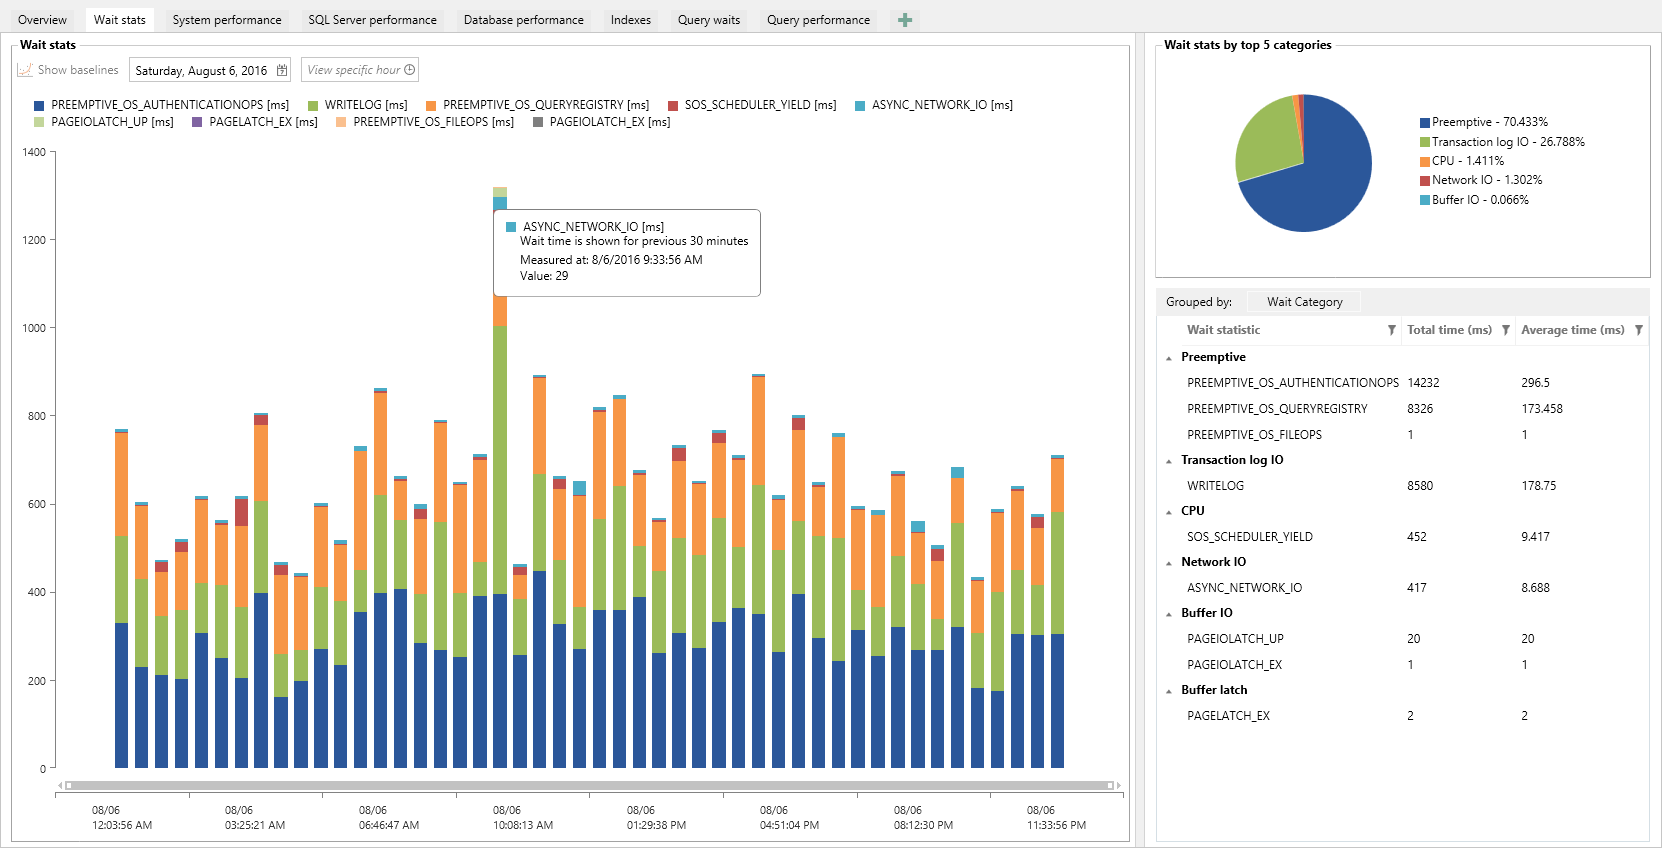
Improved wait stats
Redesigned waits stats to grant easy insight into all wait statistics at glance has been introduced. Now, besides being able to get the graphically conveyed historical presentation of waits stats, there is a fast and easy way to gain information about a percentage distribution of wait stats by top five wait stats categories. Detailed info of those wait stats including the total and average wait times per each wait stats within each of top 5 categories, are also shown
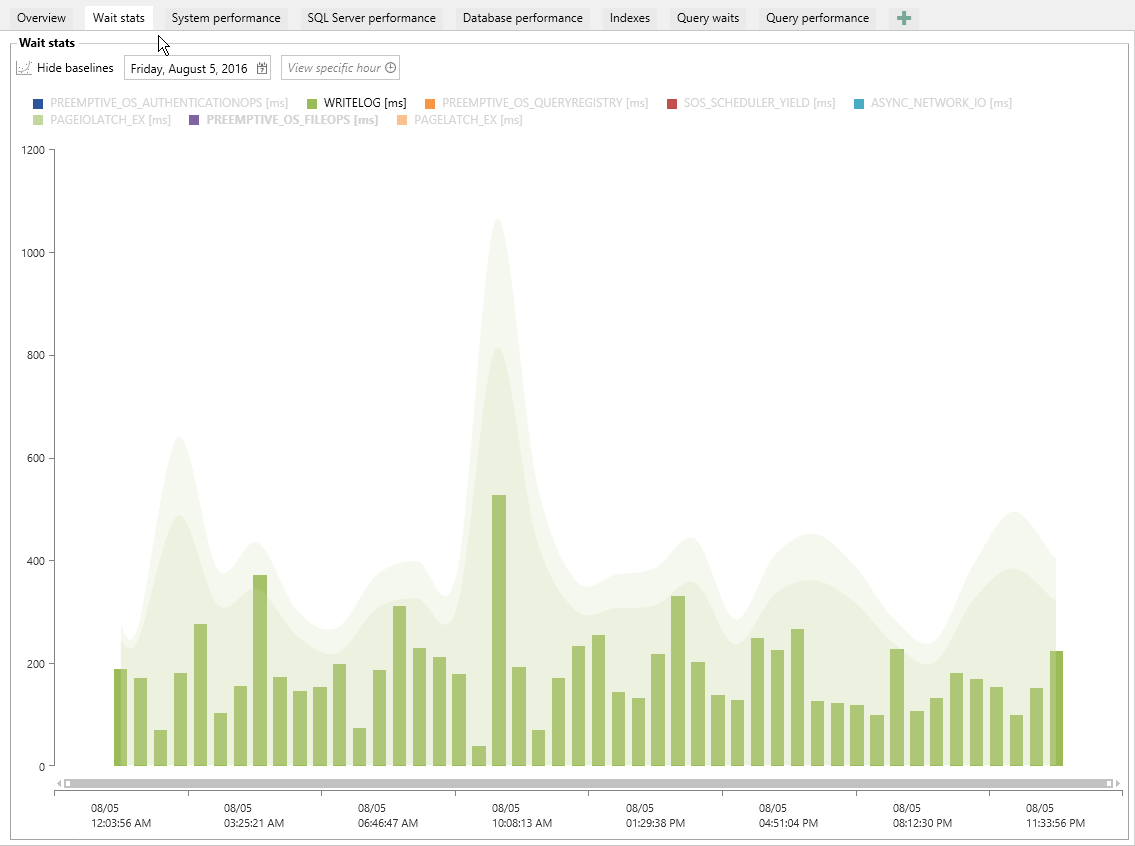
Wait statistics baselining
Baseline calculation for Wait statistics is now supported. So a “good” performance period, can be used to baseline thresholds for alerting and notifications. This is particularly important for wait types where wait times are significantly dependent on the user system, hardware and used applications and “excessive” values often don’t indicate real problems
Improved query waits configuration
Improved query waits configuration allows users to determine the minimal wait time that a query has to wait in in order to be collected and stored for historical presentation. By default, ApexSQL Monitor will collect queries in which a wait time is larger than a particular time increment e.g. 1 second
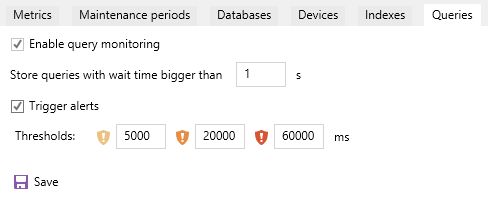
Additionally, users can configure the alert threshold values. Default values are considered “safe” threshold values that when excelled will trigger alerts, but will generally avoid excessive alerting on most systems. As threshold and query wait values are quite dependent on user systems and configurations though, users can fine tune those values to
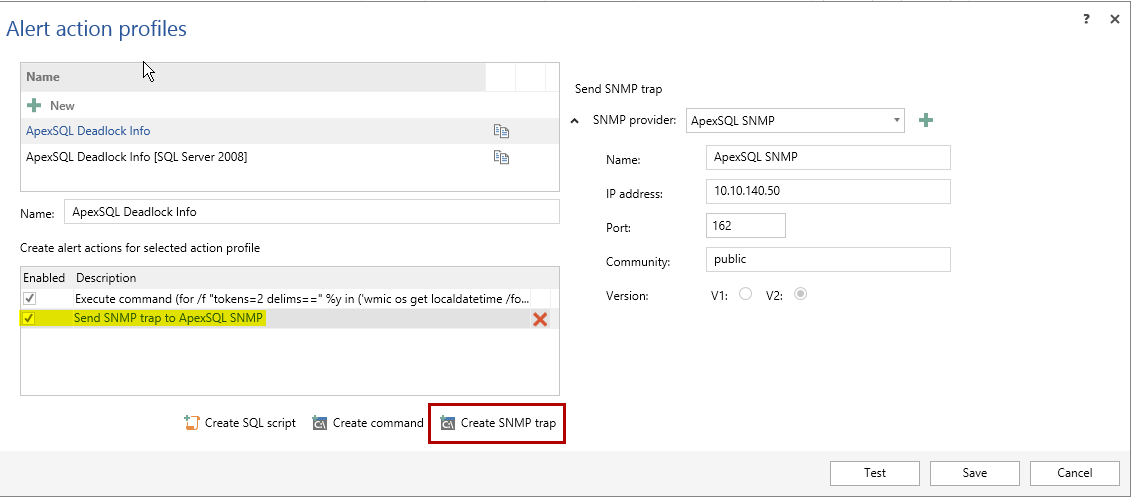
SNMP notifications
The new version includes Simple Network Management Protocol (SNMP) notifications on alerts, to ensure notifications for LAN users
Redesigned custom metrics
Custom metrics has been completely redesigned and significantly improved to ensure full flexibility for creating desired metrics. Predefined Windows OS system metrics that are not part of the original system metrics set can be now added to be monitored
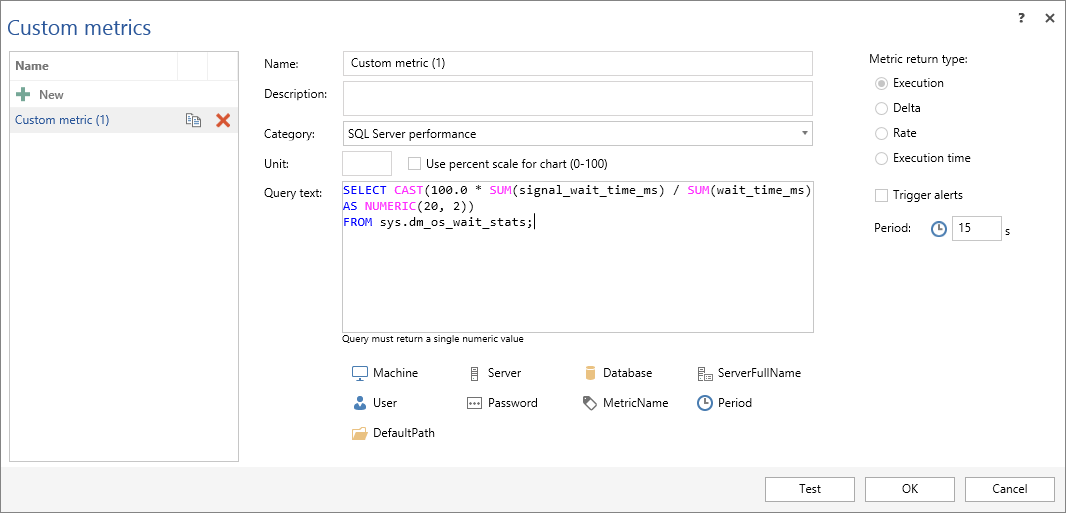
More details about this with some useful custom metrics examples can be found in the Using custom SQL performance counters to monitor SQL Server article
August 16, 2016


