


We have been working on bug fixes, performance and usability improvements. Also, we have introduced some new features such as different chart’s time range intervals, along with a built-in Query execution plan viewer, Reporting, ability to define users and their privileges and support for SQL Server AlwaysOn availability groups
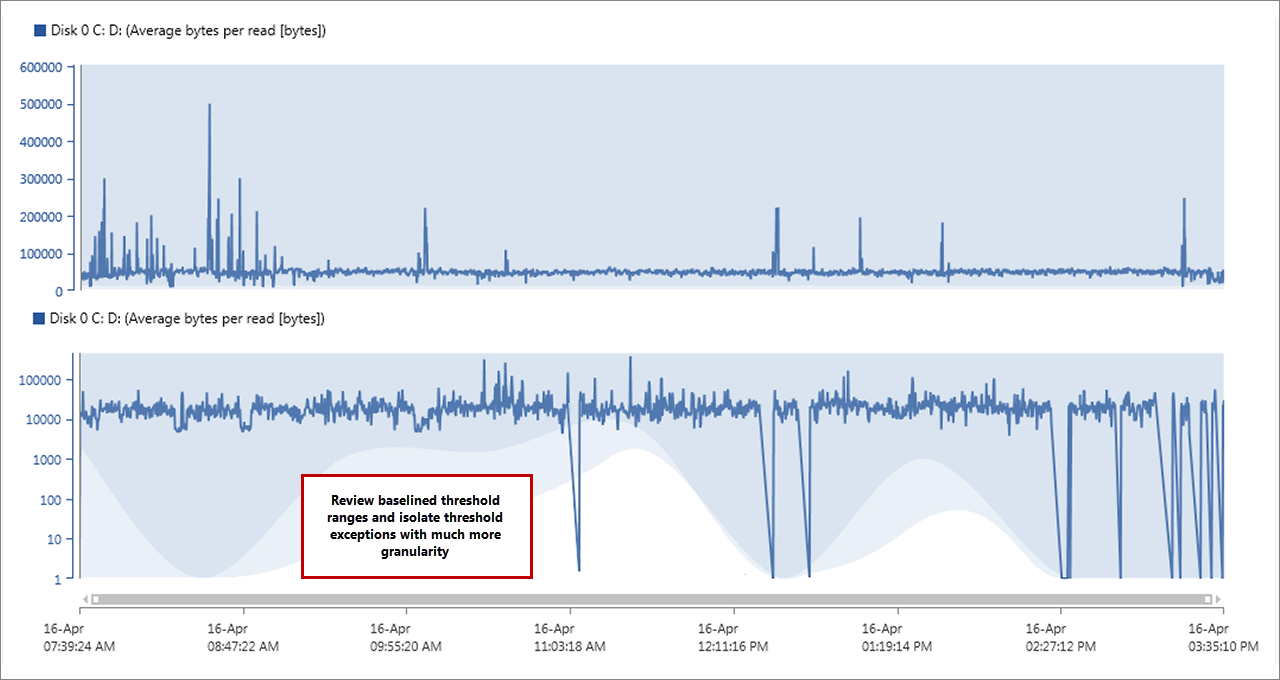
Beside these improvements and new features in ApexSQL Monitor R3, the baseline visual presentation is improved allowing display of the medium and high thresholds areas. Also, logarithmic scale for y-axis is introduced to ensure better display of the most critical areas in charts where higher values are better and large data ranges are present
We are also working on different performance and usability improvements for ApexSQL Monitor R4
-
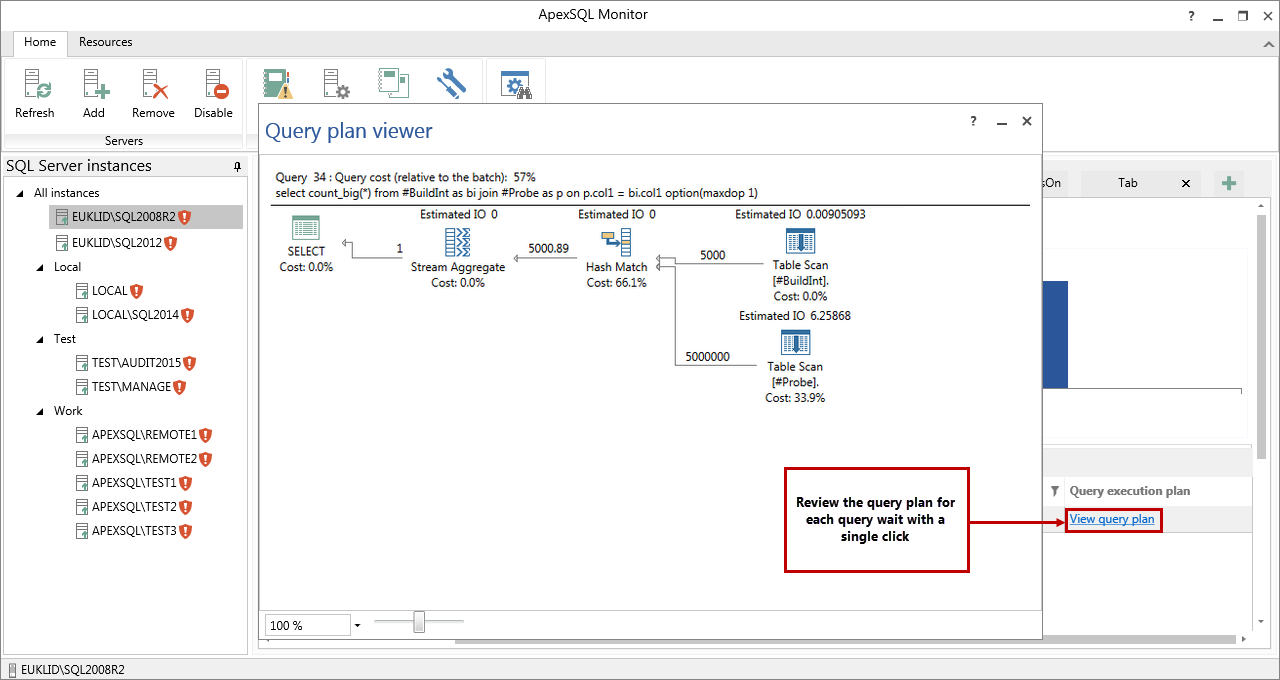
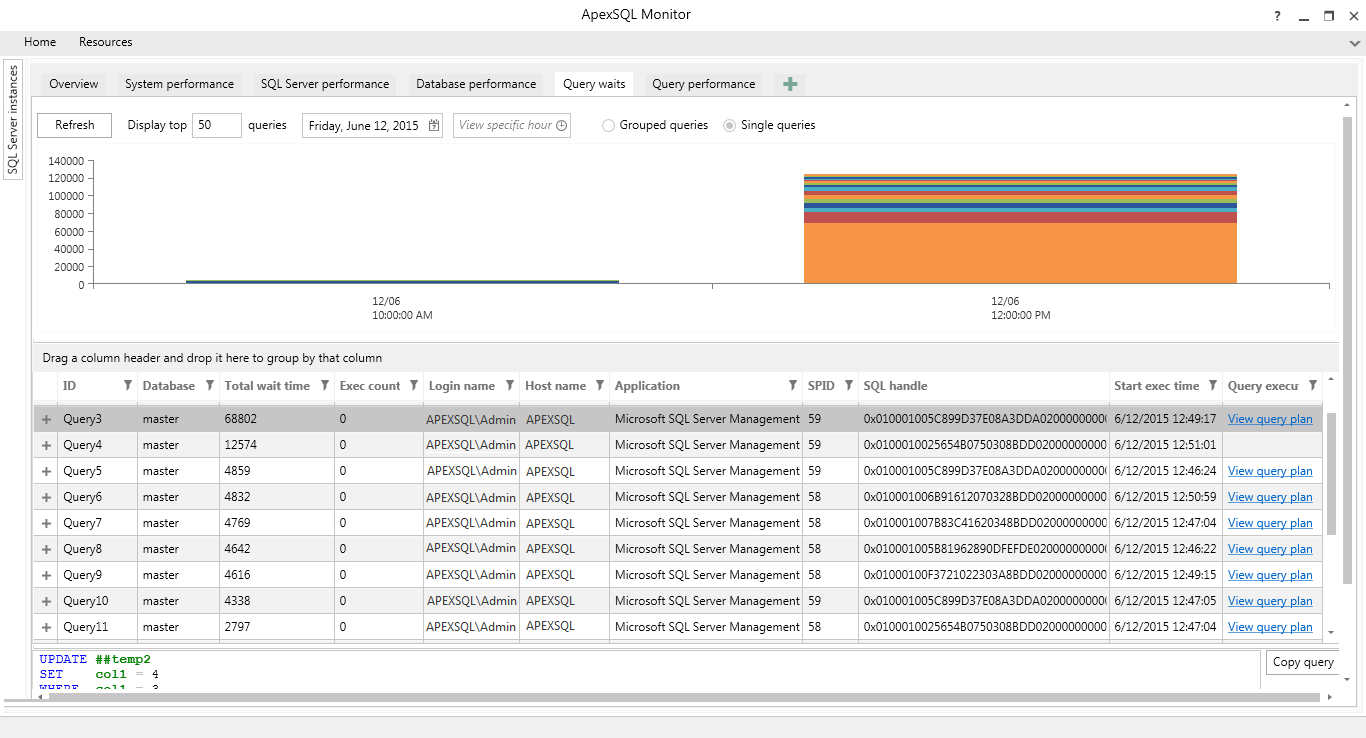
Query plans can be now examined in built-in query execution plan viewer to enable deeper analysis of problematic queries. Learn more
-
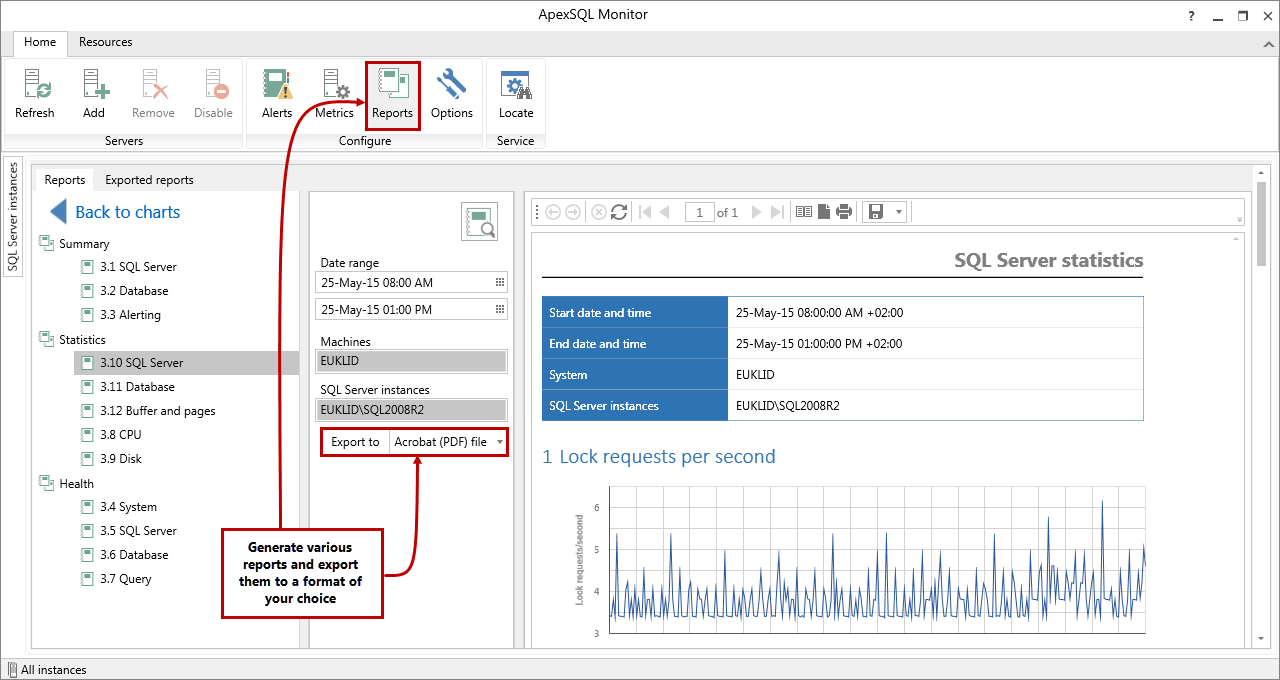
Now various performance reports can be generated and exported to desired file type. Learn more
-
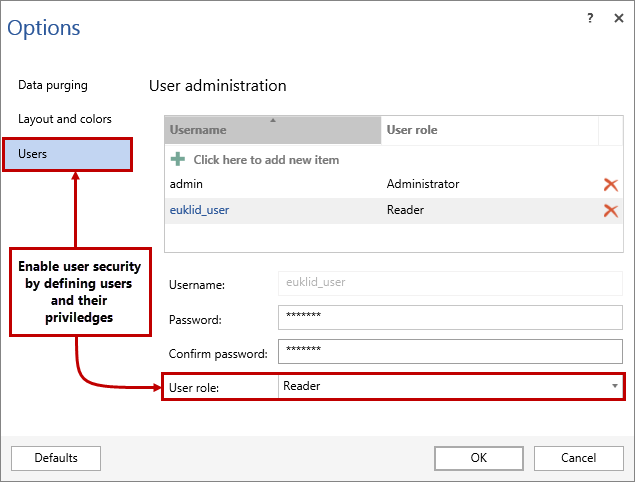
Now different users can be defined with privileges assigned to selected role
-
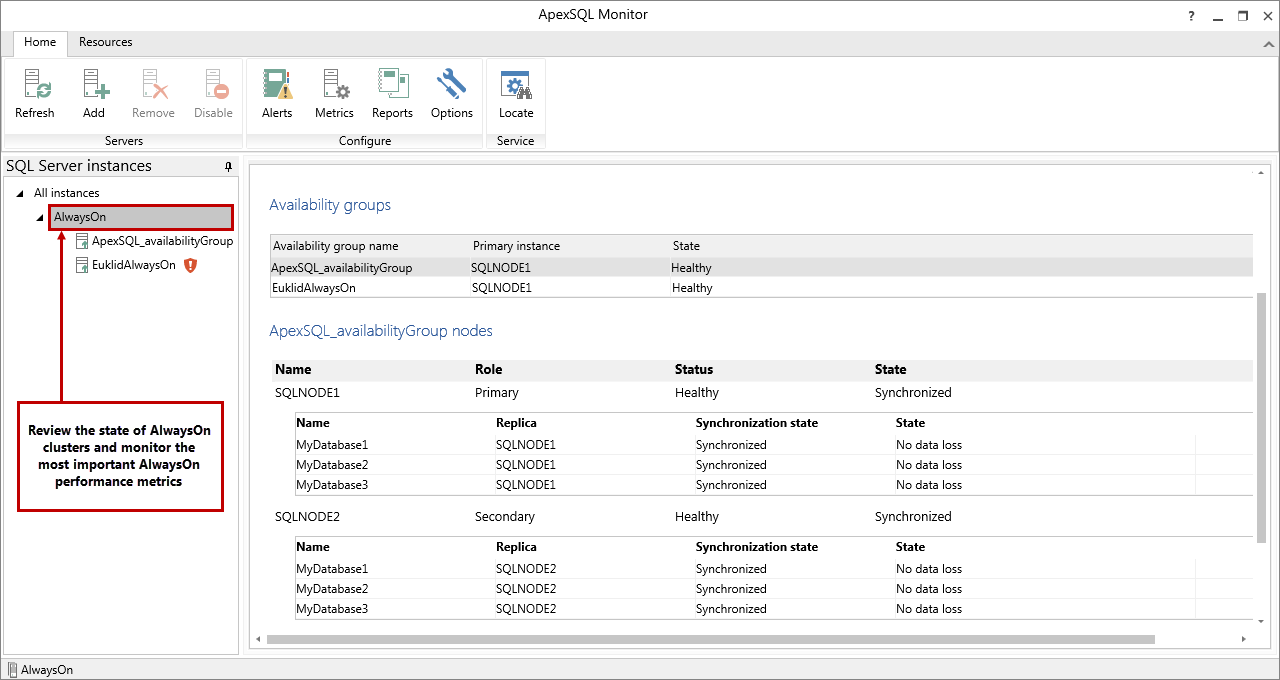
SQL Server AlwaysOn availability group can now be added for monitoring. Multiple AlwaysOn availability group performance metrics, as well as group and node states can be monitored
-
With improved base lining (learn more) and logarithmic y axis scale (learn more), the metric measured values can be easily examined and compared with calculated baseline values and high or medium threshold areas
-
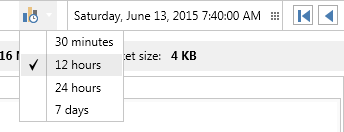
Besides the 30 minute chart interval, new 12 and 24 hours and 7 days chart intervals have been introduced
-
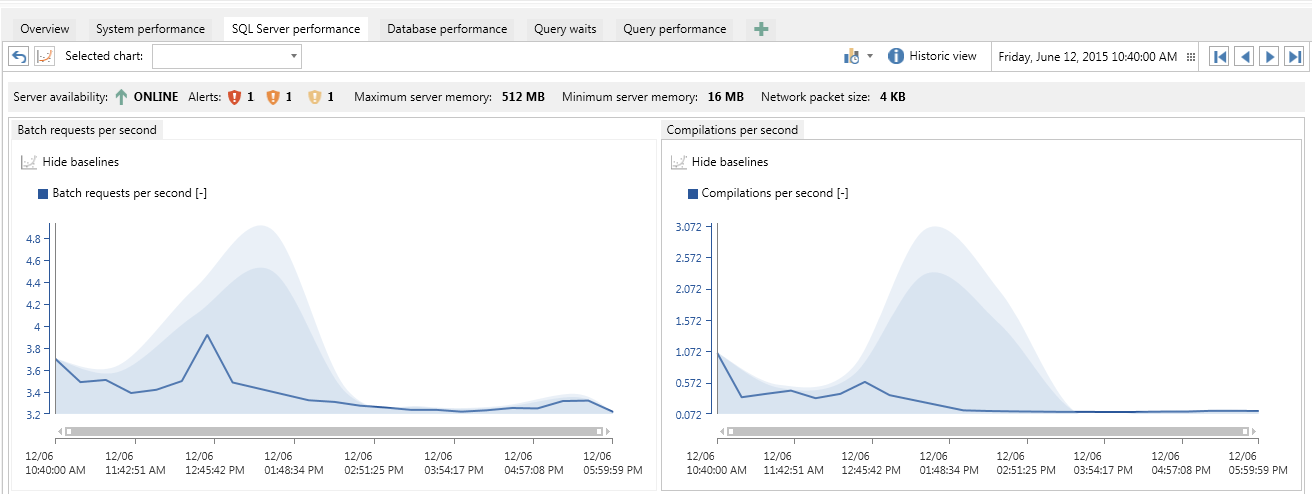
Charts will be easier to analyze, with more charts presented in the same row by default:
-
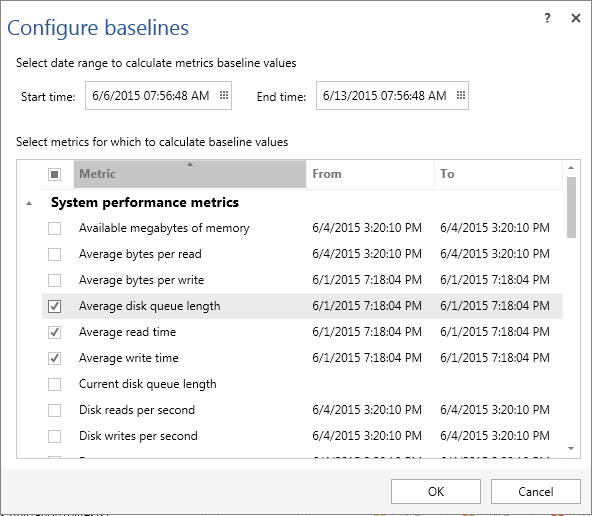
Instead of creating baselines for all SQL Server metrics, the Configure baselines dialog now contains metrics list to allow users to more granularly calculate baselines only for selected metrics for the desired date range:
-
Single query execution over time analysis will be added to the Query waits view
- Add instance for monitoring using different windows credentials – Monitor SQL Servers by specifying different windows account
- Query waits alerting – In case query waits are larger than predefined threshold, alert will be created
- Single query analytics – Perform detailed query analysis, detect high resources usage, costly nodes, parallelism
- Full SQL Server cluster support – Monitoring AlwaysOn and Failover most important performance metrics
- Custom system performance metrics – Add and customize system performance metrics
- Automatic baseline calculation – Dynamically calculate baseline values for the last seven days of collected data
- Baseline thresholds adjustments – After calculating baseline values and metric thresholds based on standard deviation, manually fine tune different thresholds for desired time
- VM monitoring – HyperV and/or VMware performance metrics
- Blocking queries – Easily identify and analyze blocking queries
- Query performance history – Collect and store query performance in the ApexSQL Monitor database repository to be able to analyze query details on request
- SQL Server 2016 support
- Custom defined alerts – Write user-specified queries to run against the monitored database or database repository
What is coming up in ApexSQL Monitor 2015 R4?
What is planned in the midterm?
ApexSQL Monitor 2015 R4 – Q3 2015:
ApexSQL Monitor 2015 R5 –Q4 2015:
ApexSQL Monitor 2016 – Q1 2016:
June 24, 2015


