Previously, we explained changes related to ApexSQL Log server side components and installation process. Now we’ll take a look at the Project interface and performance improvements
An optimized Project interface
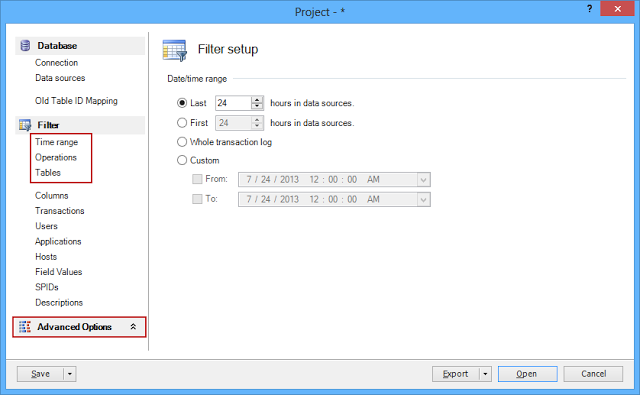
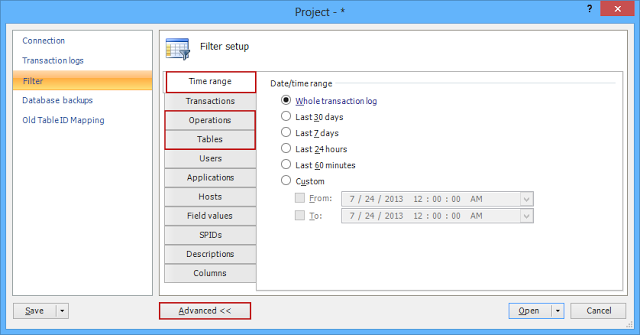
The Project interface is redesigned to provide an easier access to all commonly used options in a single click. The commonly used options, such as Time range, Operations and Tables filter are no longer hidden as sub-tabs in the Filter tab. Also, the Advanced options button is moved from the bottom of the Project dialog to the basic options list
ApexSQL Log 2013 Project dialog
ApexSQL Log 2011 Project dialog
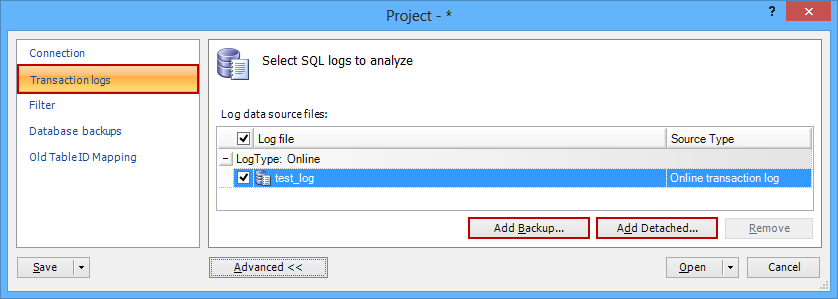
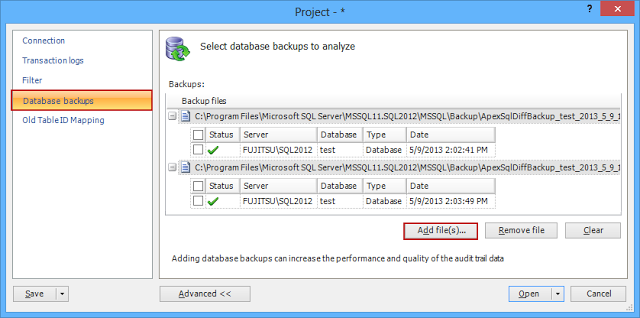
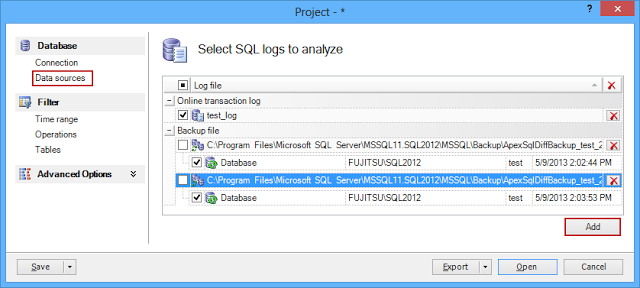
Adding additional data sources (transaction log and database backups, and detached transaction logs) is simplified. To complete this operation, in ApexSQL Log 2011, the user had to choose from 2 tabs and three buttons. The user also had to make sure not to mix file types and add, for example, a database backup using the option for adding transaction log backups, as the database backup would not be read then. In ApexSQL Log 2013, all data sources are added with a single button
ApexSQL Log 2011 – adding transaction logs
ApexSQL Log 2011 – adding database backups
ApexSQL Log 2013 – adding detached transaction logs, transaction log and database backups
A new time range filter
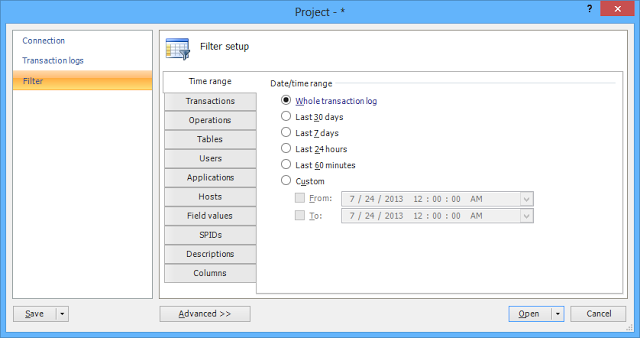
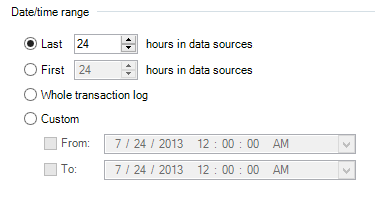
The time range filter is redesigned and new options introduced, as to make the most popular time range options available at a single click. The rarely used options (such as Last 30 days, Last 7 days and Last 60 minutes) have been removed. If these ranges are needed, they can be set via the custom time range option
ApexSQL Log 2011 – time range filter
ApexSQL Log 2013 – time range filter
Improved performance
It takes far less time for ApexSQL Log 2013 to read data sources and show them in the grid, due to significantly improved performance
See also:
ApexSQL Log 2013 sneak peek – Part 1
August 12, 2013


