


This article represents a screen shot tour of ApexSQL Monitor features with a brief description.
Contents
- Installation
- Main interface
- Dashboard
- System performance category
- SQL Server performance category
- Database performance category
- Waits stats performance category
- Index performance category
- Query waits performance category
- Query performance category
- Deadlocks
- Activity monitoring
- Alerts
- Reports
- Configuration/Settings
- Metric configuration page
- Baselines configuration page
- Devices configuration page
- Databases configuration page
- Indexes configuration page
- Deadlocks configuration page
- Queries configuration page
- Wait types configuration page
- Custom metrics configuration page
- Maintenance configuration page
- Alert actions configuration page
- Administration
- User profiles settings
- Email profiles settings
- SMTP settings
- SNMP settings
- Repository purging settings
- Layout settings
- Alerts settings
- Session settings
- Resources
Installation
Double click the installation exe file, which can be downloaded from the ApexSQL Download page.
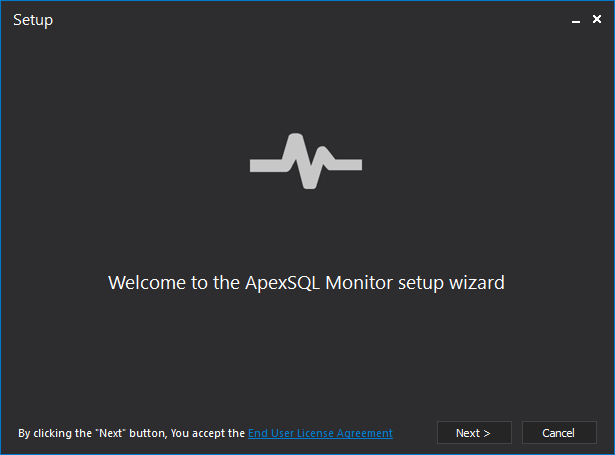
The Welcome dialog will appear:
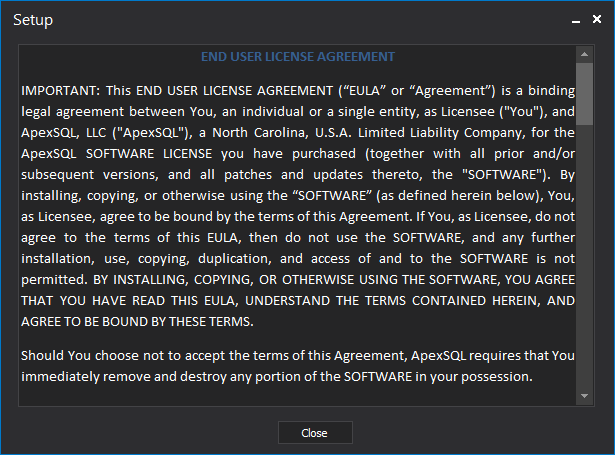
By clicking the End User License Agreement link on the Welcome dialog, users can review the ApexSQL LLC EULA:
In the next step, the location where, by default, the application will be installed is shown:
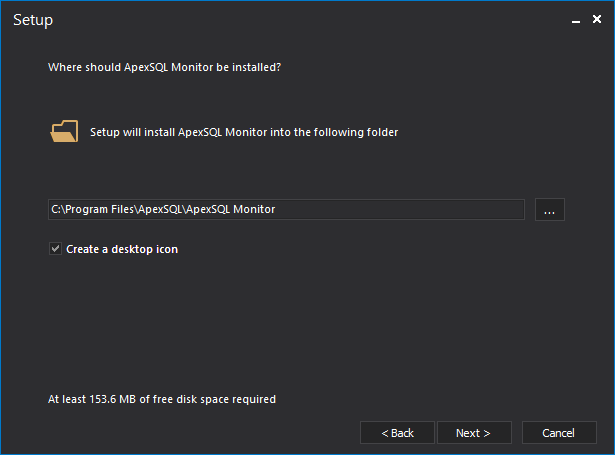
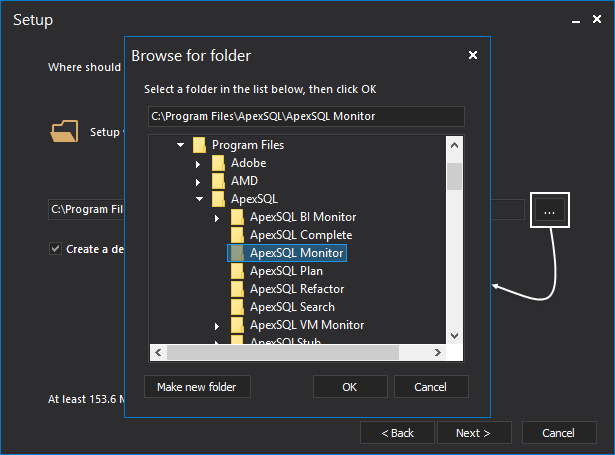
The location where the application should be installed can be changed by clicking the browser button:
Configuration
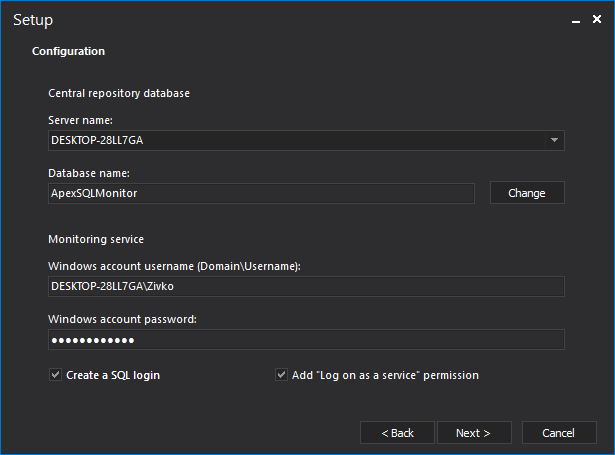
In the Configuration dialog, a user provides information which SQL Server instance will be used to host the central repository database. In the Monitoring service of the Configuration dialog, a user must provide the Windows account and the associated password that ApexSQL Monitor service will run under:
More about ApexSQL Monitor terms and definitions can be found on the ApexSQL Monitor installation terms, definitions, and network topography page.
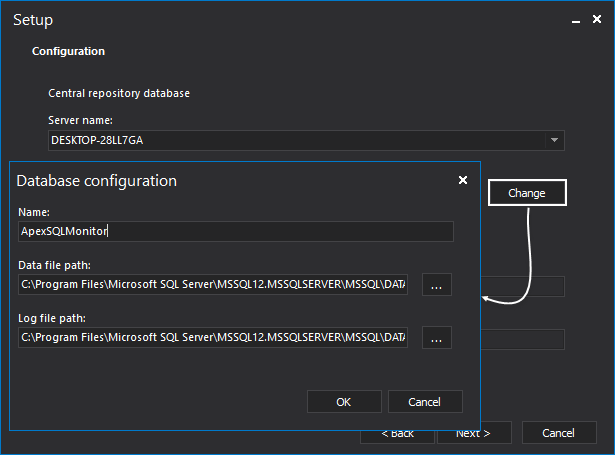
If a default repository database name should be changed or repository database data files should be stored on a drive different than the default SQL Server drive, on the Configuration dialog, click the Changes button:
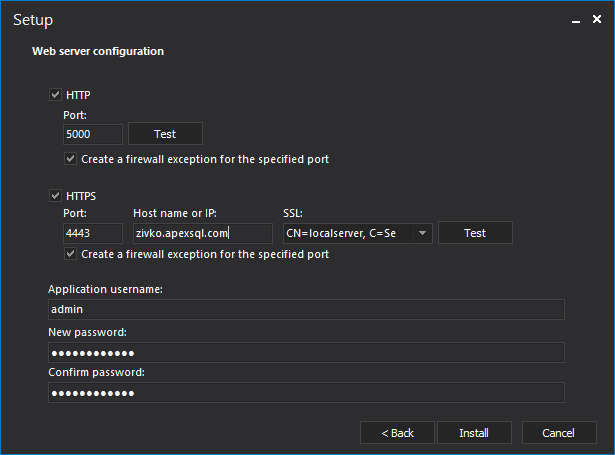
In the next step, the configuration for the web can be set. The HTTP protocol can be set, by default this option is checked and port 5000 is used. User can configure the secure HTTPS protocol for accessing the web server. Also, in this step, the application username and password need to be provided, which will be used for login on the ApexSQL Monitor web page:
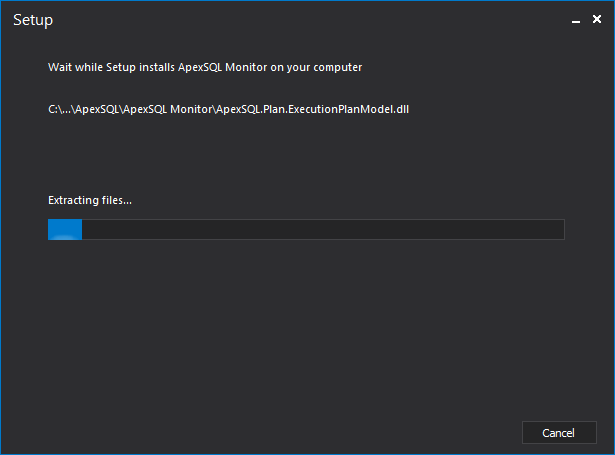
Press the Install button and wait until the installation process is finished:
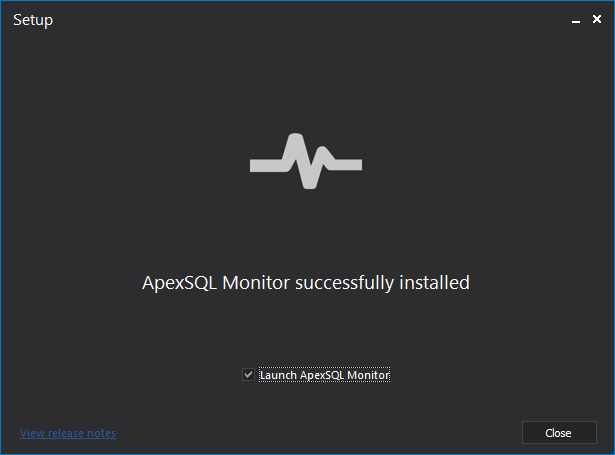
After finishing installation successfully, the confirmation dialog appears with an option to run application immediately after closing the installer:
The complete installation steps can be found on the Installing ApexSQL Monitor page.
Main interface
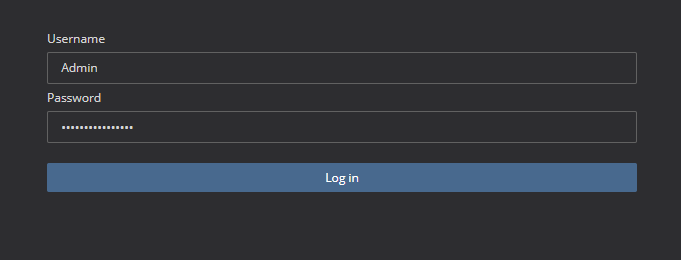
Login with application username and password:
Mani menu allows navigation to various application pages such as home, dashboard page, alerts review reporting, monitoring configuration, administration, resources and add instance page:

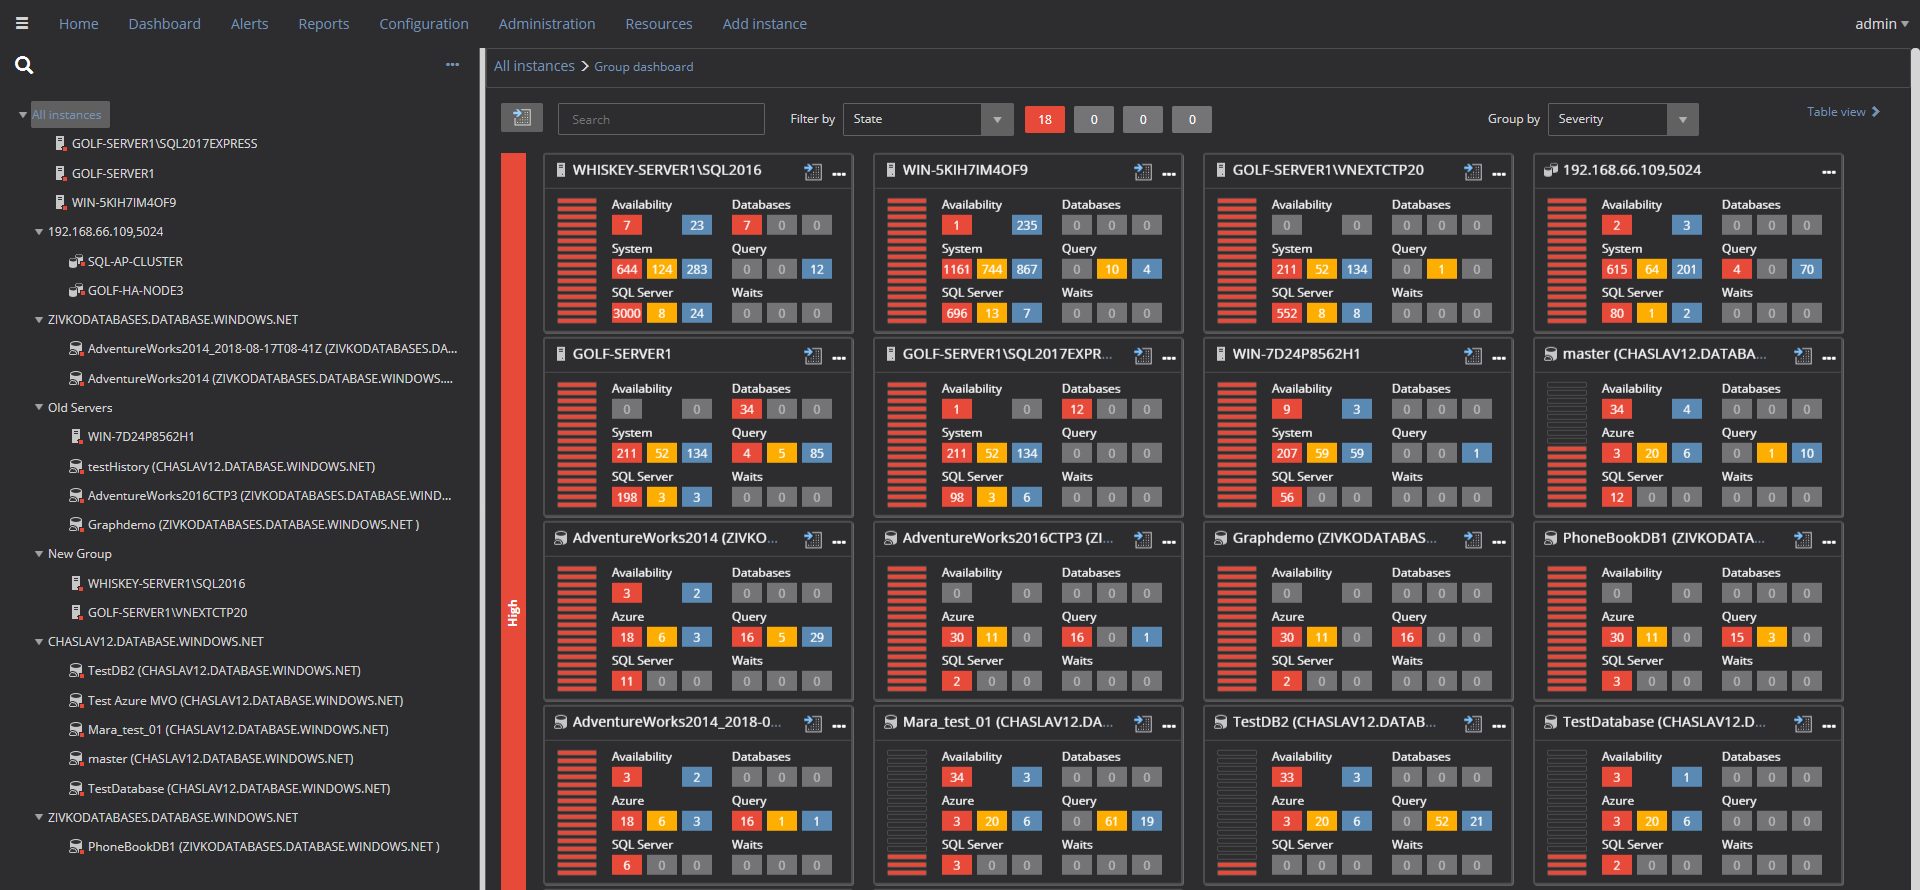
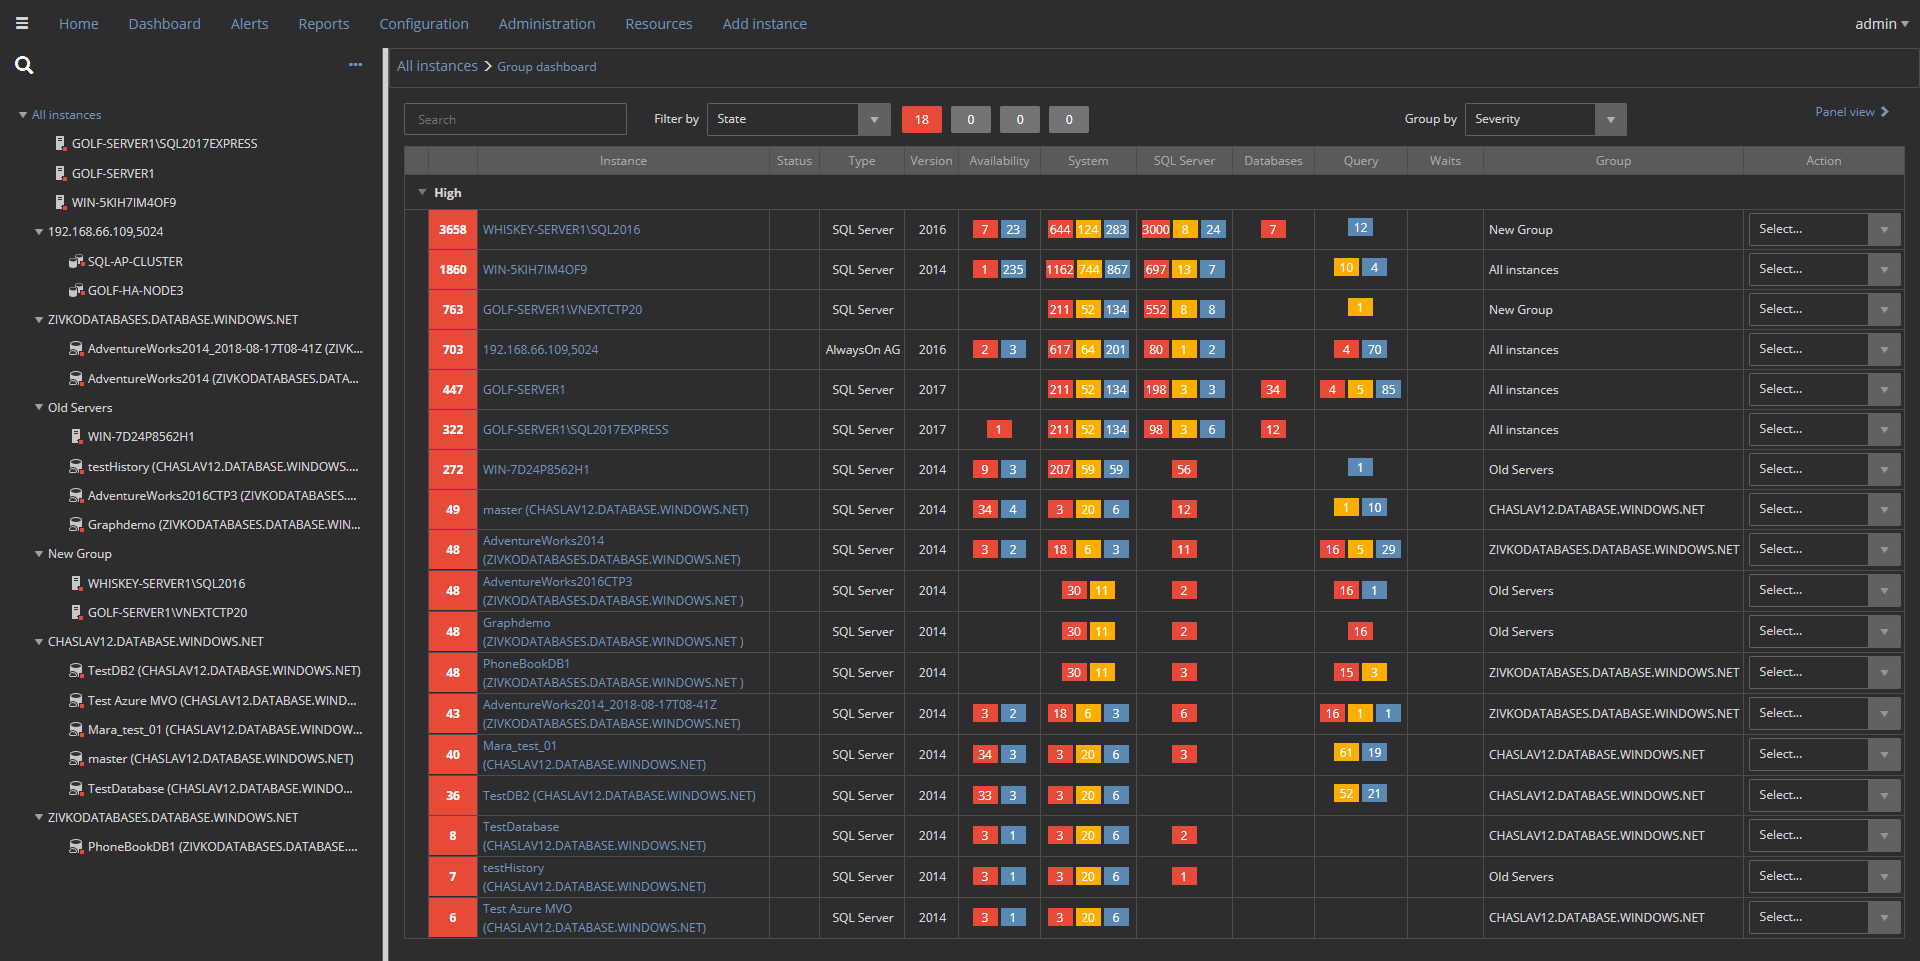
The default page that appears when starting ApexSQL Monitor is Home page. This page shows various information about monitoring instances. This page shows type, SQL Server version, status is it online or offline, global alerts info for availability, system, SQL Servers, queries, waits, etc.:
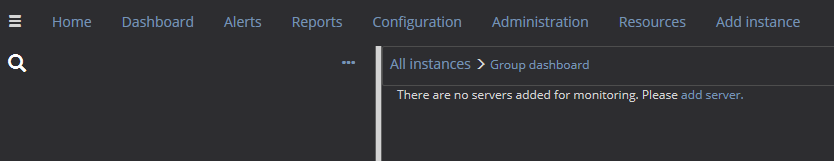
For newly installed ApexSQL Monitor application on the Group dashboard, the link to add server will appear:
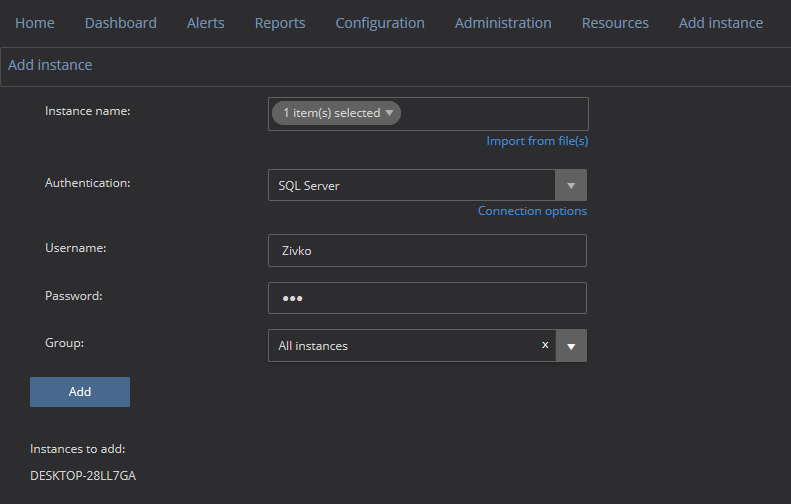
In the Add instance page, from the Instance name drop down box, select or type the SQL Server instance name and provide login credentials. Click the Add button to add SQL instances to monitoring:
More information about how to add SQL Server can be found on the How to add servers to ApexSQL Monitor page.
The default view on the Group dashboard page is the panel view, but it can be changed to a table-based view:
Navigation
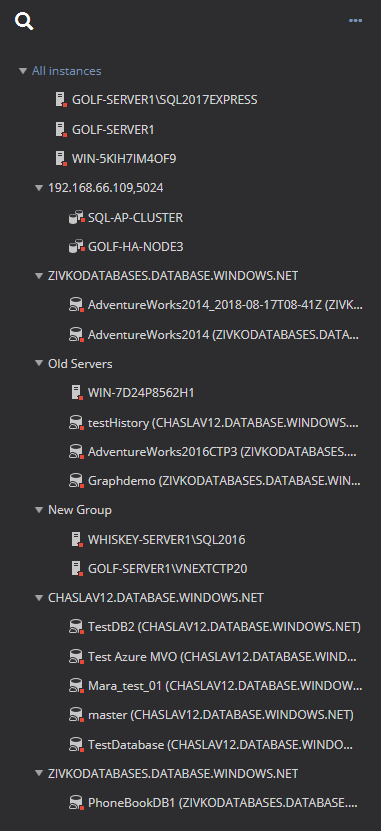
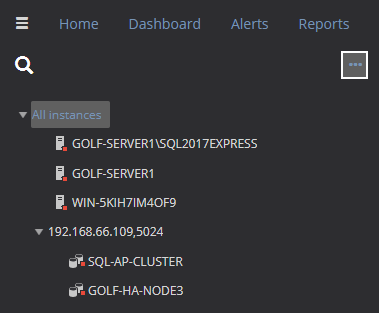
The tree view allows to easy view monitored instances, basic information on their status:
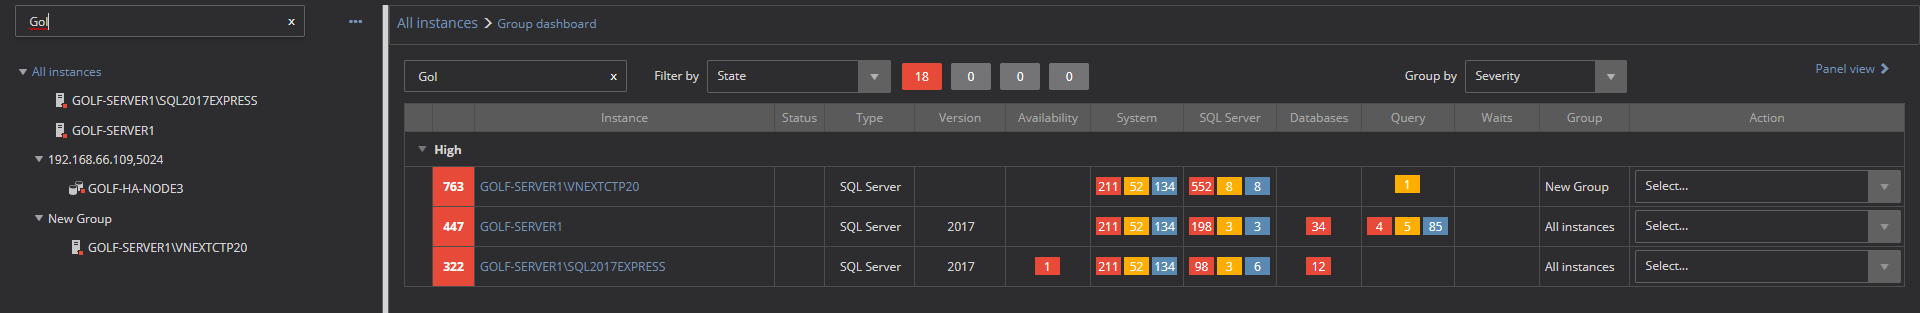
A quick search of the monitored SQL Server instances is available for easier handling of situations where a large number of SQL Server instances are monitored:
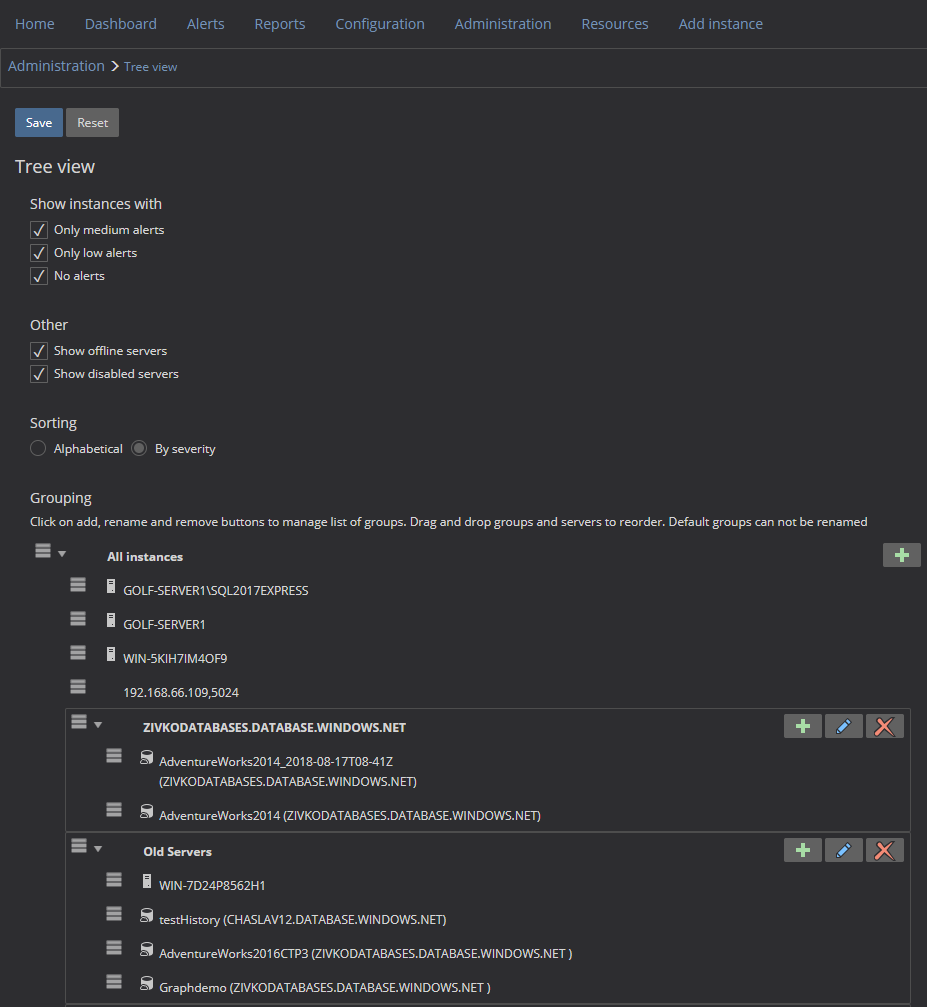
The tree view can be configured/modified by selecting the ellipsis button:
Monitored SQL Servers can be grouped together to allow applying the same alert configuration settings to them more easily. Additionally, the grouping capability helps group servers based on the business process supported and facilitates the prioritization of alerts:
For more information about grouping monitored SQL Servers visit the Organizing monitored servers into groups page.
Dashboard
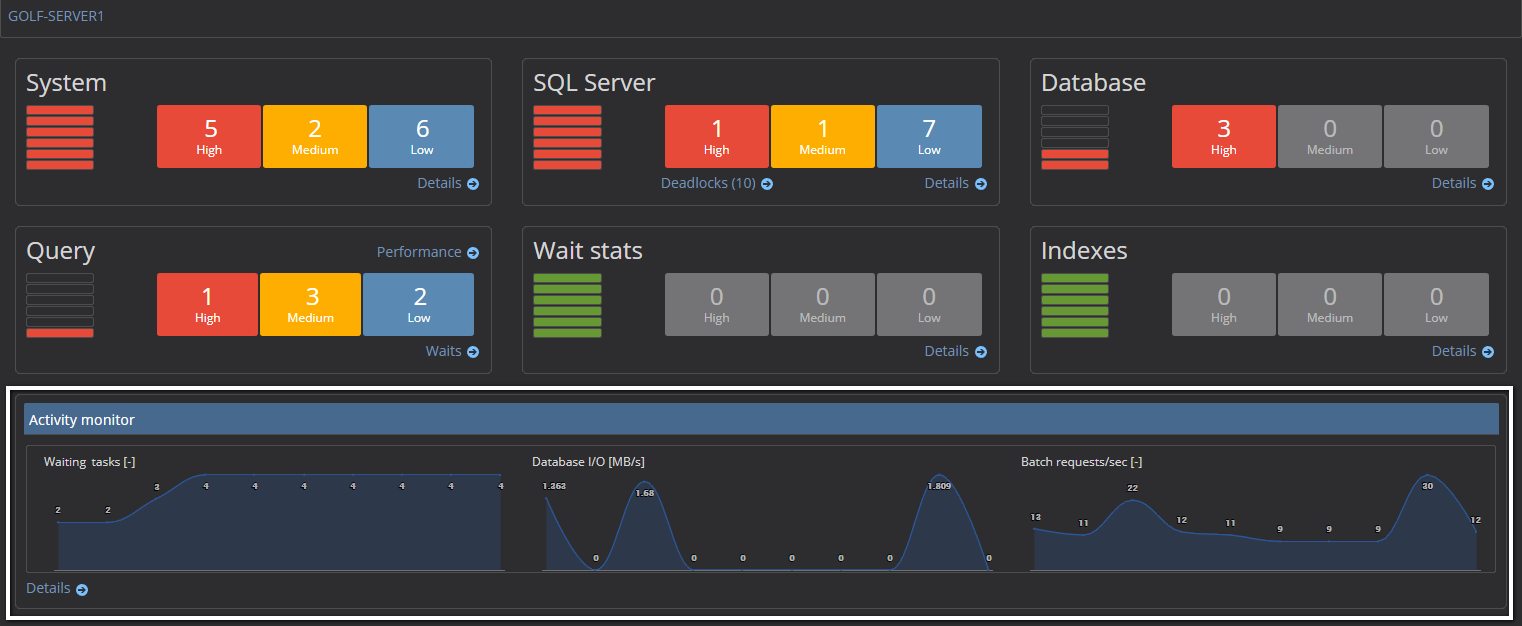
The Dashboard page shows various information about a selected SQL Server instance. Beside general information about selected SQL Server instance, hosting system and instance availability, the dashboard shows information about alerts that occurred, severity, where alerts occurred, a number of alerts that are triggered for the practical category:
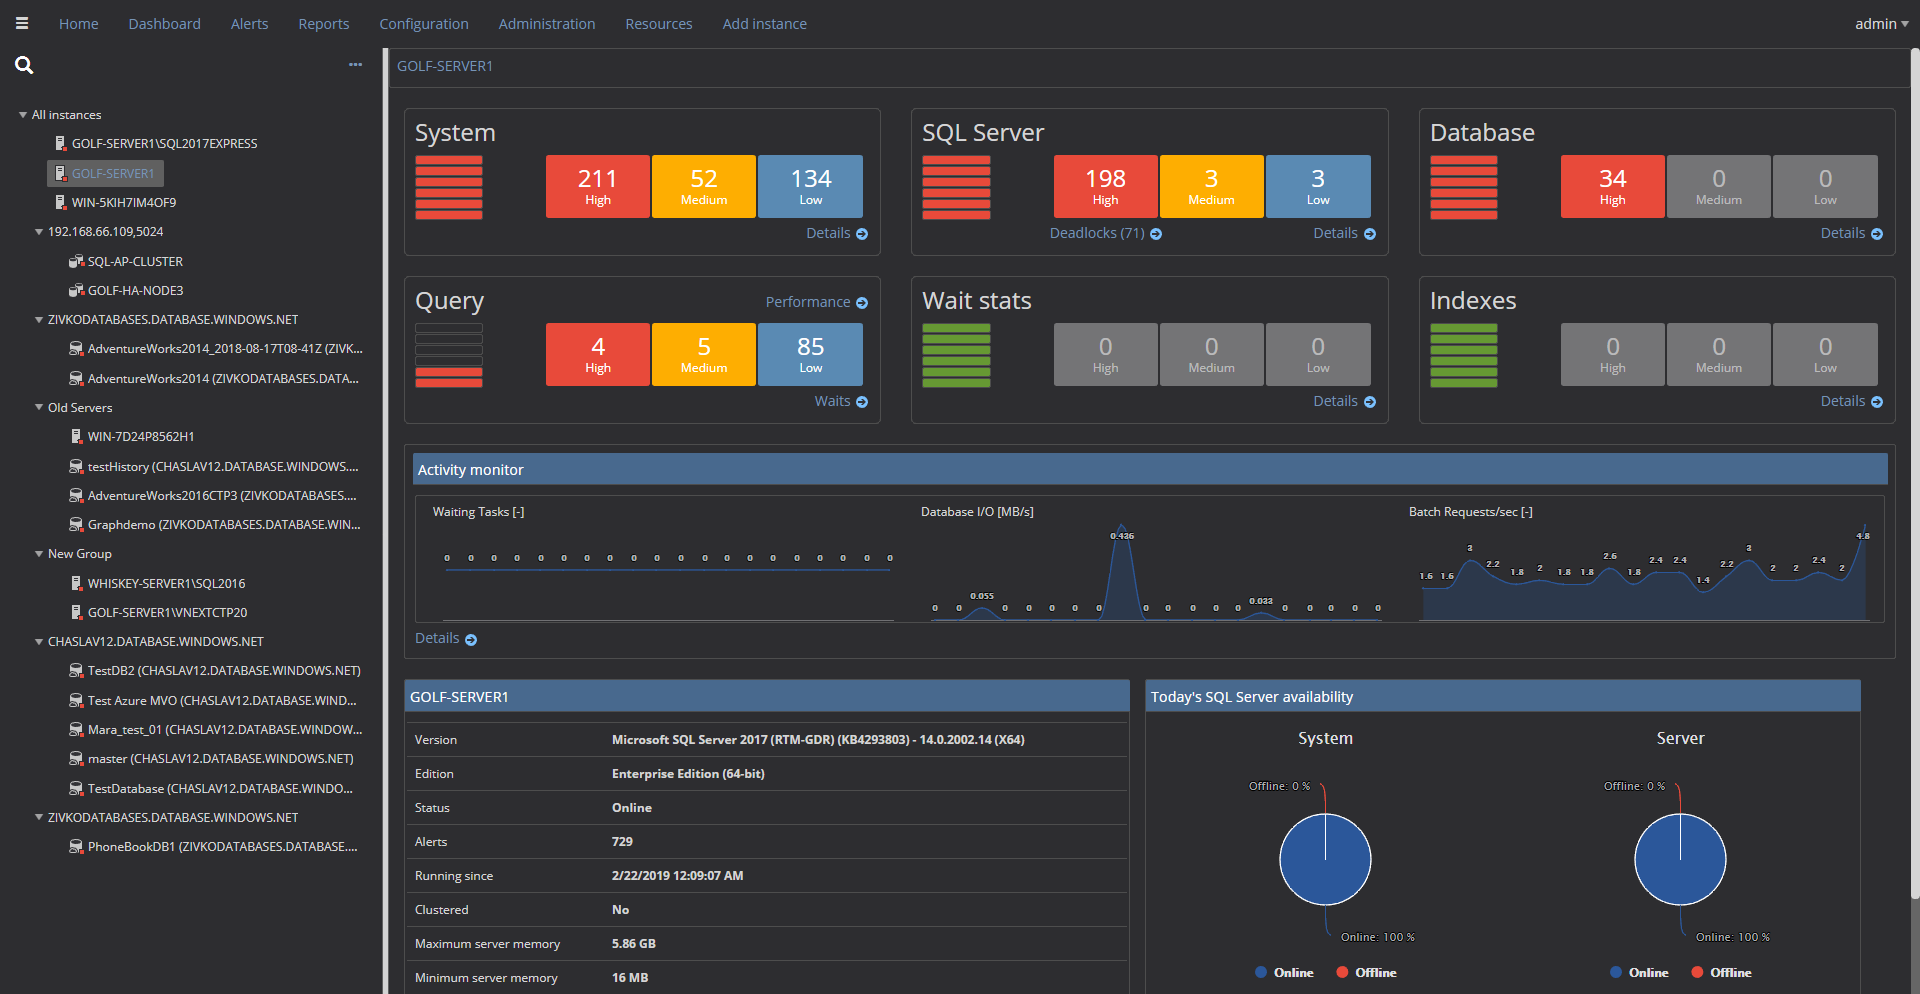
Also, on the instance dashboard, a real-time monitoring Waiting Tasks, Database I/O [MB/s], Batch requests/sec. charts are shown:
On the instance dashboard, the Details links are shown. They lead to various performance pages where useful performance information for each performance category can be get.
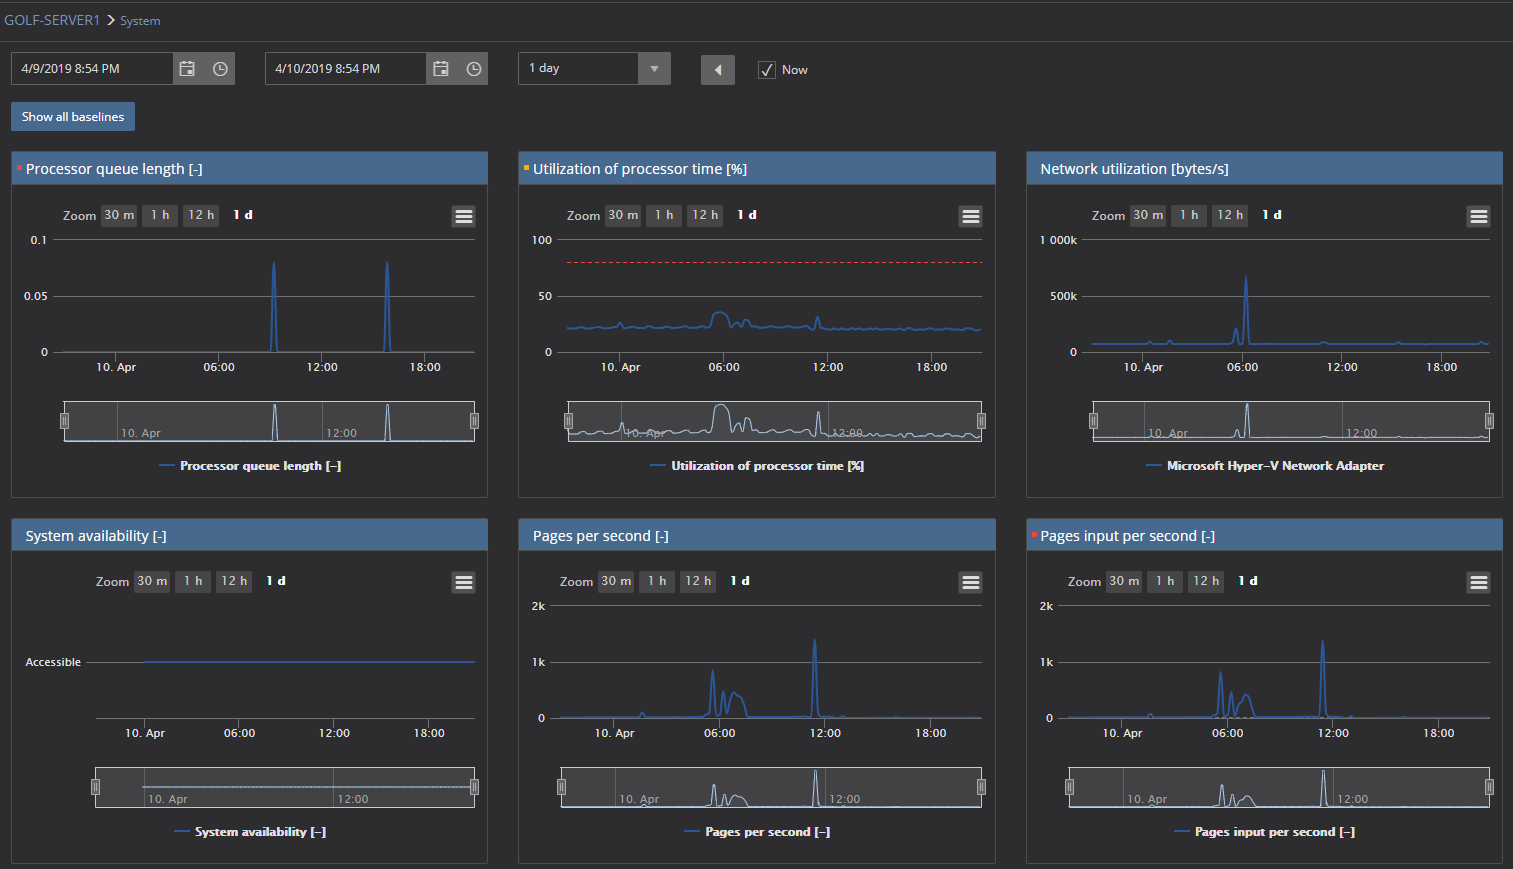
System performance category
Displays Windows OS metrics of the selected instance that hosts the monitored SQL Server. The default set of performance metrics are:
- pages input per second,
- processor queue length,
- free space,
- utilization of processor time,
- network utilization,
- paging file usage,
- pages per second,
- average bytes per reading,
- average bytes per write,
- average disk queue length,
- current disk queue length,
- average read time,
- average write time,
- disk reads per second,
- disk writes per second,
- system availability,
- available megabytes of memory
Periods of 30 minutes, 1 hour, 12 hours, 1 day and 7 days can be displayed in the charts:
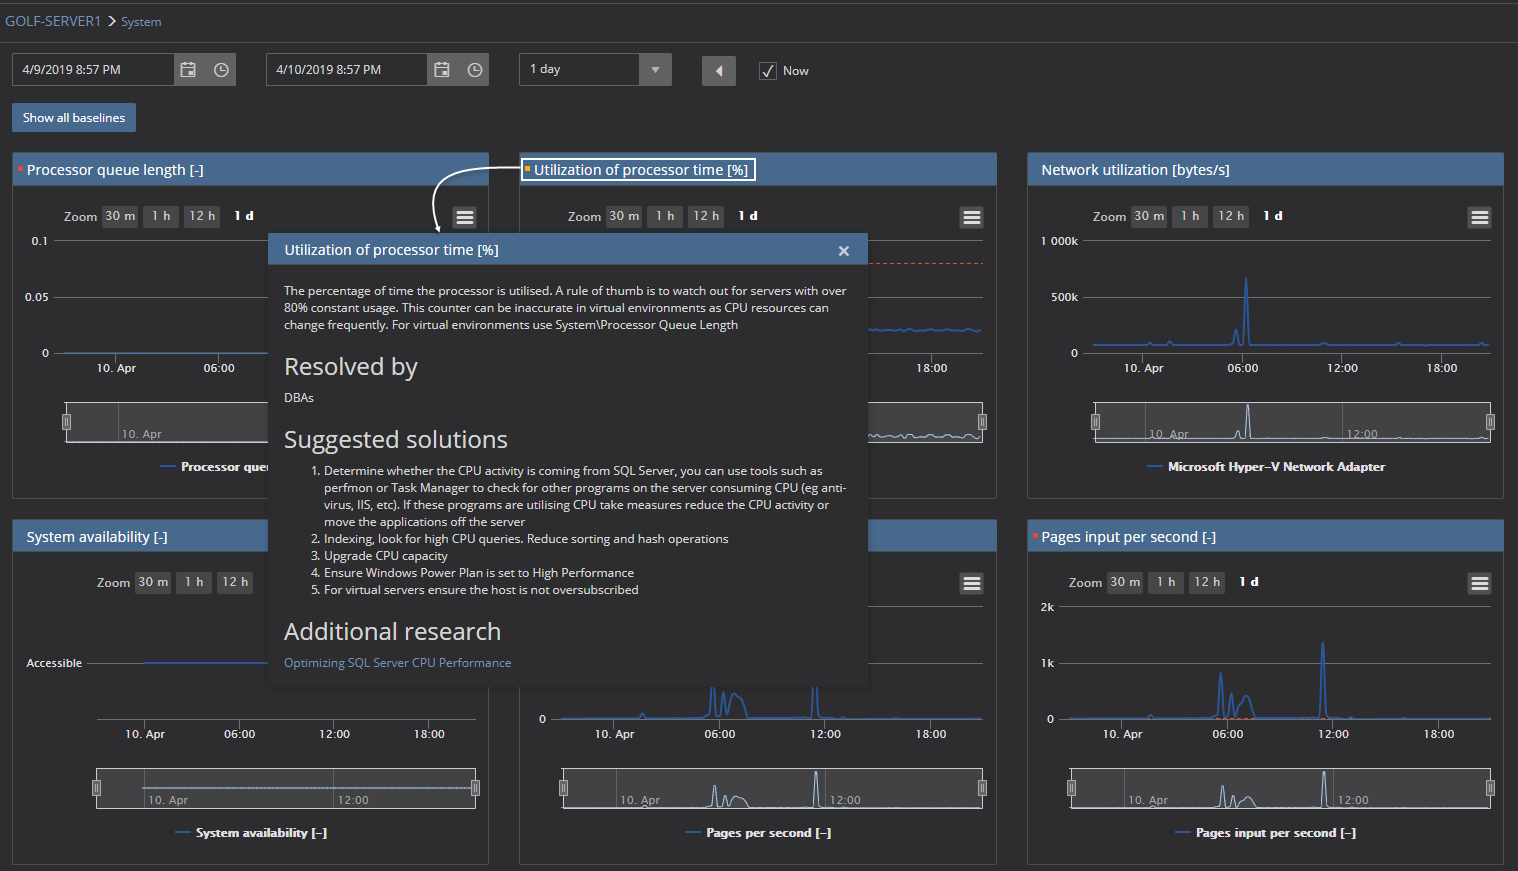
Clicking on the chart title displays a popup window with information for that metric, resolution guide and additional information for the given performance metric:
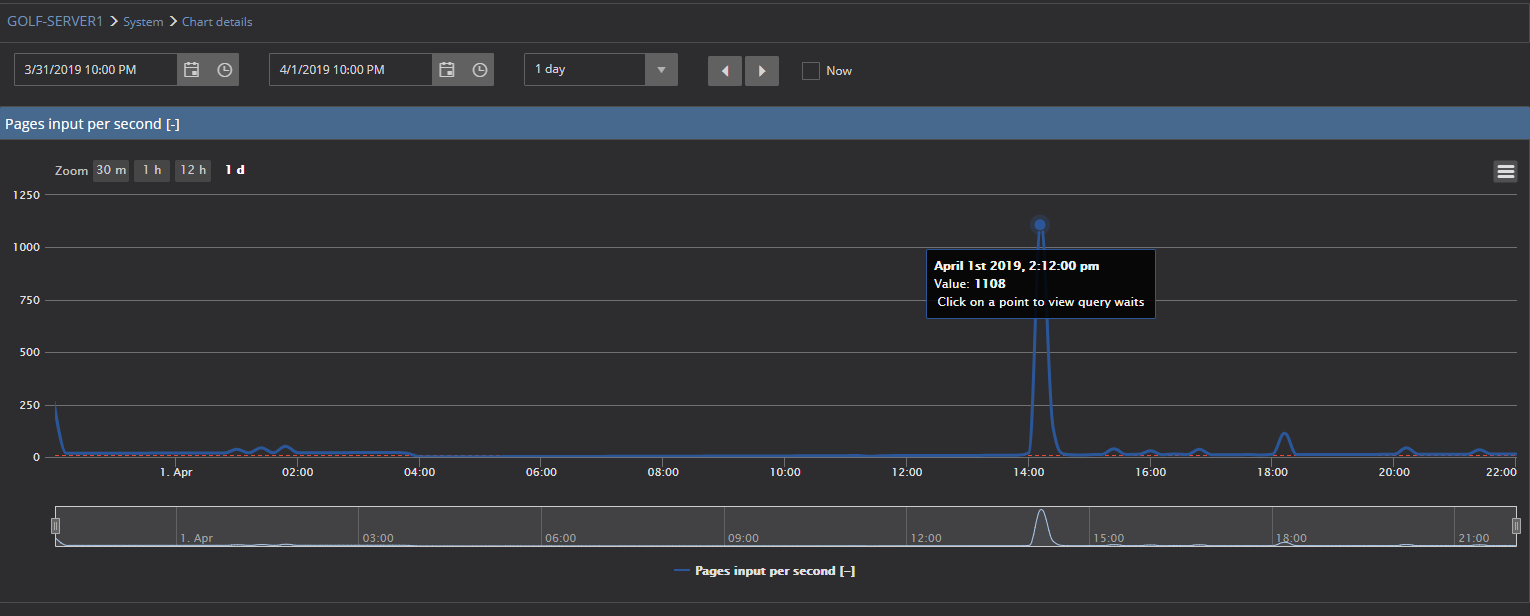
Click in the chart, e.g. Pages input per second [-], will open the chart in full-page size enabling the review of performance metric data much straightforward:
SQL Server performance category
The SQL Server performance page displays performance metrics on the SQL Server instance level. There are numerous numbers of metrics for monitoring SQL Server performance including Batch request per second, Buffer cache hit ratio, Page reads per second, SQL Server agent status, etc.:
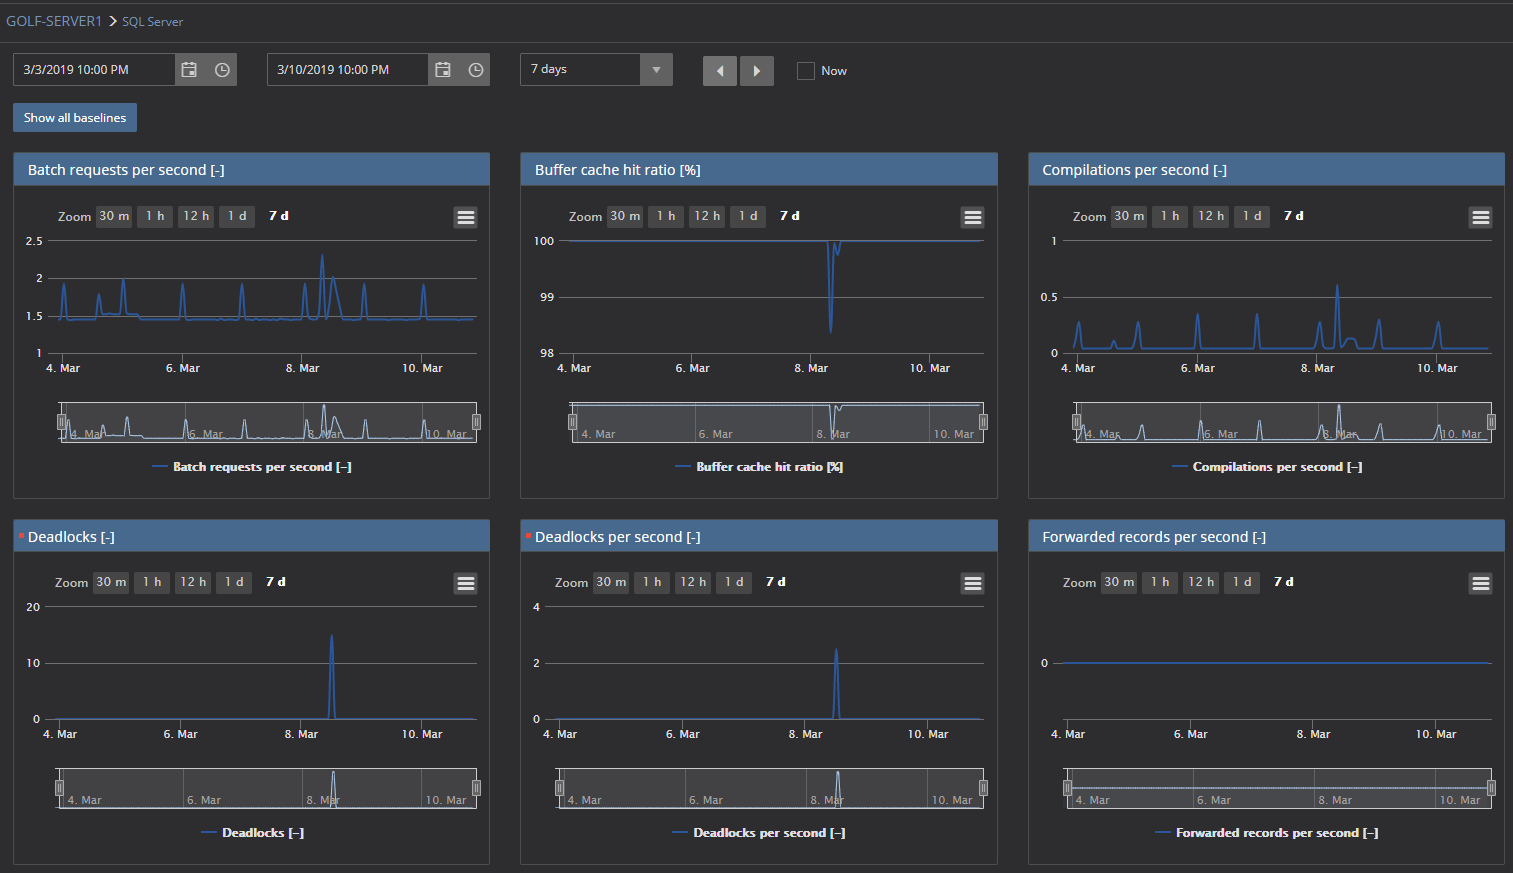
The same options for the SQL Server performance page are available as for the System performance page.
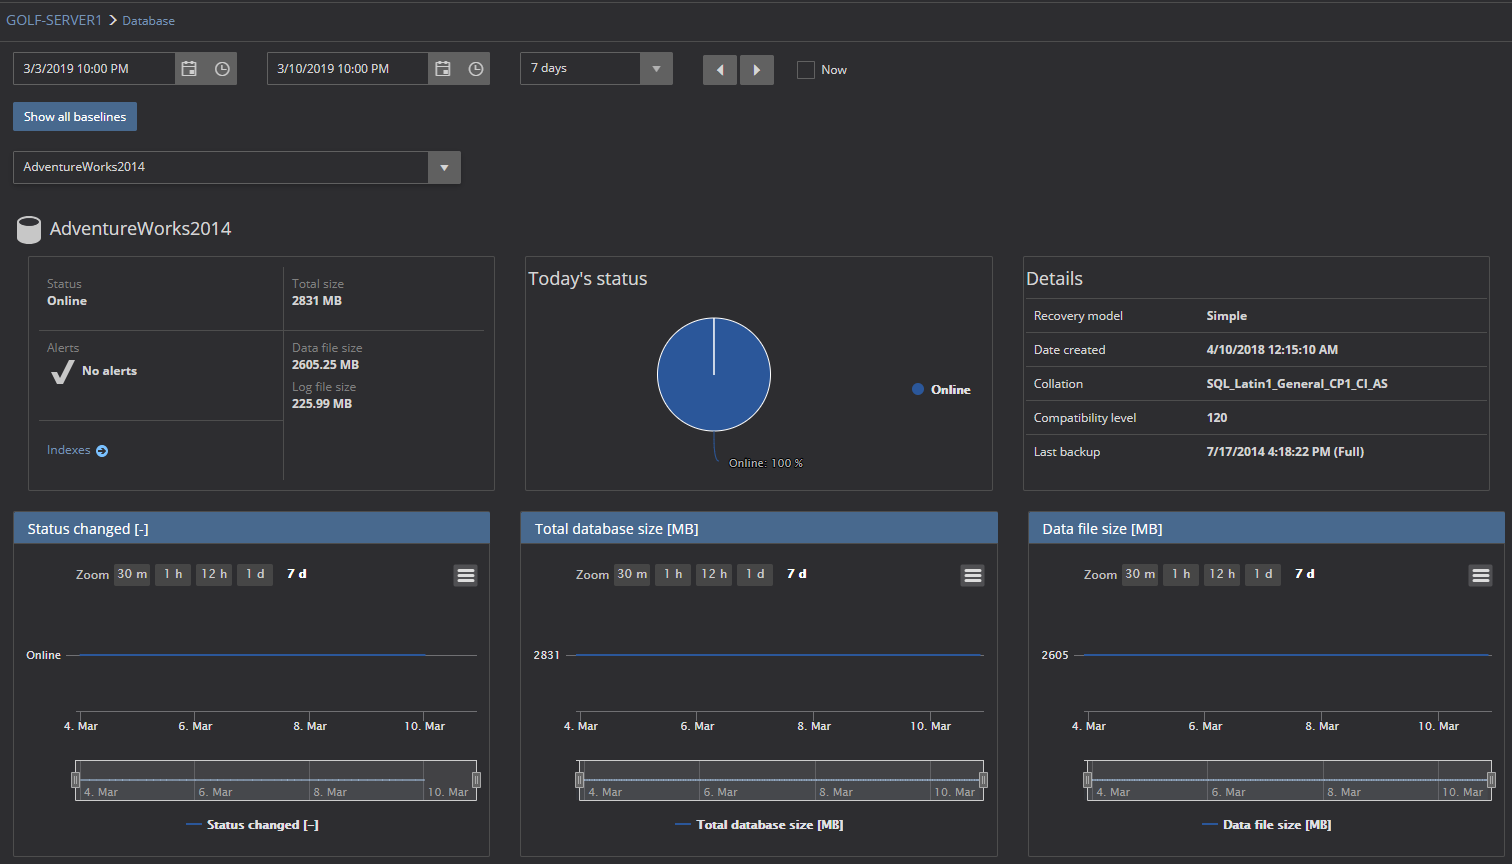
Database performance category
The Database performance page displays performance metrics for the databases under the monitored SQL Server instance:
Waits stats performance category
Under the Waits stats performance page, a user can review collected wait statistics including detailed information on the top 5 wait stats categories to quickly identify performance issues and bottlenecks:

Index performance category
Under the Index performance page, a user can monitor database index and analyze index performance for indexes larger than the size specified by user:
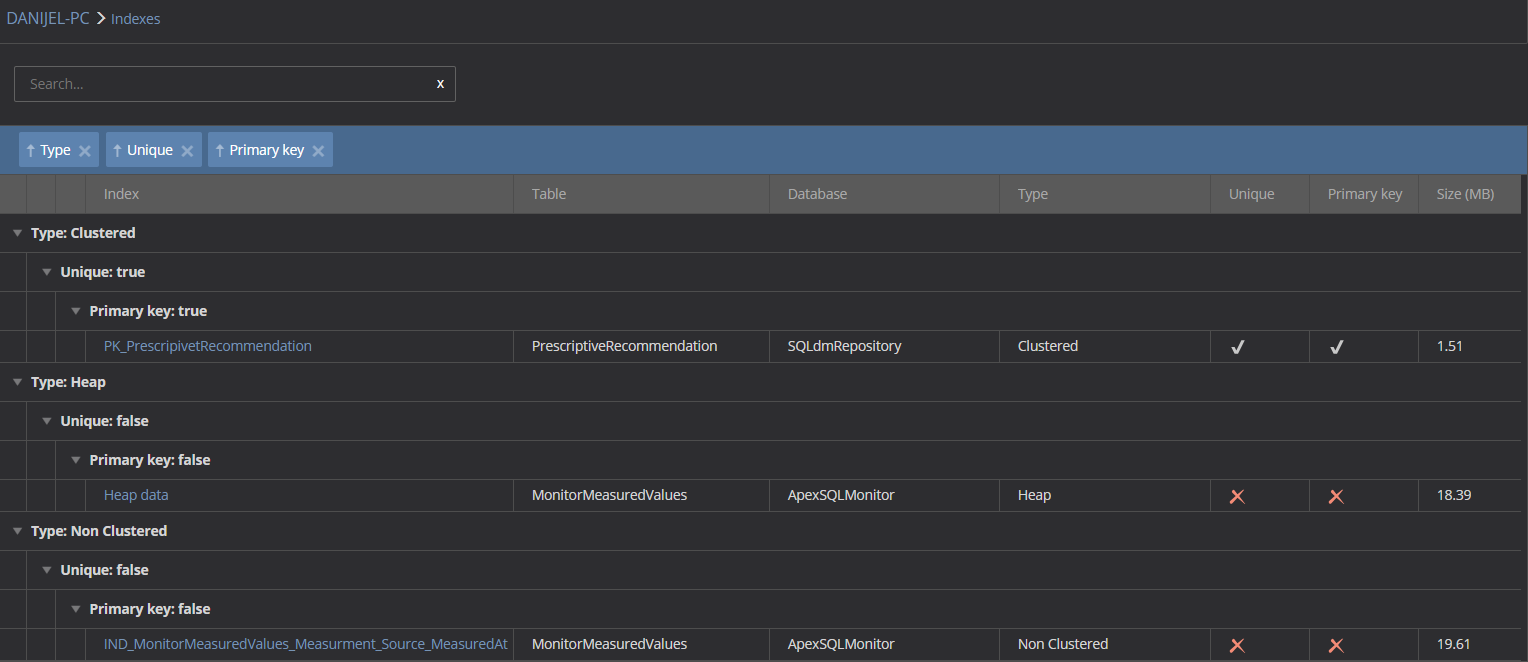
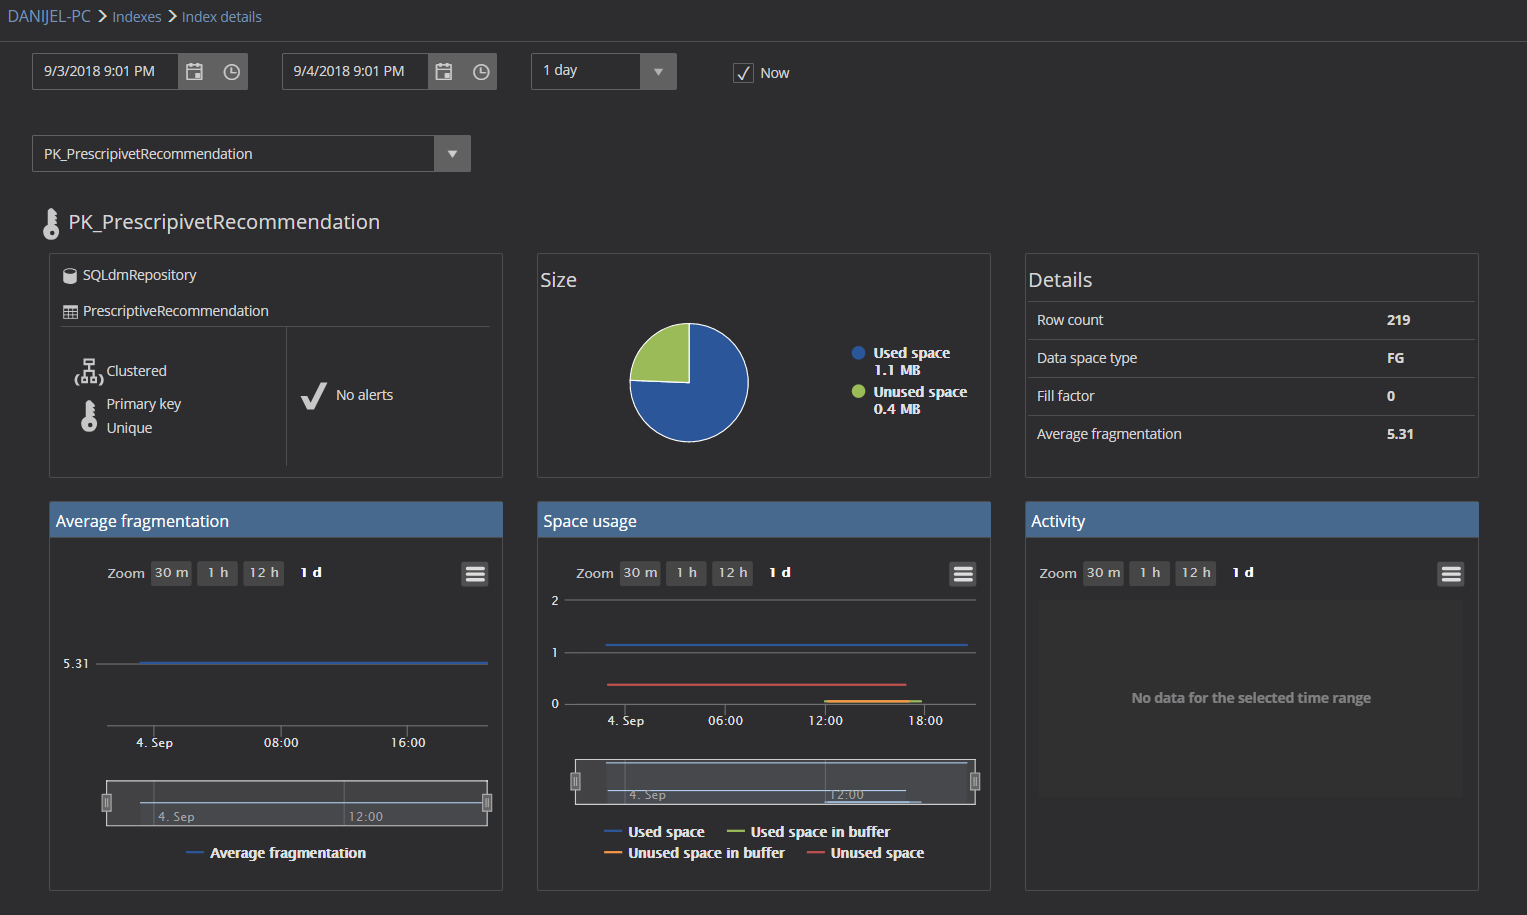
Clicking on the name of any index will open the index details page and shows information for that index in more details:
More can be found on the How to Detect SQL Server Performance Issues Caused by Incorrect Clustered Indexes page
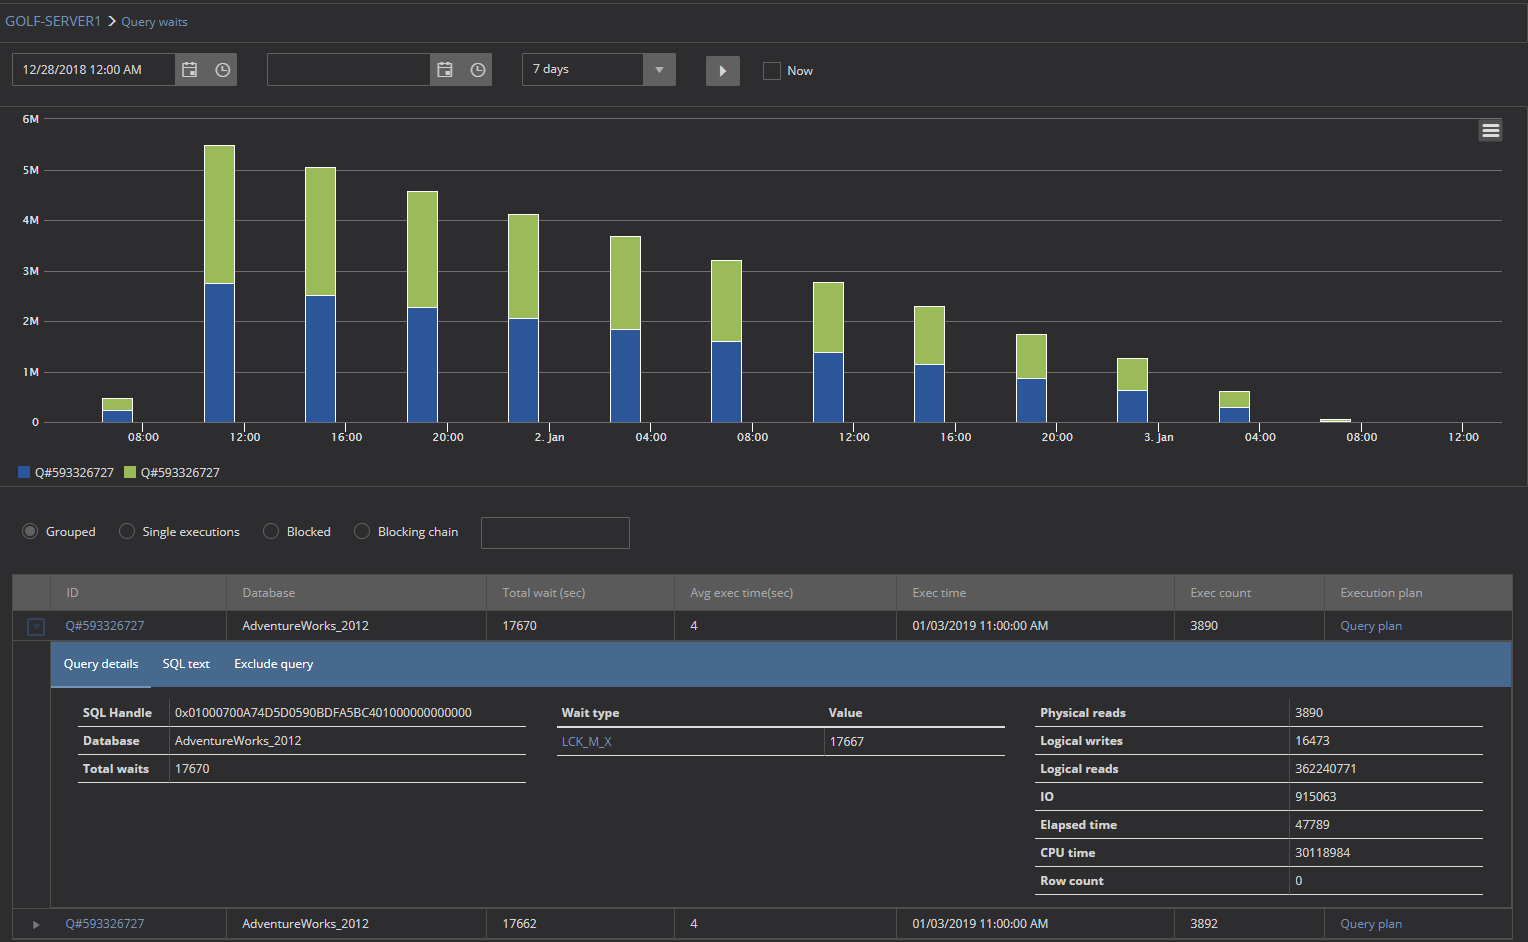
Query waits performance category
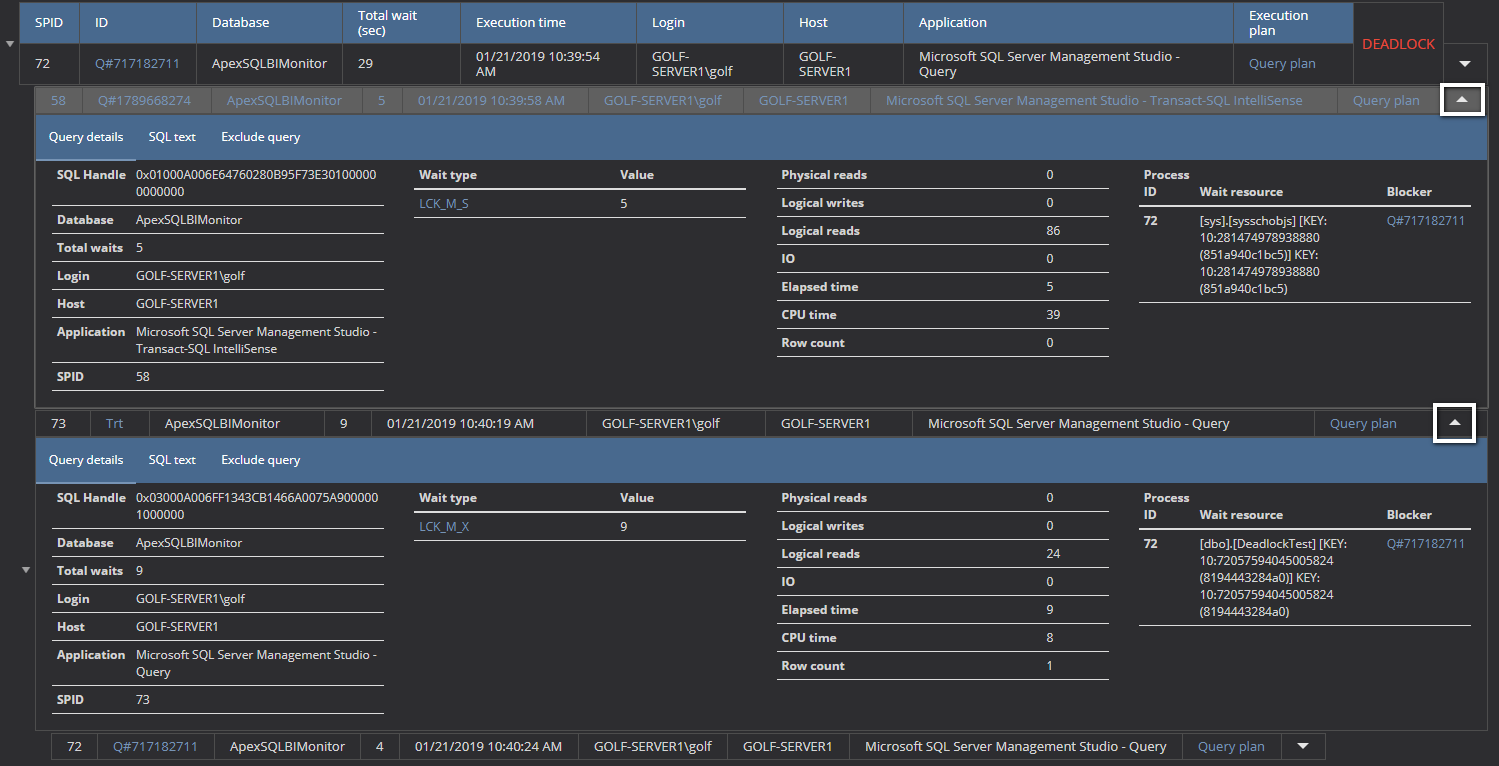
The Query waits performance page shows captured query wait times for individual and blocking queries. The user can review query performance history as well:
More about the Query waits performance can be found on the Using the query waits feature page.
By clicking the Blocking chain radio button in the Query waits page, the relations between all blocked and blockers SPIDs in a hierarchical form will be displayed:
See the SQL blocking chains in SQL Server page for more details.
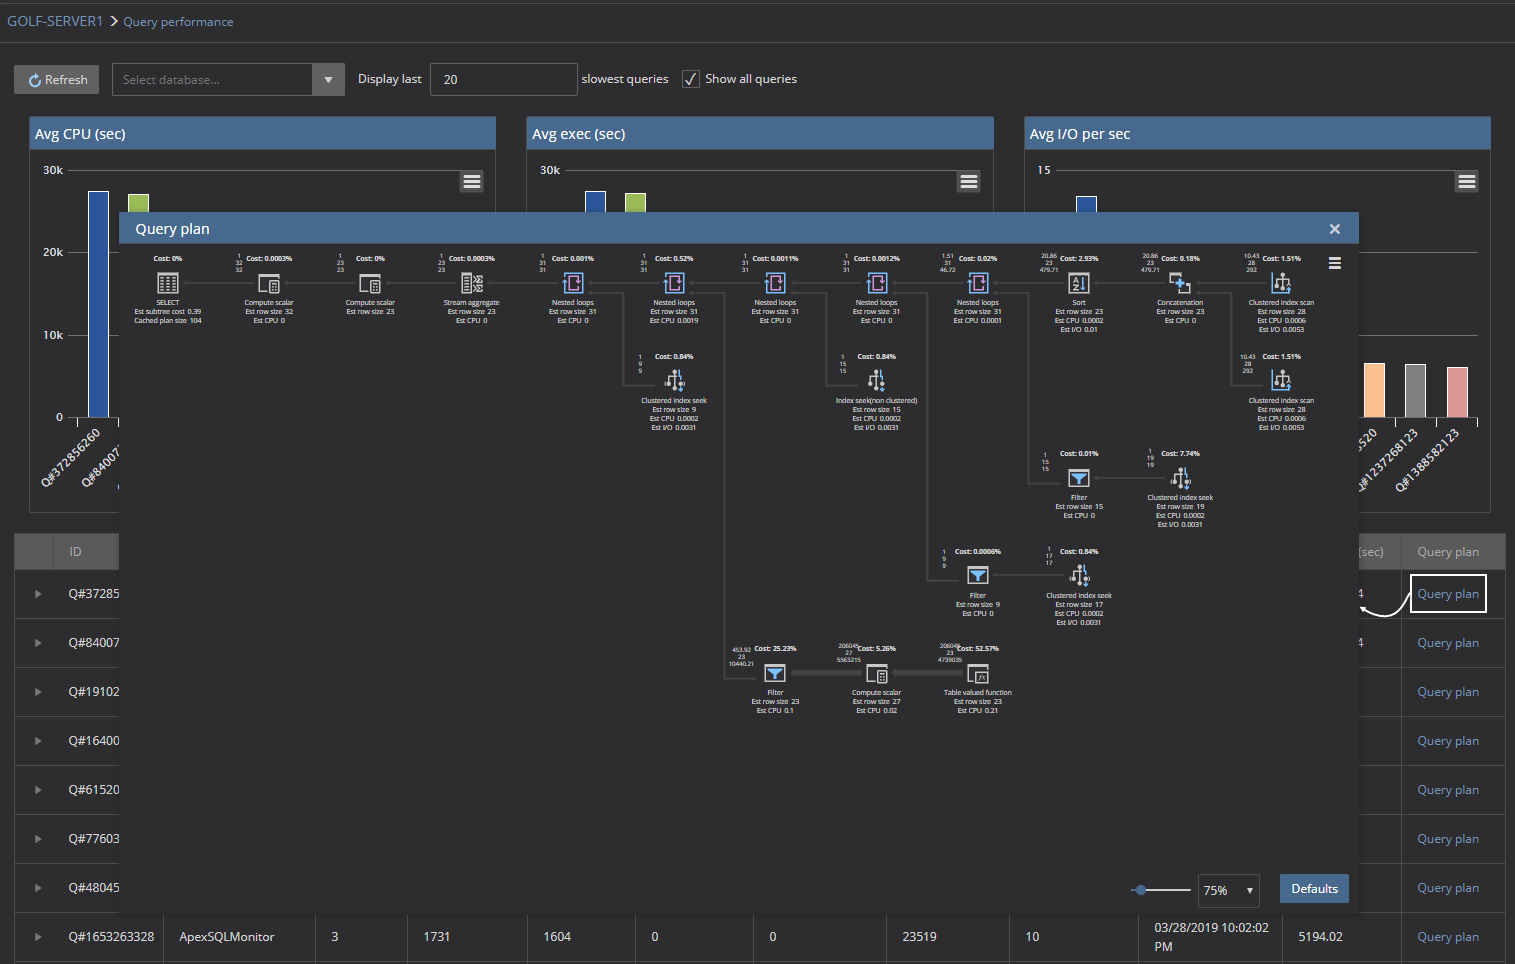
Query performance category
Query performance feature is designed specifically to display the slowest running queries. Besides execution time, needed by a query to accomplish the task, this page shows the slowest queries by average CPU usage, slowest queries by average I/O activity, slowest queries by average execution time which allow the user to much more precisely determine the potential cause of the query slowness:

Also, the query plan can be reviewed for these slowest queries:
More about query performance can be found on the How to identify and troubleshoot slow-running queries in SQL Server page.
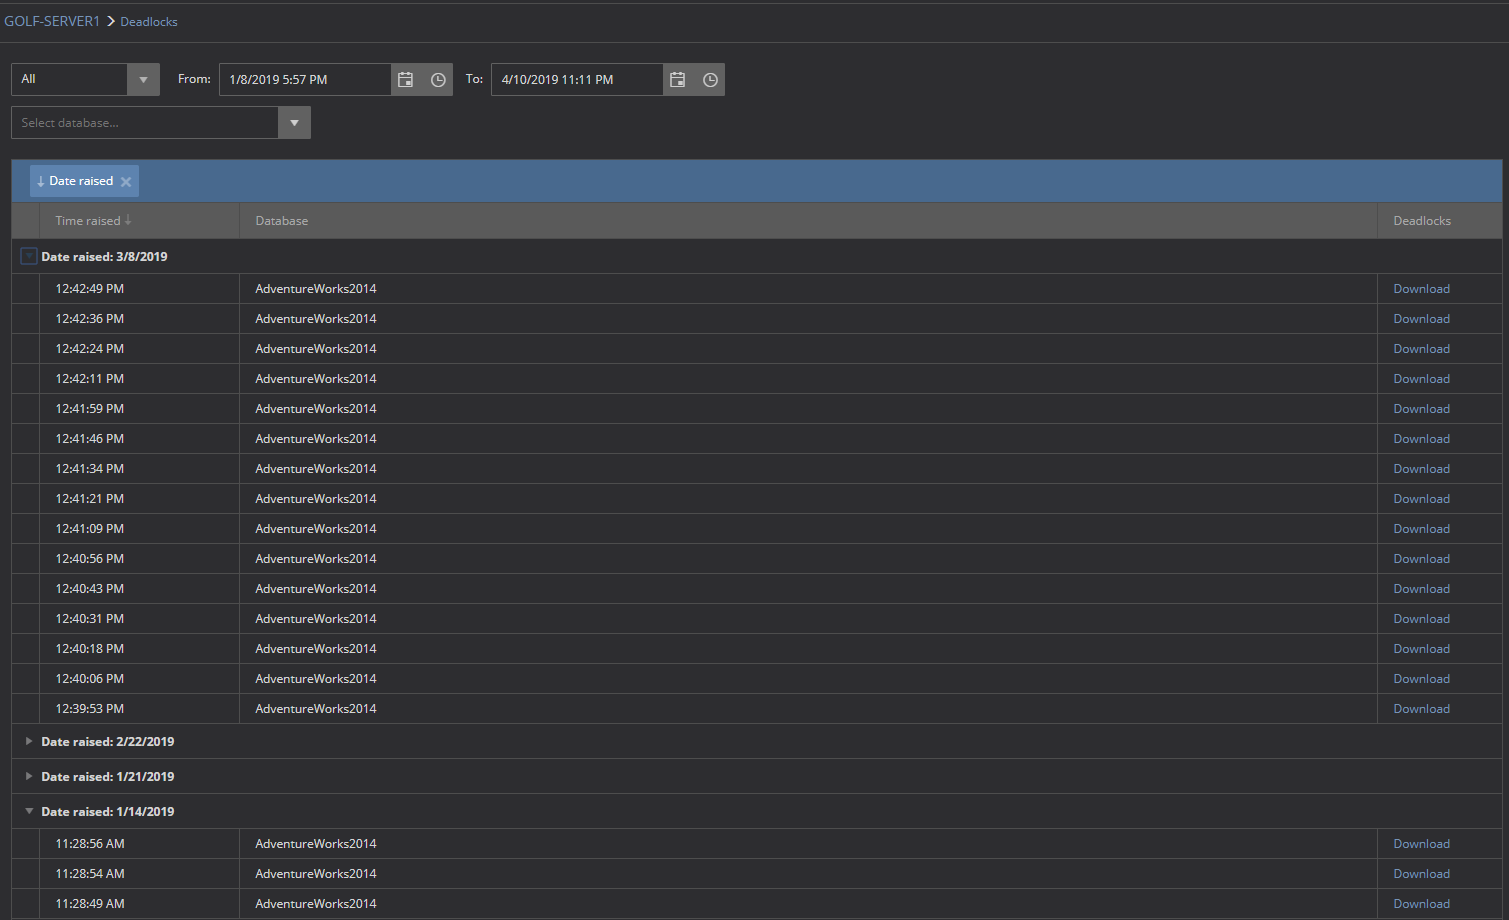
Deadlocks
ApexSQL Monitor captures and saves information about deadlocks, including a collection of deadlocks graphs. All collected information is displayed under the Deadlocks page:
See the How to configure and use deadlock monitoring page for more information about settings and collection of deadlocks in ApexSQL Monitor
Activity monitoring
The Activity monitoring page shows detailed information about the current SQL Server activity and the page is divided in the three main performance sections: Processes, Active expensive queries, and Resource waits.

See the How to use and interpret the SQL Server Activity monitor page for clarification of the Processes, Active expensive queries, and Resource waits section.
Alerts
The alerts page will show the list of all alerts raised for specific SQL Server instance. By default, alerts that are raised in previous 24 hours will be shown:
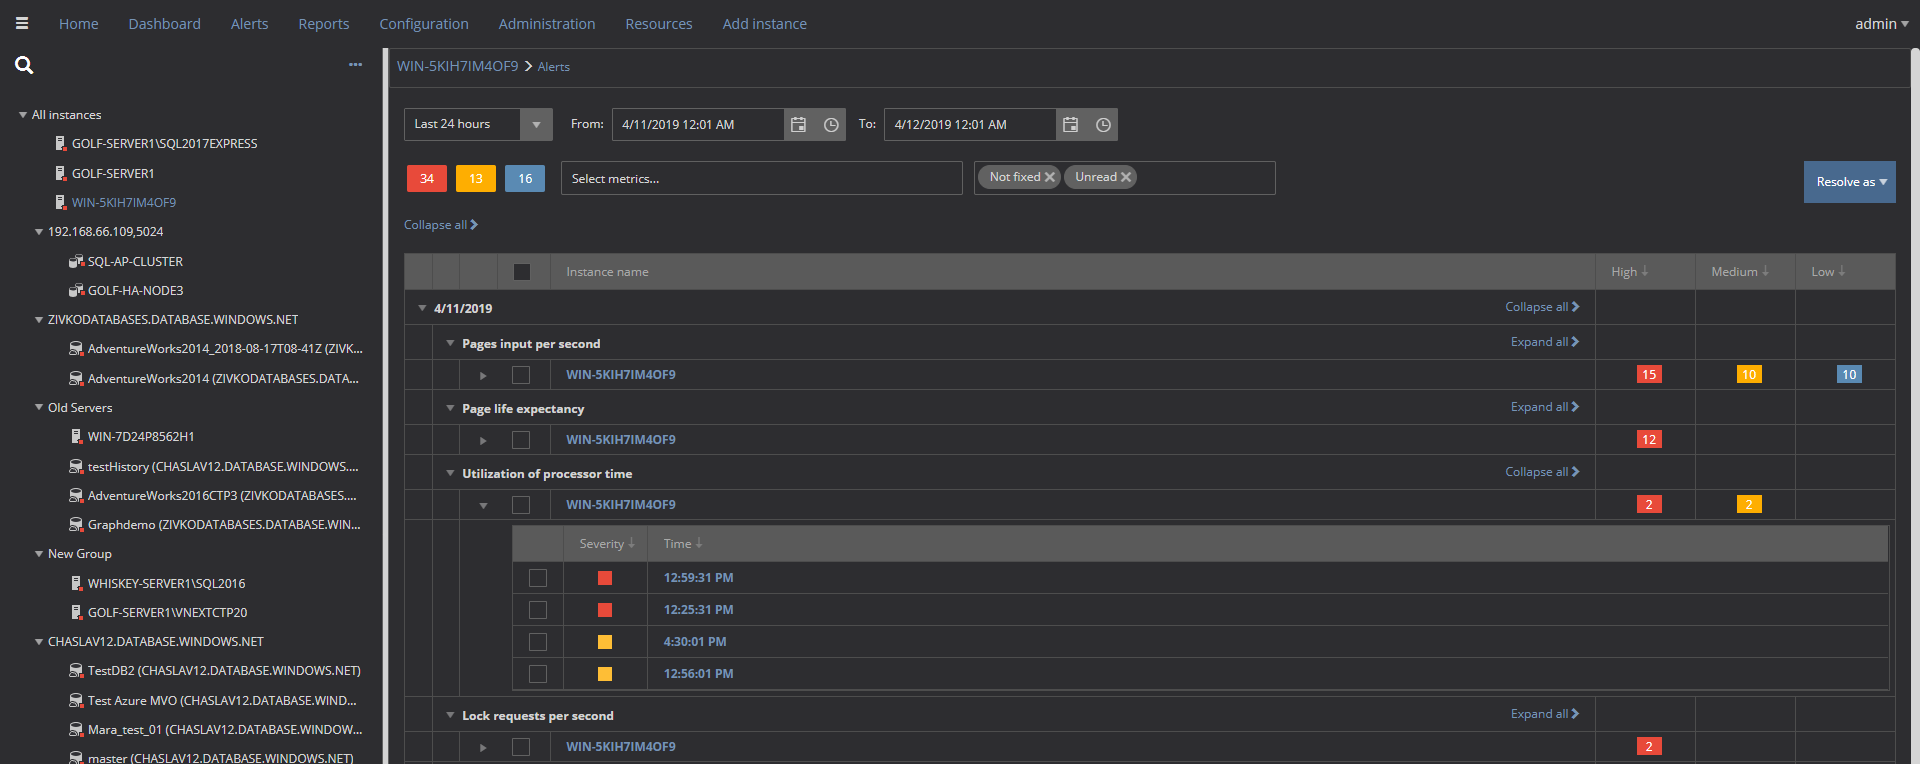
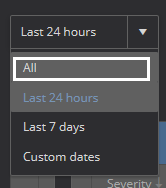
The alerts that have been raised in the last 7 days or alerts from the initial start of monitoring can be shown in the list:
To review alerts that are raised in the specific time range in the From and the To controls, set the values of interest:
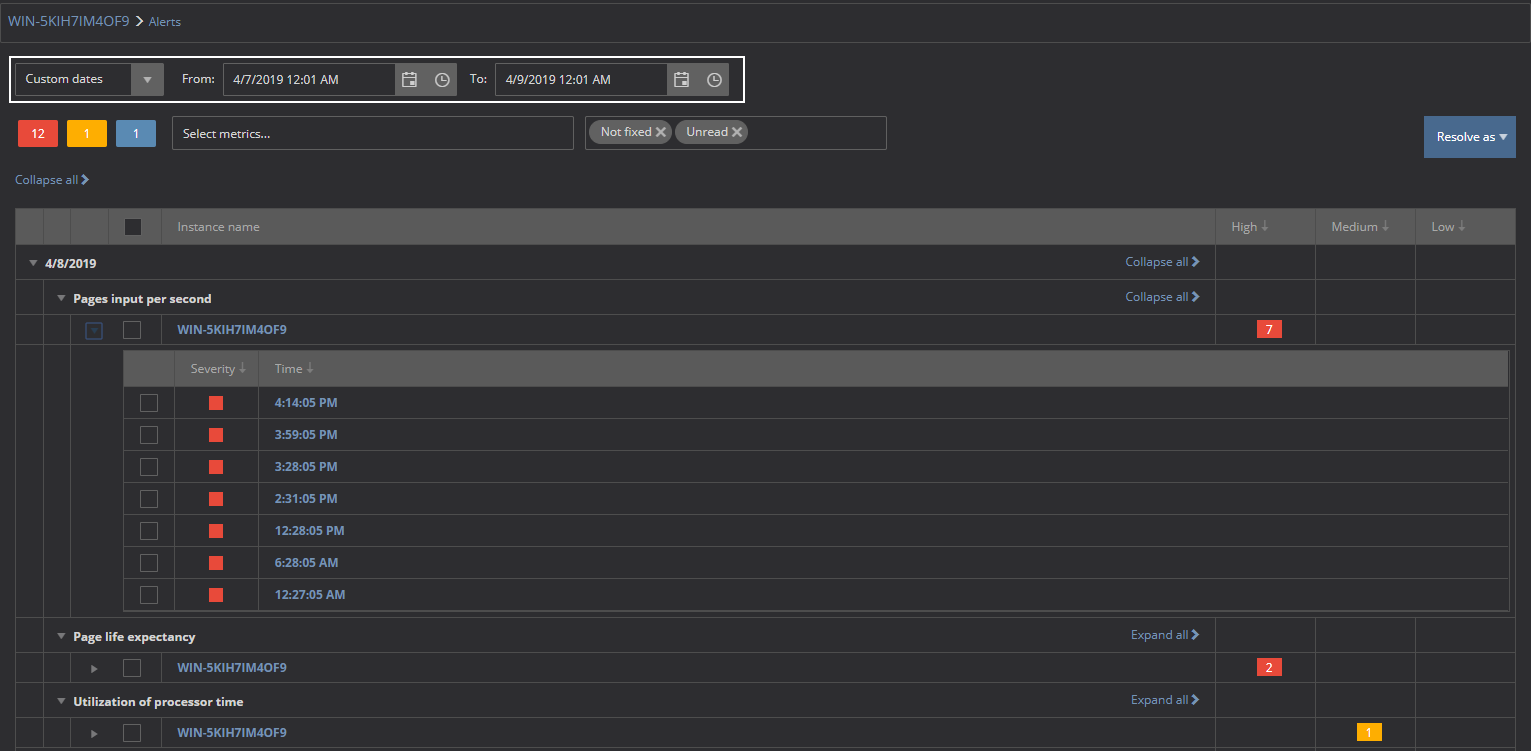
Alerts are grouped by date, metric type and SQL Server instance where they occurred. Additionally, the alerts list can be filtered by severity, metric type and resolution state.
To review the alert in more details, in the alerts list, click on the desired alert, the Alerts detail page will be displayed with chart that shows when the alerts were raised:

For more information about alerts, visit the Reviewing and resolving alerts in ApexSQL Monitor page.
Reports
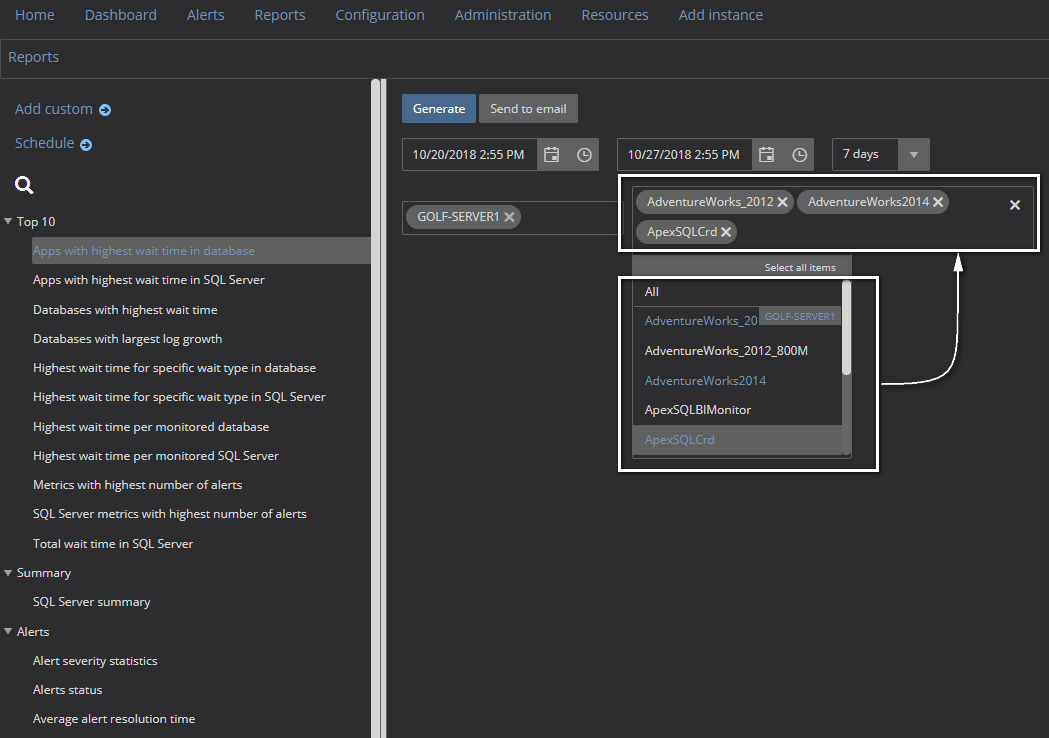
Reports are designed to provide instant and fast insight into the collected historical performance data using an analytical or summary approach. User can choose the various predefined matric reports:
See the Using and scheduling SQL Server performance monitoring reports page.
A user can create various custom reports using SQL Server, System, database metrics:
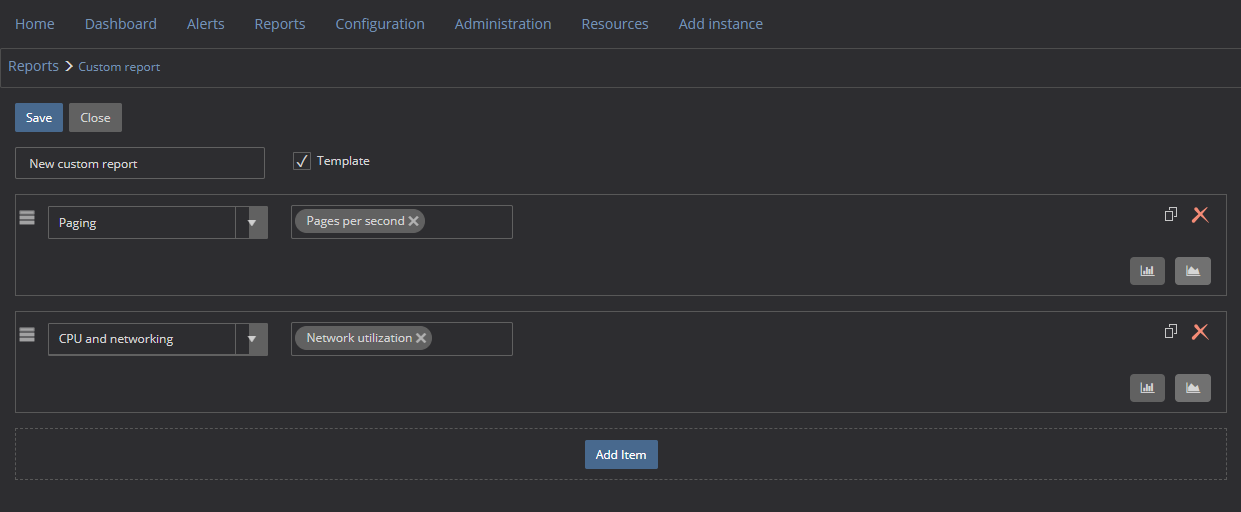
For more information about custom reports, visit the Custom reports basics page.
Configuration/Settings
Under the Configuration page, various parts of the performance monitoring process can be set. Here, also, it can be set which metric will be included in the monitoring process, which devices, databases etc.:
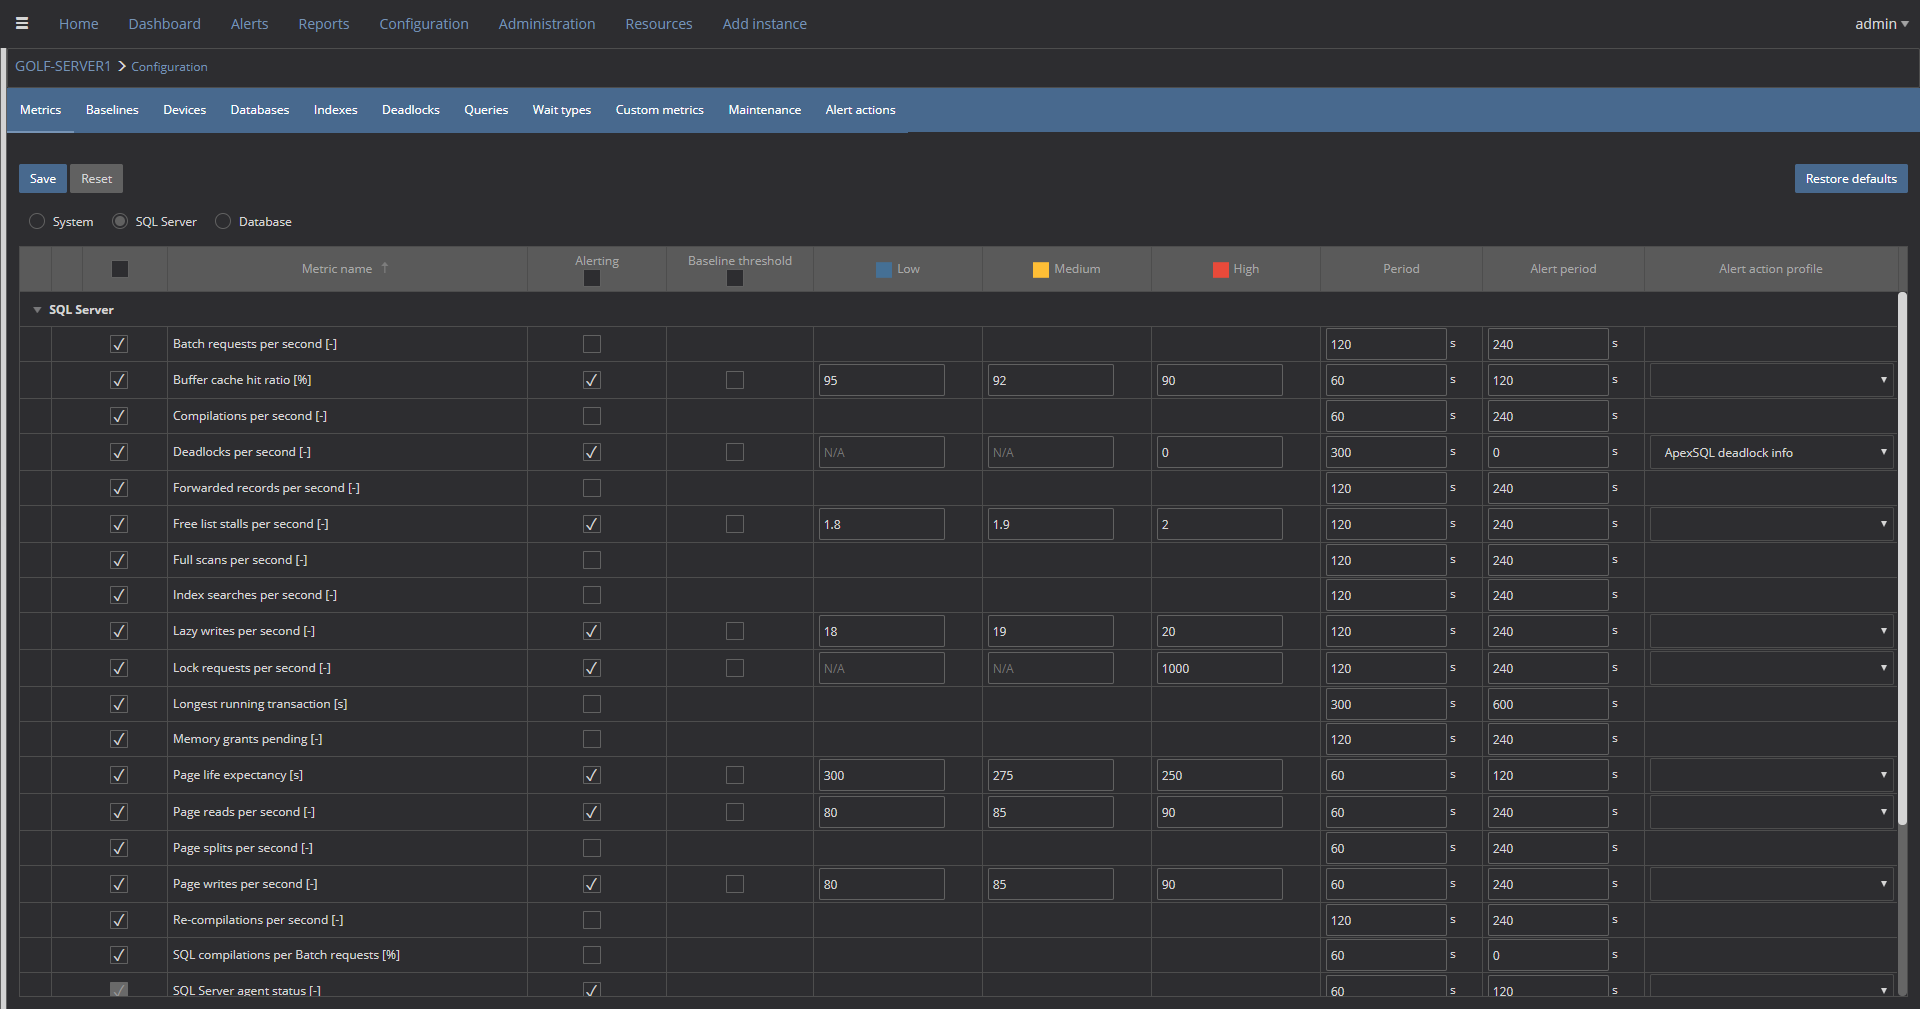
Metric configuration page
This is a default tab under the Configuration page. Here, a user can set what metric (System, SQL Server, Database) to monitor or not, enable/disable alerts for each metric, set baseline threshold, set values for low, medium, high severity for each metric. A user can set the alert period for multiple or just for specific metrics. Alert actions can be assigned to a desired metric:
Baselines configuration page
Basslines for all or for the selected metrics can be calculated at once. Choose the time range for baseline calculation and press the Calculation button:
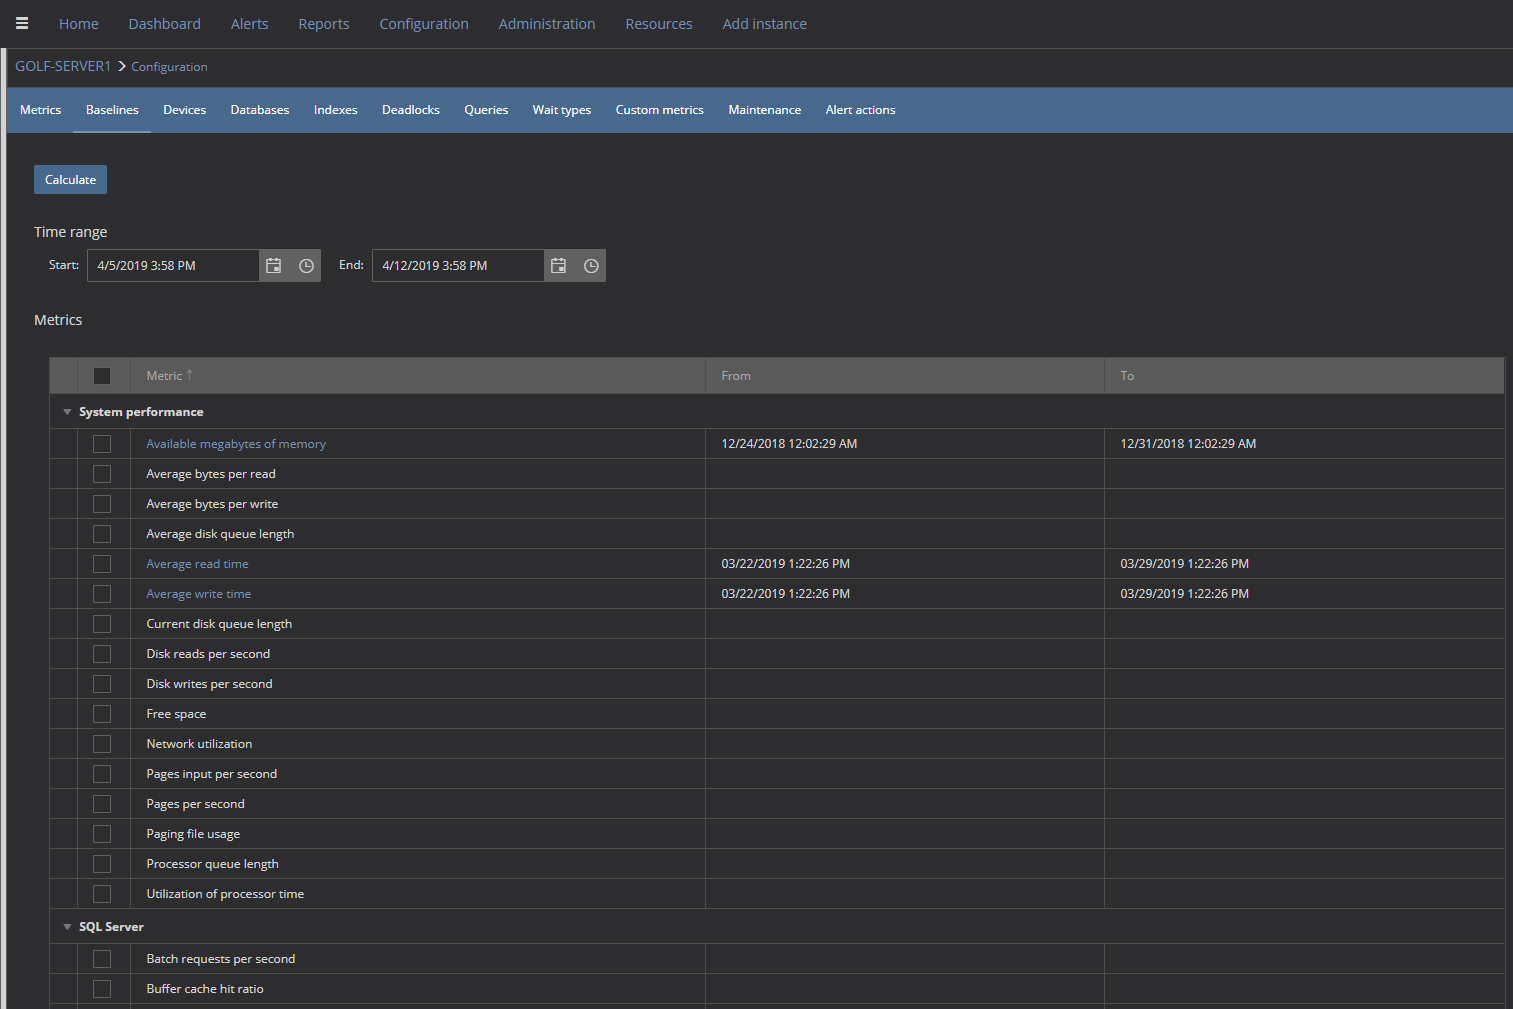
From the list, click on the metric name that has calculated baseline (e.g. Available megabytes of memory [MB]), the baseline details page will be displayed. Here, a user can adjust the baseline thresholds using the interactive char or table:

For more information about baseline threshold, visit the How to customize the calculated SQL Server baseline threshold page.
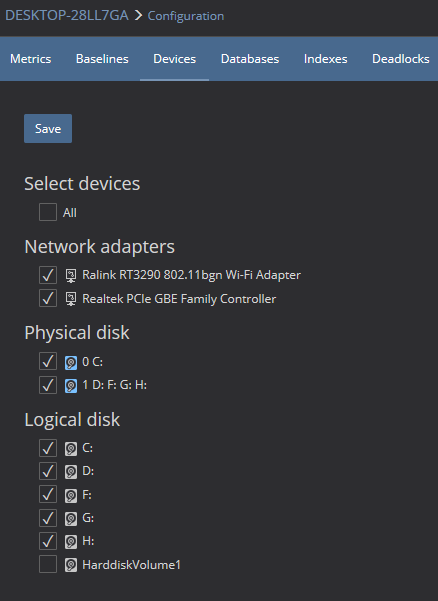
Devices configuration page
Under the Devices page, a user can include/exclude a desired device from monitoring process:
Databases configuration page
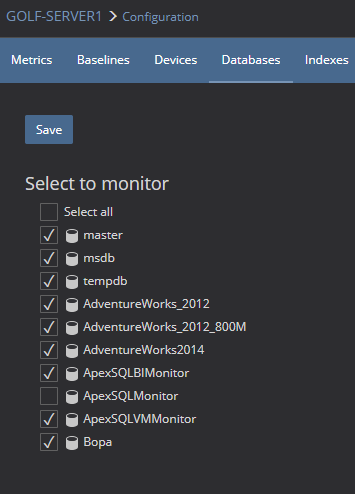
Select or unselect databases for monitoring process can be done under the Databases page:
Indexes configuration page
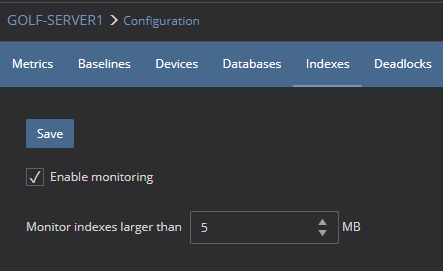
To enable monitoring the indexes with specific size, under the Indexes page, enable this option and set which size of the indexes to be monitored. By default, this option is disabled:
Deadlocks configuration page
Here, a user can enable/disable monitoring of deadlocks. By default, this option is disabled:
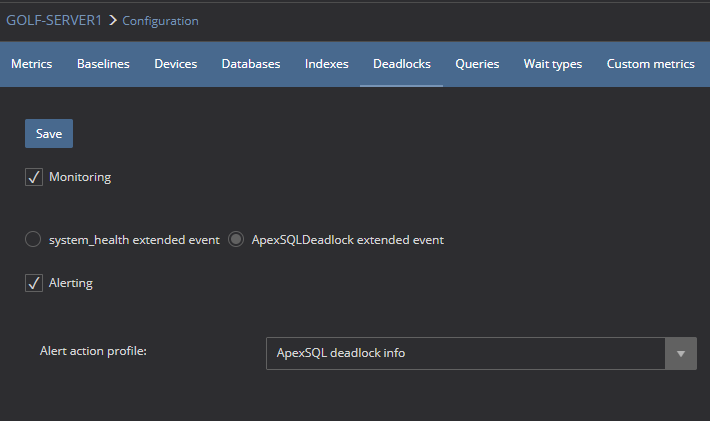
More about monitoring of deadlocks can be found on the How to configure and use deadlock monitoring page.
Queries configuration page
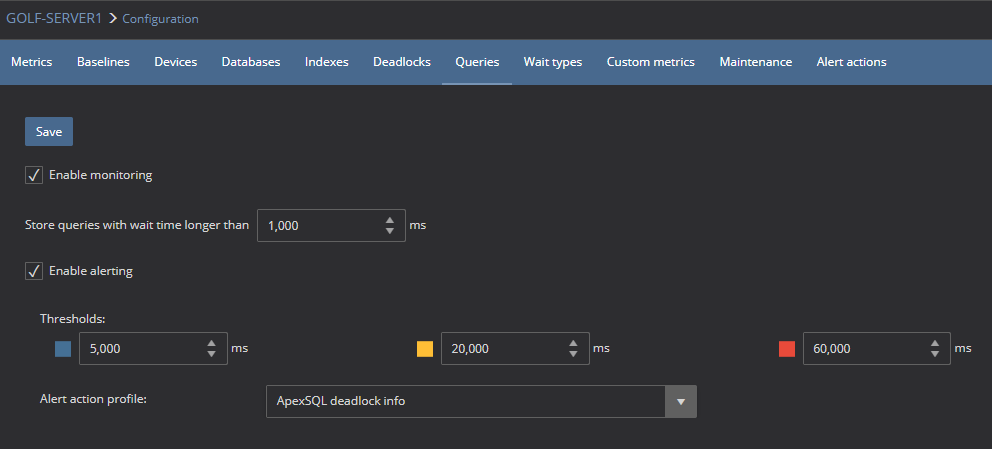
On the Queries page, monitoring of query execution can be set.
By default, every query with a wait time longer than 1000 ms will appear in the Query waits view.
Also, every query with a wait time longer than any threshold will appear in the Query wait statistics alerts view.
Optionally, an alert action profile can be embedded, and executed whenever an alert related to query wait is raised:
For more information about monitoring of queries, see the How to manage monitored queries page
Wait types configuration page
On this page, a user sets what Wait types should be turned on or turned off for monitoring:
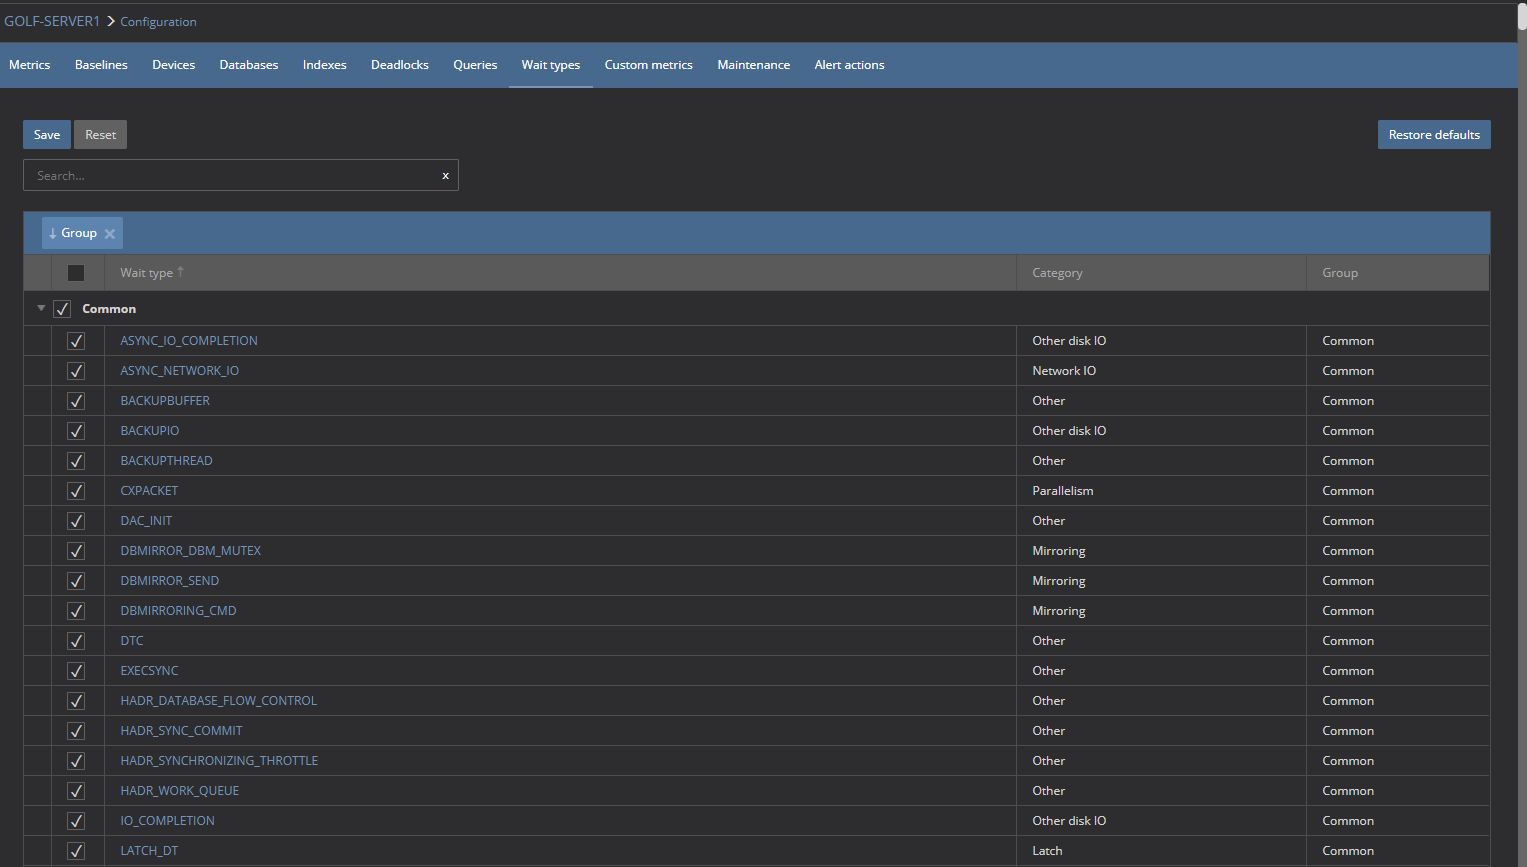
For more datils about wait statistic monitoring, see the How to configure and use SQL Server Wait statistic monitoring page.
Custom metrics configuration page
On this page, the custom system, SQL Server and database metrics can be created that can be used and configured as any built-in performance metric:
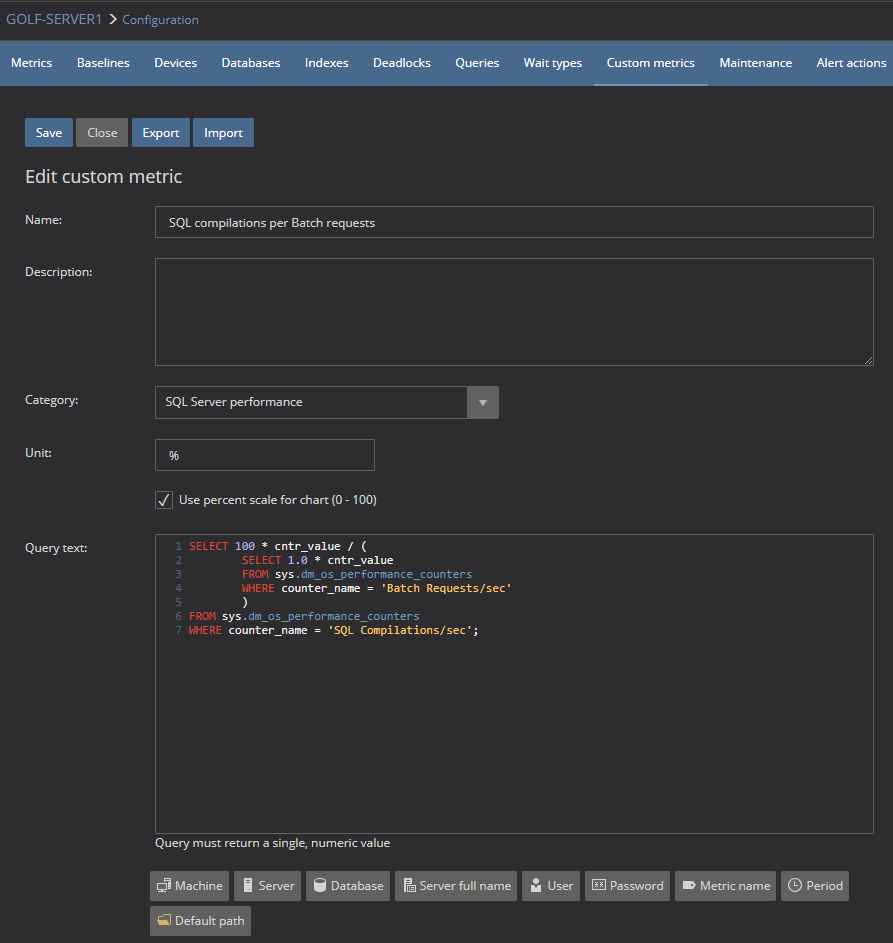
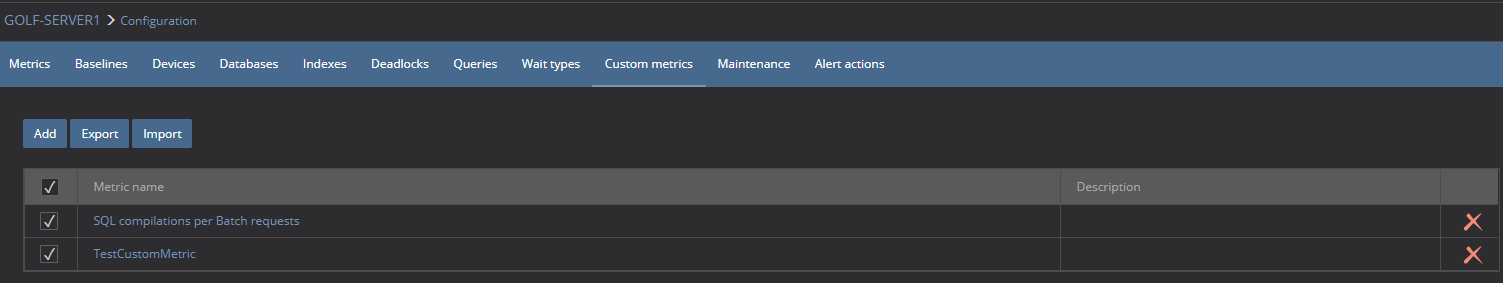
Please, visit the How to set up and activate custom performance metrics page for more information about custom metrics.
Maintenance configuration page
Here, a user creates and sets up maintenance periods to disable measuring and alerting for a particular SQL server:
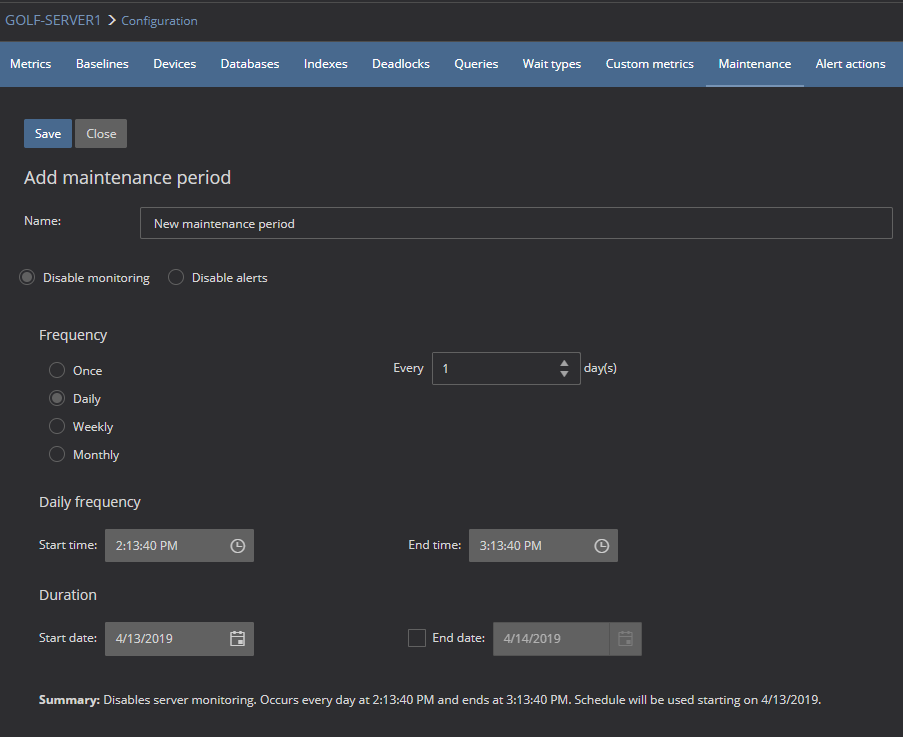
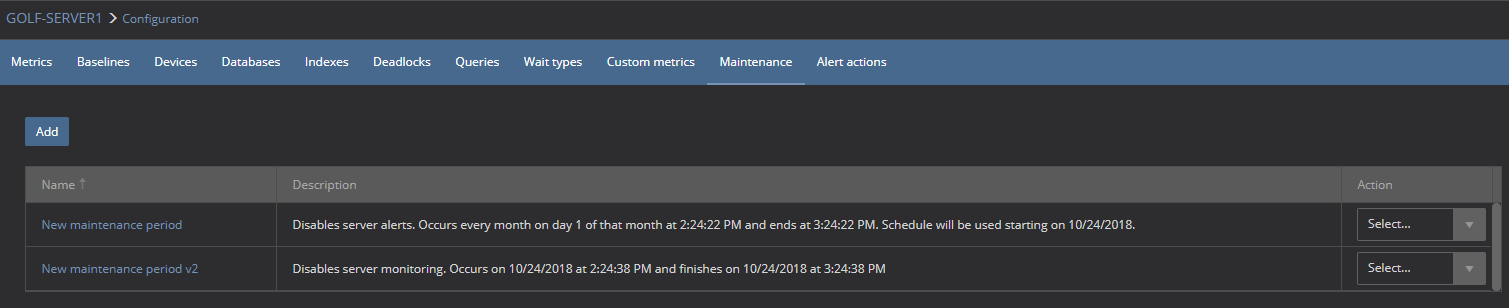
See the How to create and schedule maintenance periods in ApexSQL Monitor for more information.
Alert actions configuration page
Here, numerous alert actions such as adding email profiles, adding SNMP traps, create SQL script and executing CLI and Power shell commands can be set when an alert occurs:

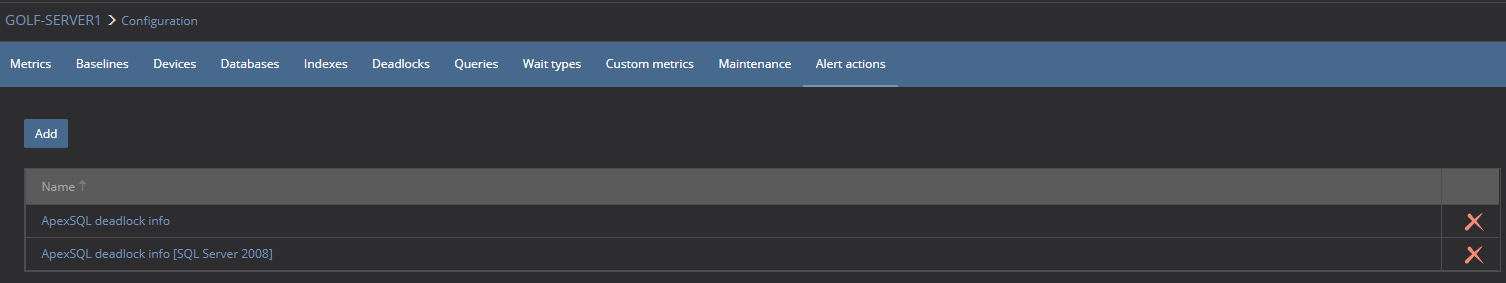
More about alert actions can be found on the How to use custom command alert actions in ApexSQL Monitor page.
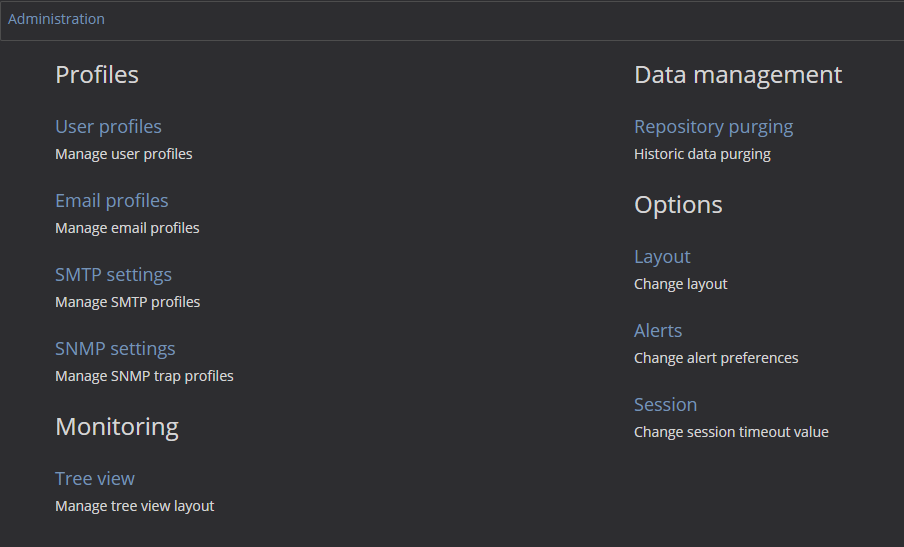
Administration
In the Administration page, a user can set various application settings:
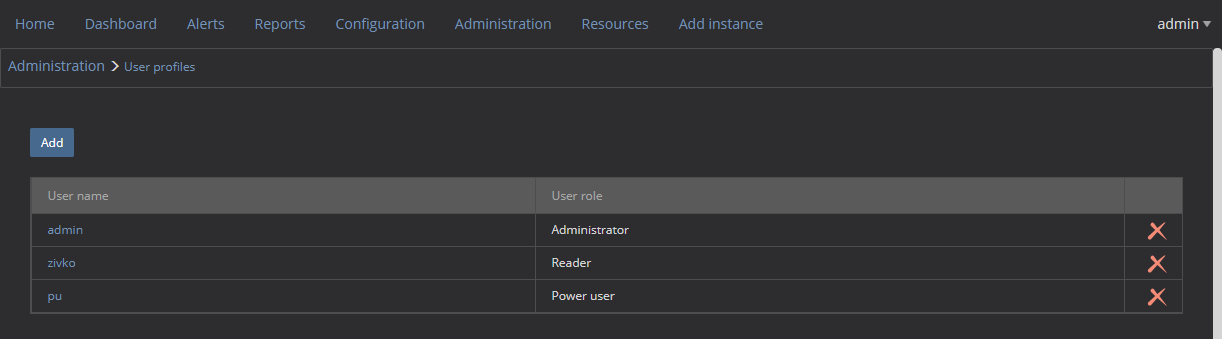
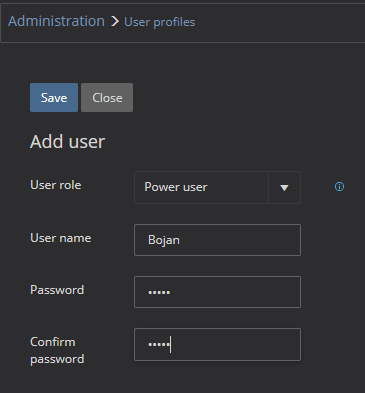
User profiles settings
In the User profile page, application users can be added, removed or edited. One of three user roles: Administrator, Power user or Reader role can be assigned:
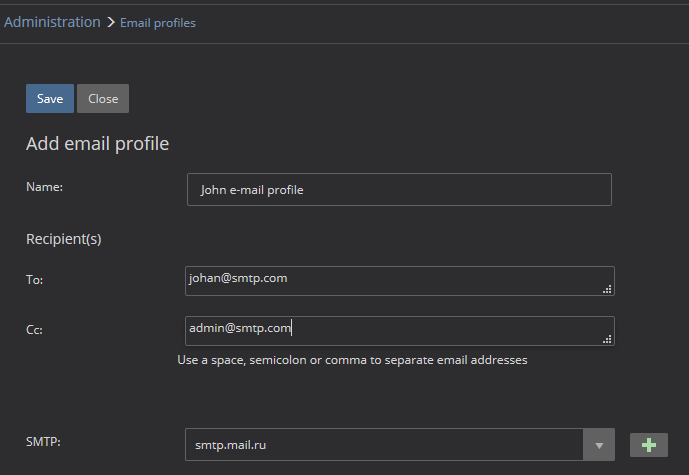
Email profiles settings
On the Email profiles page, a user can add, remove of edit existing email profiles:
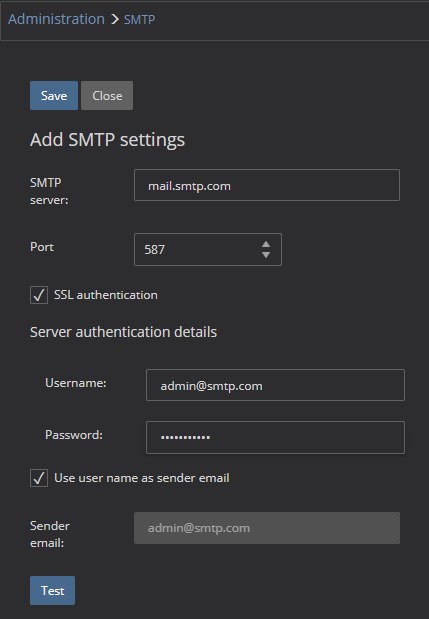
SMTP settings
On the SMTP page, a user can add, remove or edit SMTP mail server profiles:
SNMP settings
This page allows creating, removing and editing SNMP trap settings:
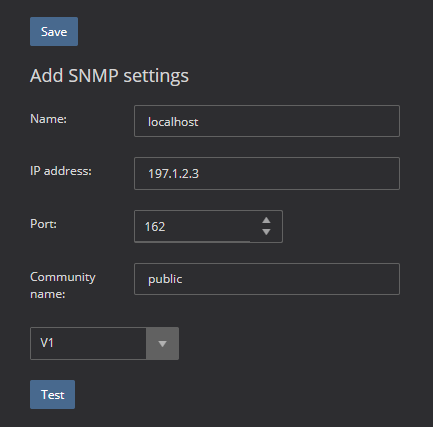
Please visit the Configuring and setting up the SNMP trap in ApexSQL Monitor page for more information.
Repository purging settings
On this page, data retention policy for data stored in the repository database can be set. The application deletes data older than specified number of days:
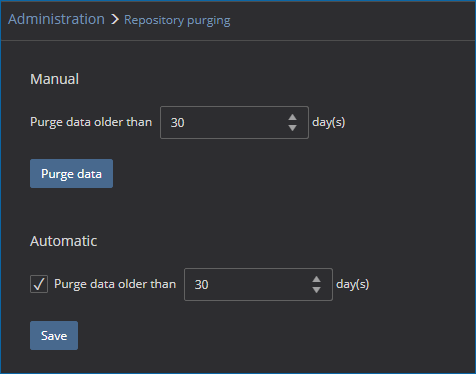
Visit the Purging repository data page for more information about data purging.
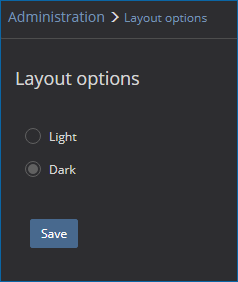
Layout settings
On this page, you can choose between the light and dark application theme:

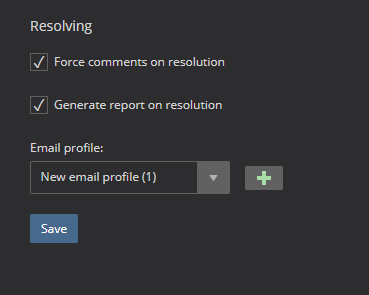
Alerts settings
On the Alerts page, you can set to force user to add comments as part of alerts resolution or to generate a report and sent the email automatically when an alert is resolved:
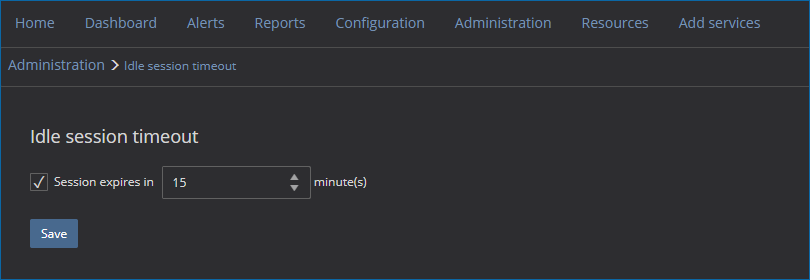
Session settings
On this page, a user can set idle session timeout period or to disable timeout entirely:
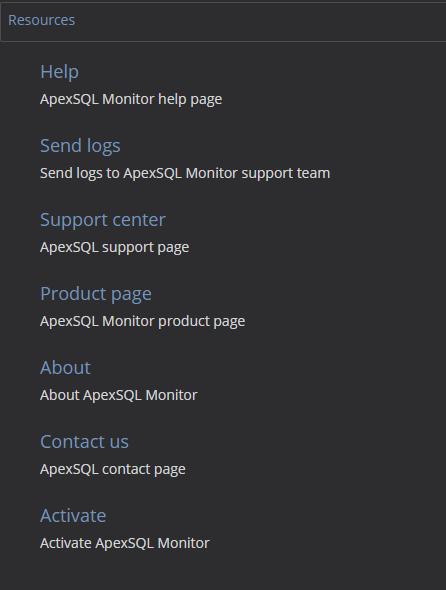
Resources
On this page, a user can connect to ApexSQL teams, access application help, see the application version, number of licences and activate the product:
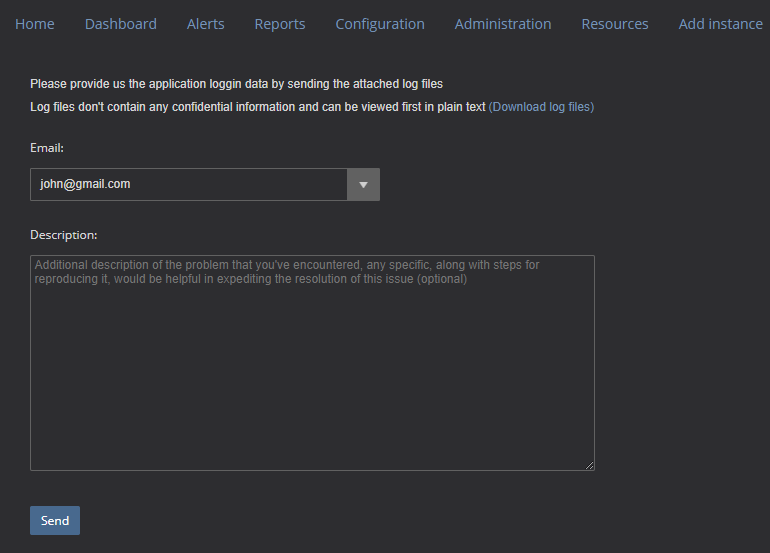
Send logs
By clicking the Send button, the application log files will be sent to the ApexSQL support team:
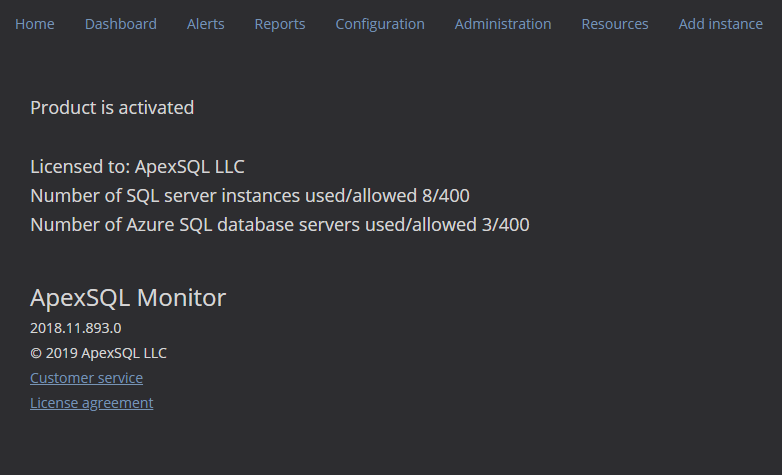
About
On the About page, the number of the used and allowed number of licenses can be seen. In the About page, a user can see informaton about ApexSQL Monitor current version:
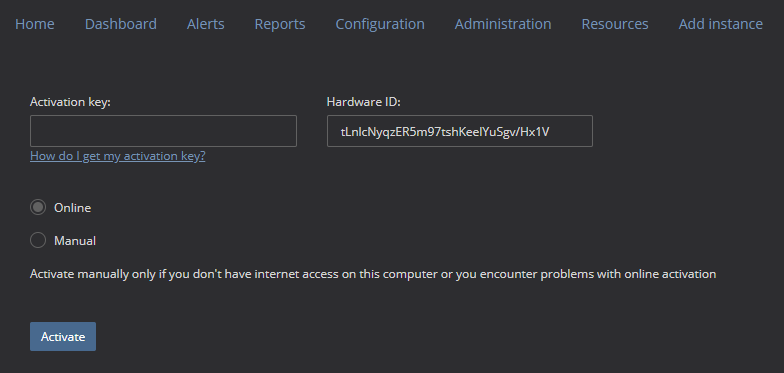
Activate
On this page, a user can activate ApexSQL Monitor with the license key, using the online or manual method;
April 16, 2019


