The new release of ApexSQL Monitor, a monitoring tool that monitors more than 30 system, SQL Server, and database performance counters in real time is released.
ApexSQL Monitor dashboard
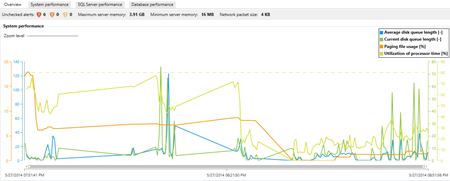
The Overview tab is a dashboard that presents the most important performance metrics monitored by ApexSQL Monitor. Graphs are shown one below another. If alerts have been raised, it’s clearly indicated in the graph and you can see the alert list in a single click.
Monitor system performance
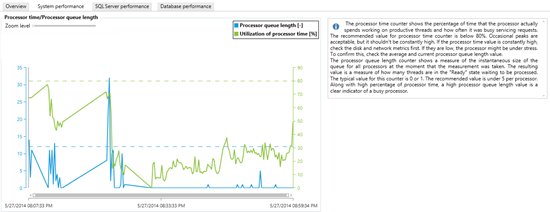
ApexSQL Monitor tracks Windows metrics that indicate processor, memory, disk, paging, and network performance. These are processor time, processor queue length, network utilization, paging file usage, pages input per second, pages per second, average disk bytes per write/read, average disk queue length, average disk seconds per read/write, disk write/read bytes per second, and available memory.
The graphs are shown one under another, with a brief description of the metric they show.
Monitor SQL Server performance
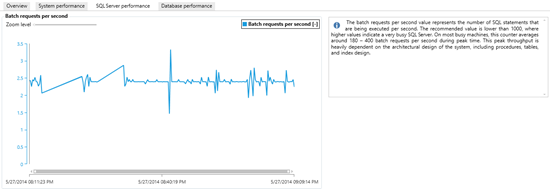
All monitored SQL Server performance metrics are shown in the SQL Server performance tab. These are: batch requests per second, longest running transaction, full scans per second, free list stalls, lazy writes per second, lock requests per seconds, deadlocks per second, user connections, total server memory, memory grants pending, buffer cache hit ratio, page life expectancy, page reads/writes per second, and page splits per second.
Monitor SQL database performance
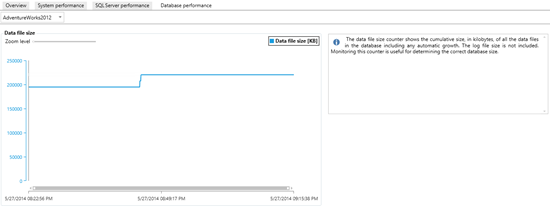
The Database performance tab shows data file size, total database size, log file size, and log growth.
Real-time graphs
Each metric is shown in a real-time graph that can be zoomed using the slider at the top. If the metric values are higher than the alerting thresholds, it can be clearly indicated in the graph, and you can easily go directly to the alert details.
Similar performance metrics that should be monitored and analyzed together, such as Page reads/sec and Page writes/sec, and Total server memory and Target server memory are shown in the same graph.
The graph also provides precise time and value for the point selected in the graph.
The graph can also show three alerting thresholds (green, yellow, and red) for the metric, so you can easily determine when the metric was out of the normal value range.
Metric history
ApexSQL Monitor saves all monitored metric values in a central repository. The historic data can be viewed in the graphs, the same as the real-time data.
ApexSQL Monitor provides viewing the historic metric values for the last 24 hours, 7, and 30 days in a single click.
Metric filtering
All performance metrics are grouped in the following categories: performance, server, and database.
The whole metric group can be easily selected or deselected, for each monitored machine, SQL Server instance, and database.
Alerting
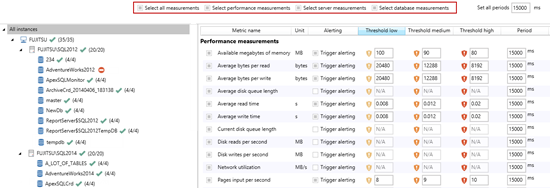
ApexSQL Monitor offers three threshold levels for alerting for every metric: low, medium, and high. They can be configured in the Configure metrics dialog.
The Period column defines the time interval after which the alert is raised again, if the metric is still out of the defined range. The default period value is 15 seconds. For non-critical metrics, set this parameter to a higher value to avoid noise caused by too frequent alert triggering.
When a metric value exceeds a predefined threshold value, an alert shown in the metric graph and alerts list.
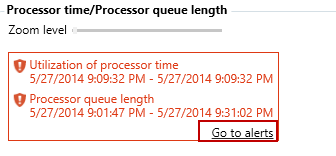
The alerts can be cleared in the Review alerts dialog. You can dismiss the alarms for a specific metric on selected or all SQL Server instances by selecting the adequate check box, or dismiss all alarms by selecting the Resolve all alerts check box.
The alert list provides easy access to the graph that shows the metric that triggered the alert.
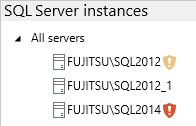
A server that has unresolved alerts is indicated by the alert icon in the Servers list in the left pane.
Support for SQL Server 2014
ApexSQL Monitor will fully support SQL Server 2014.
Purge data
ApexSQL Monitor stores historic data in a central database repository. Depending on the number of monitored systems, SQL Server instances, databases, and metrics, as well as alerts raised, the database repository grows. How long you will keep the data in the repository depends on your requirements.
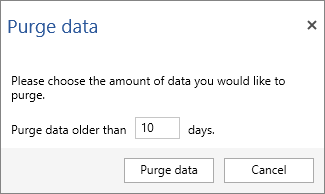
ApexSQL Monitor provides an option to quickly delete data older than a specified number of days from the repository and thus maintain the repository size.
May 16, 2014


