We are excited to announce the release of a new monitoring tool, ApexSQL VM Monitor. ApexSQL VM Monitor is a web application for comprehensive monitoring and troubleshooting of virtual environments.
ApexSQL VM Monitor comes with support for Hyper-V and VMware hypervisor performance monitoring along with the performance monitoring of virtual machines hosted on those hypervisors. Additionally, ApexSQL VM Monitor provides features for troubleshooting of virtual environment performance, such as reviewing historical data, alerting and reporting.
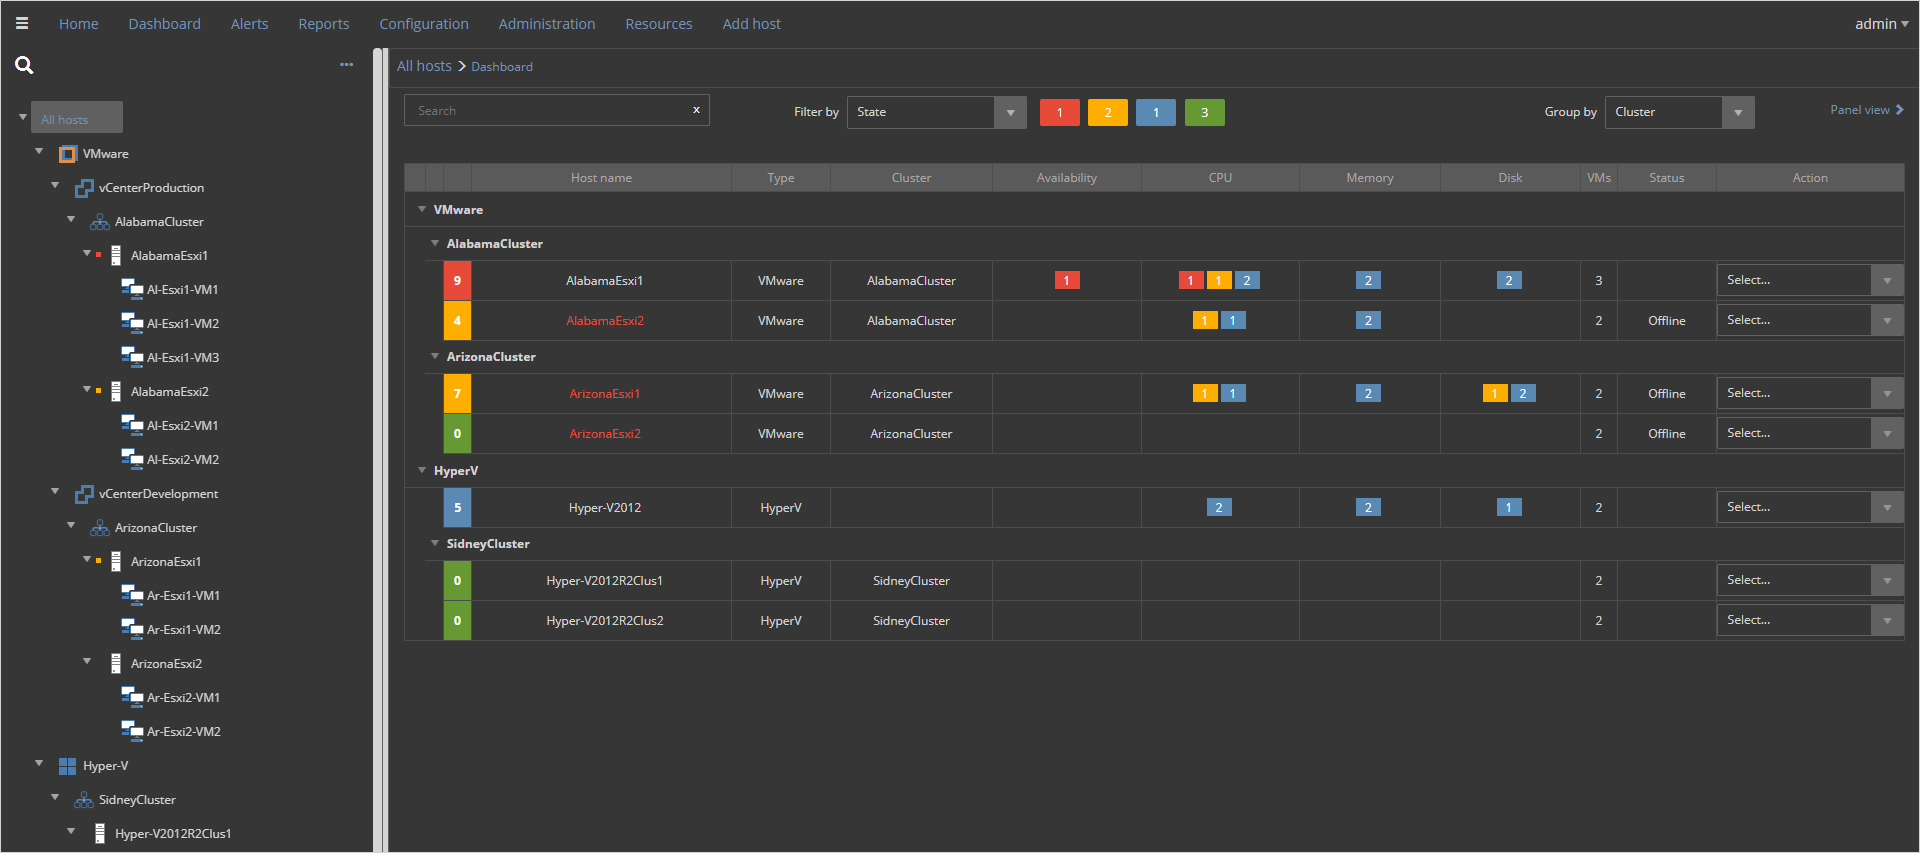
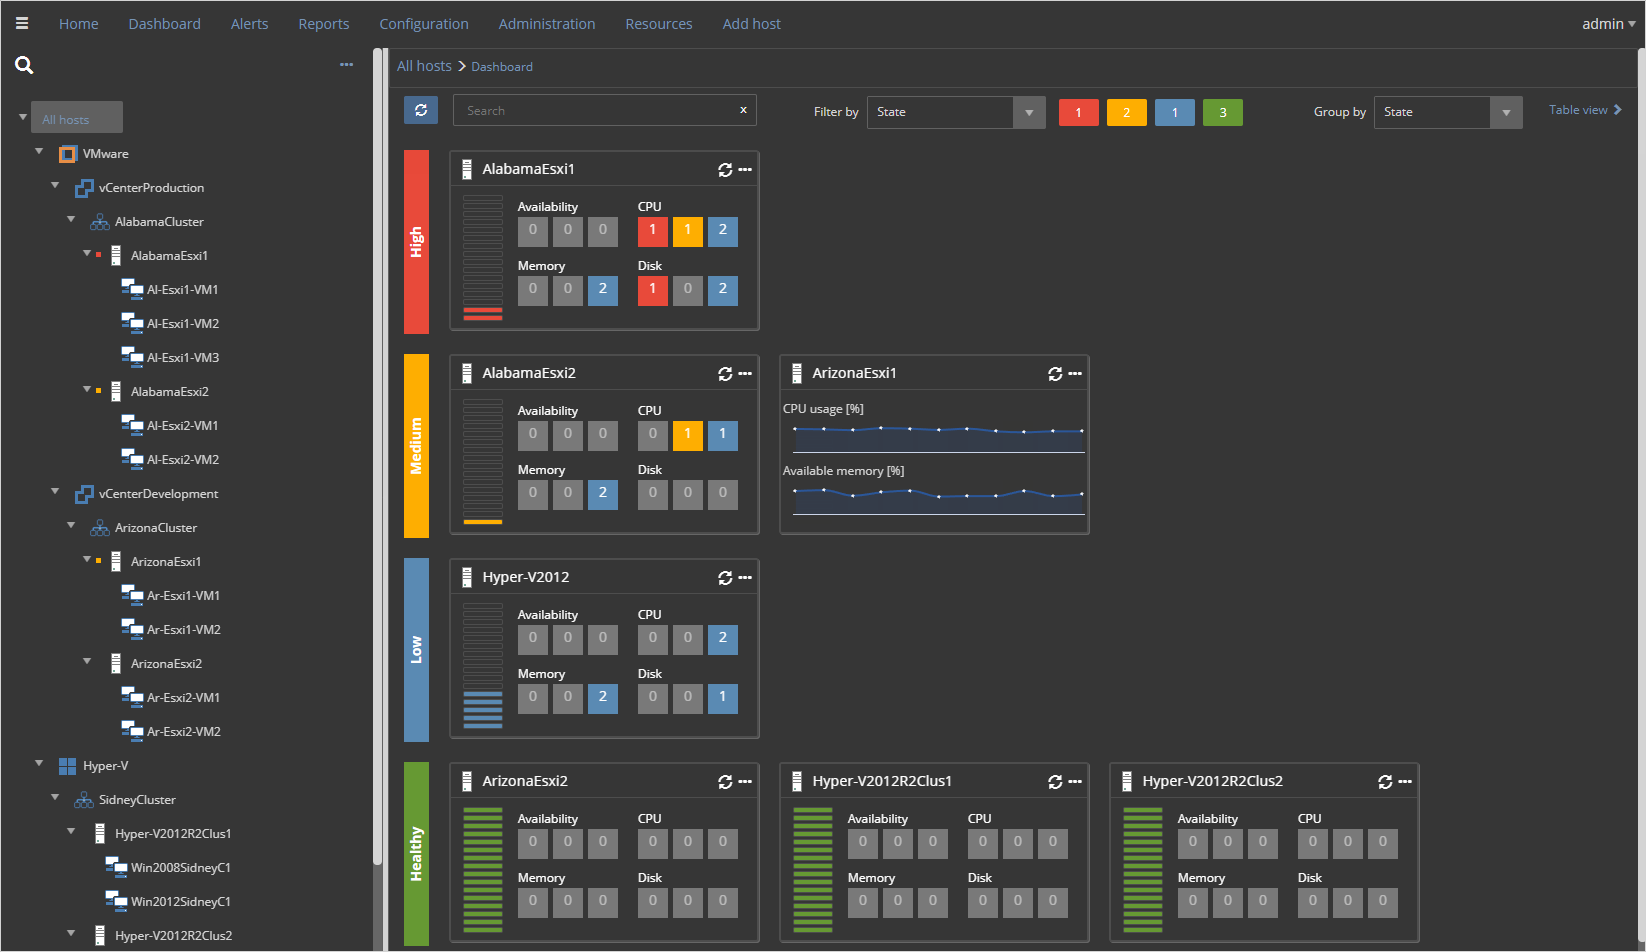
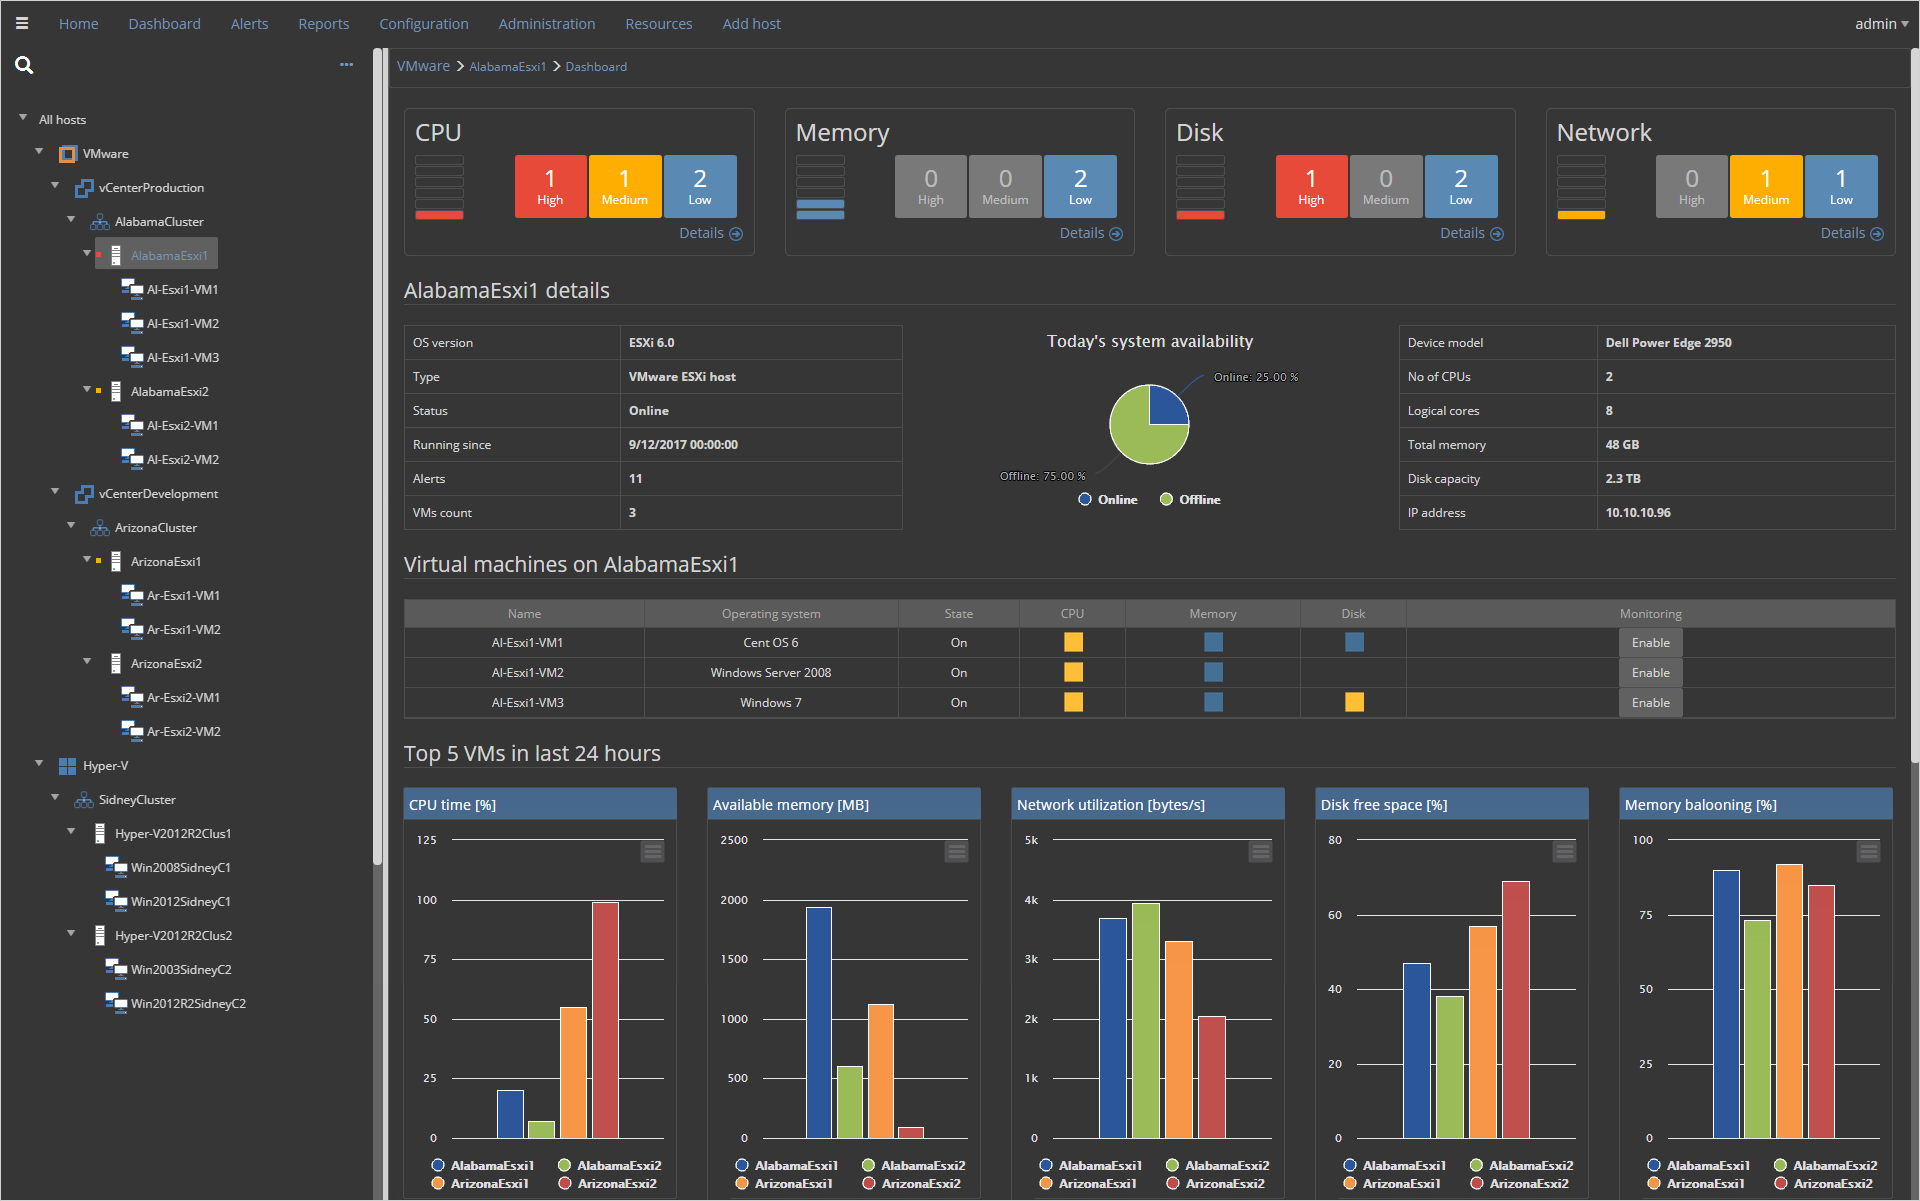
The ApexSQL VM Monitor unified dashboard help to quickly identify hosts with performance issues.
Besides the regular table view, a centralized dashboard has the panel view to find most problematic hosts easily and to check the state of monitored hosts quickly.
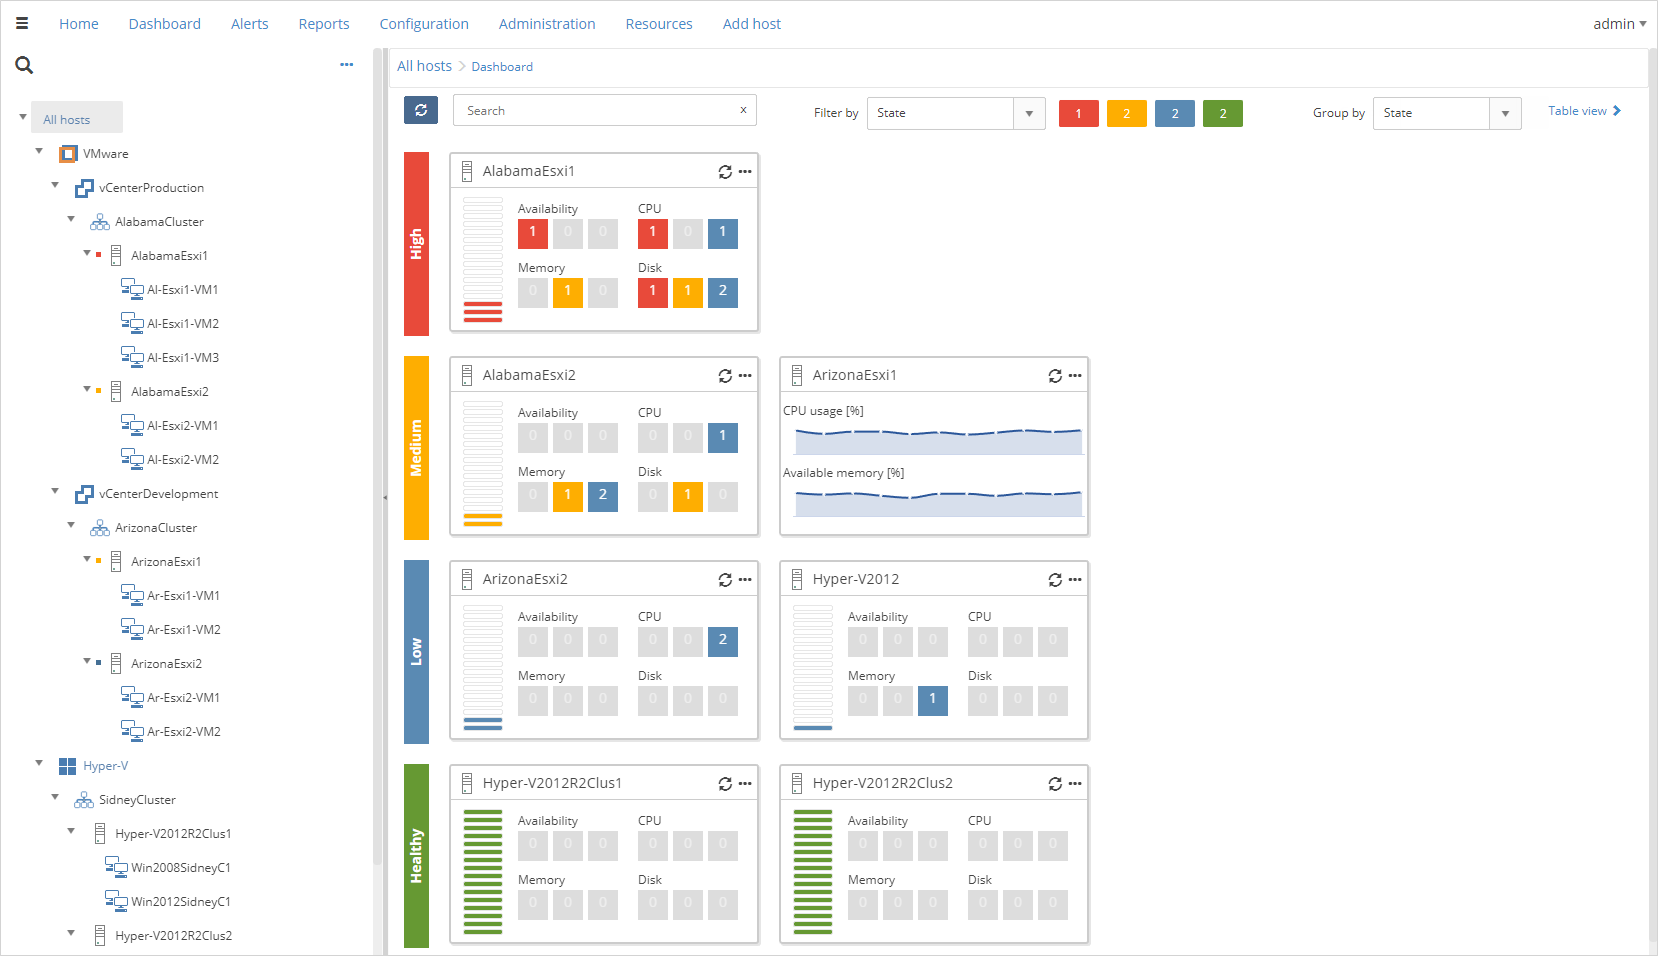
ApexSQL VM Monitor has themed interface with two color schemes – Light and Dark.
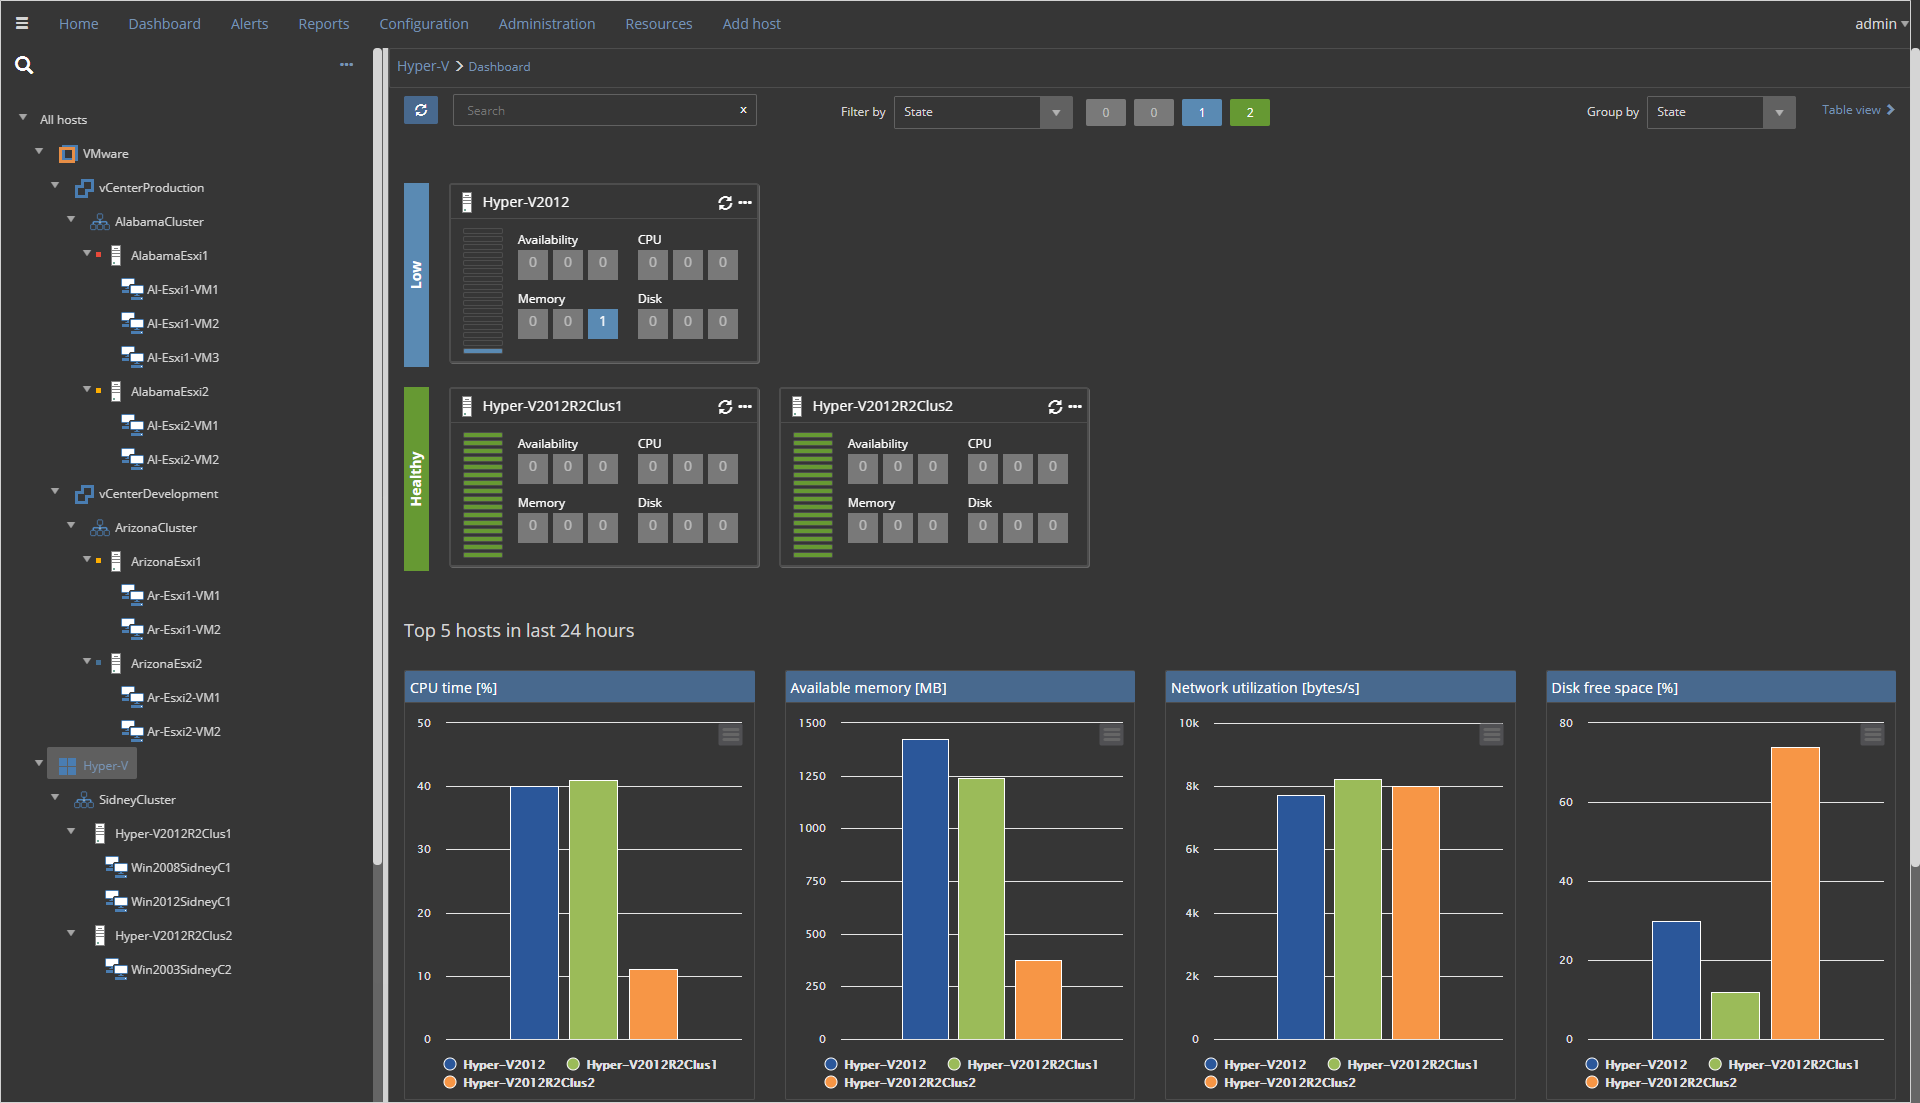
ApexSQL VM Monitor uses dashboards for both supported hypervisors – Hyper-V and VMware. Hypervisor dashboards, besides state and alerts info, provide information about top 5 slowest hosts by various performance metrics like CPU usage, Available memory, Network utilization and Disk free space.
The host dashboard displays specific details for selected host machines such as information about alerts and hardware for the chosen host machine. Information about hosted virtual machines provides crucial performance details and alert states.
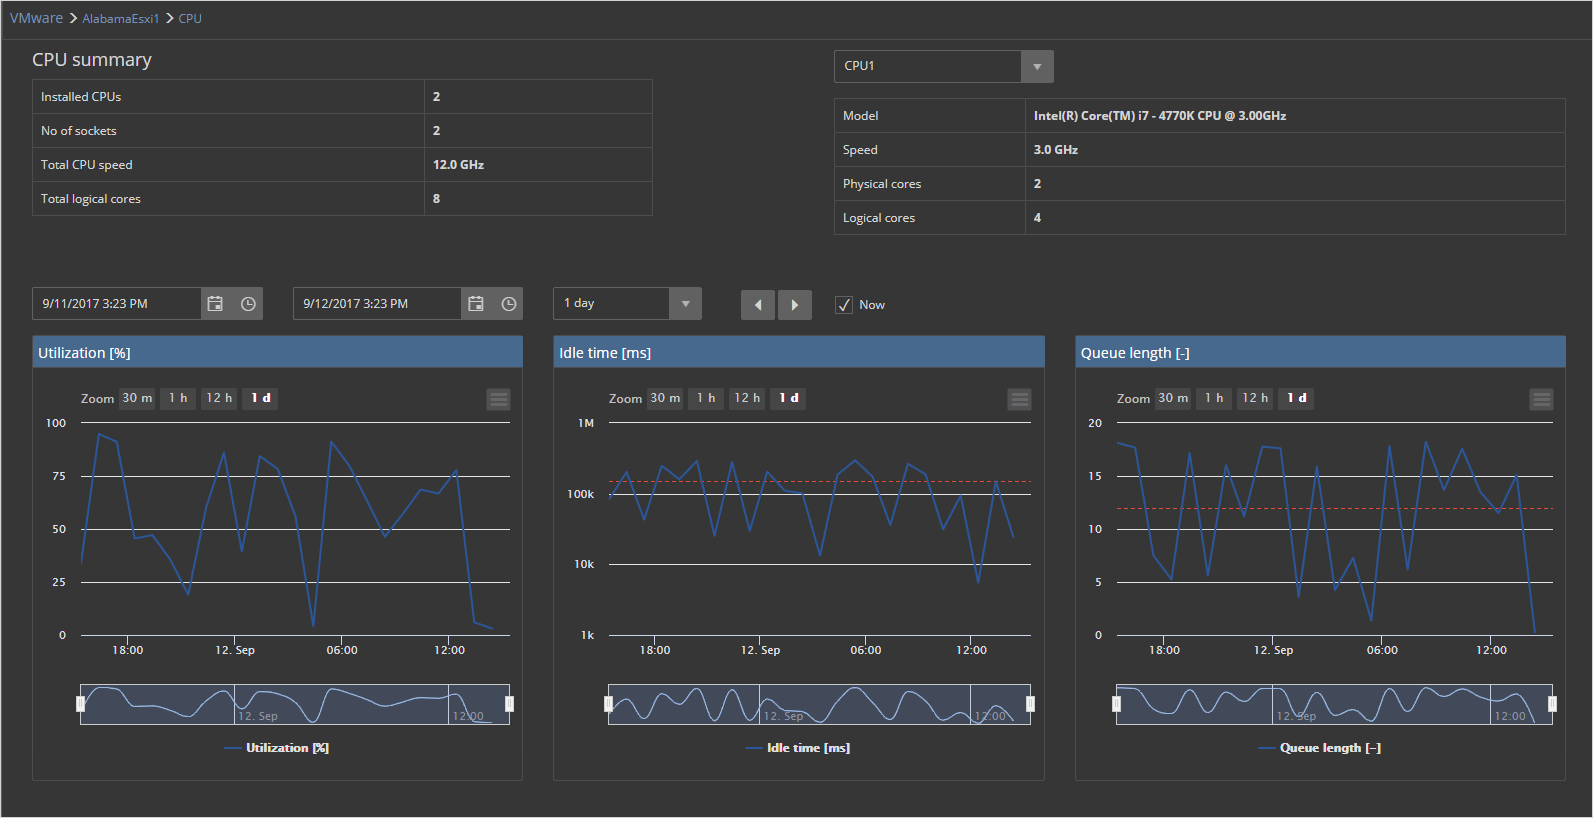
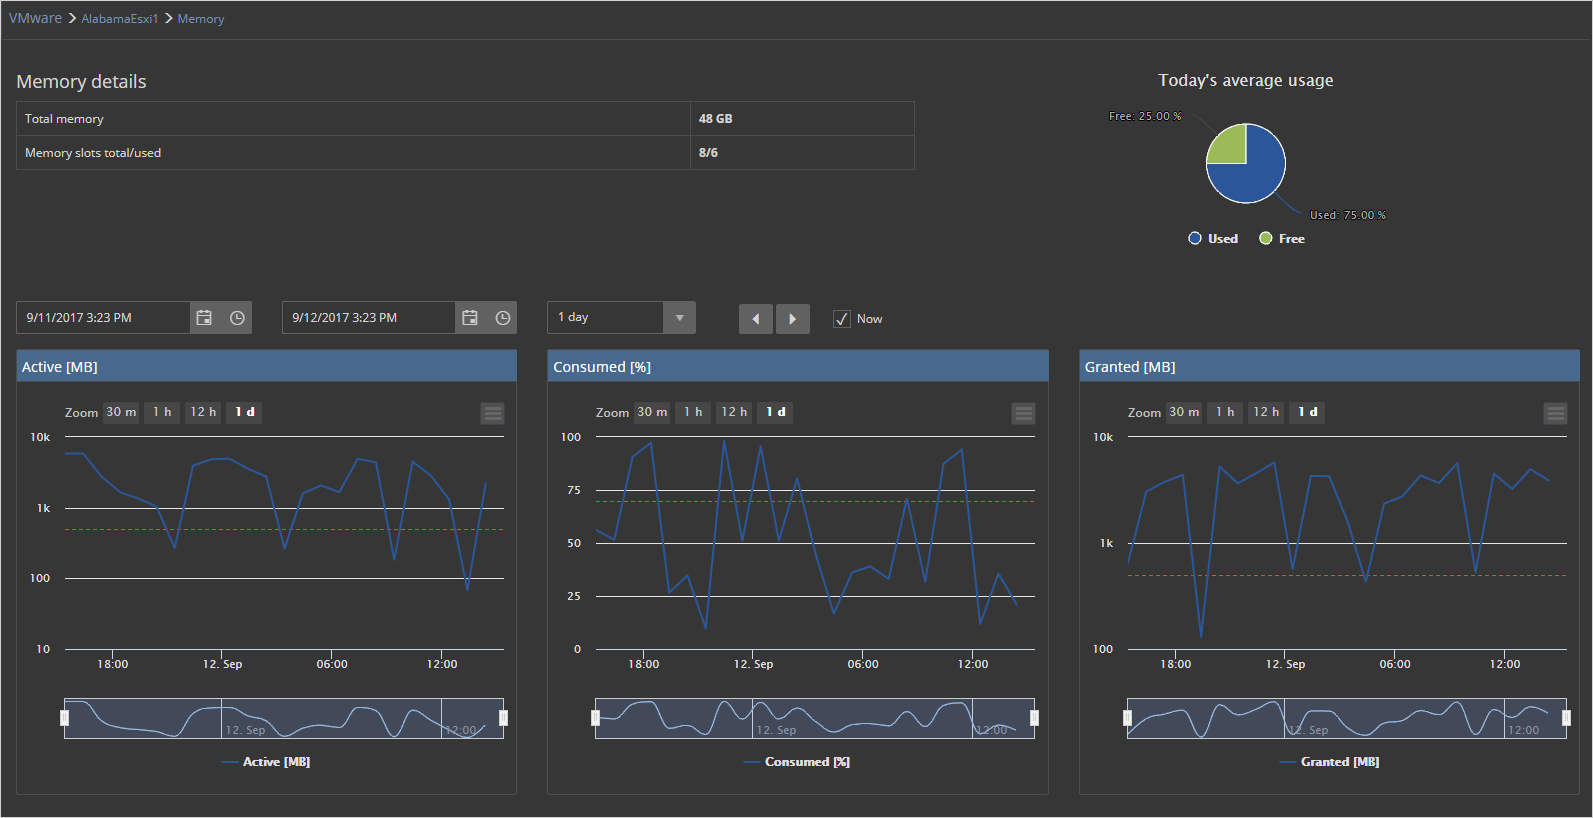
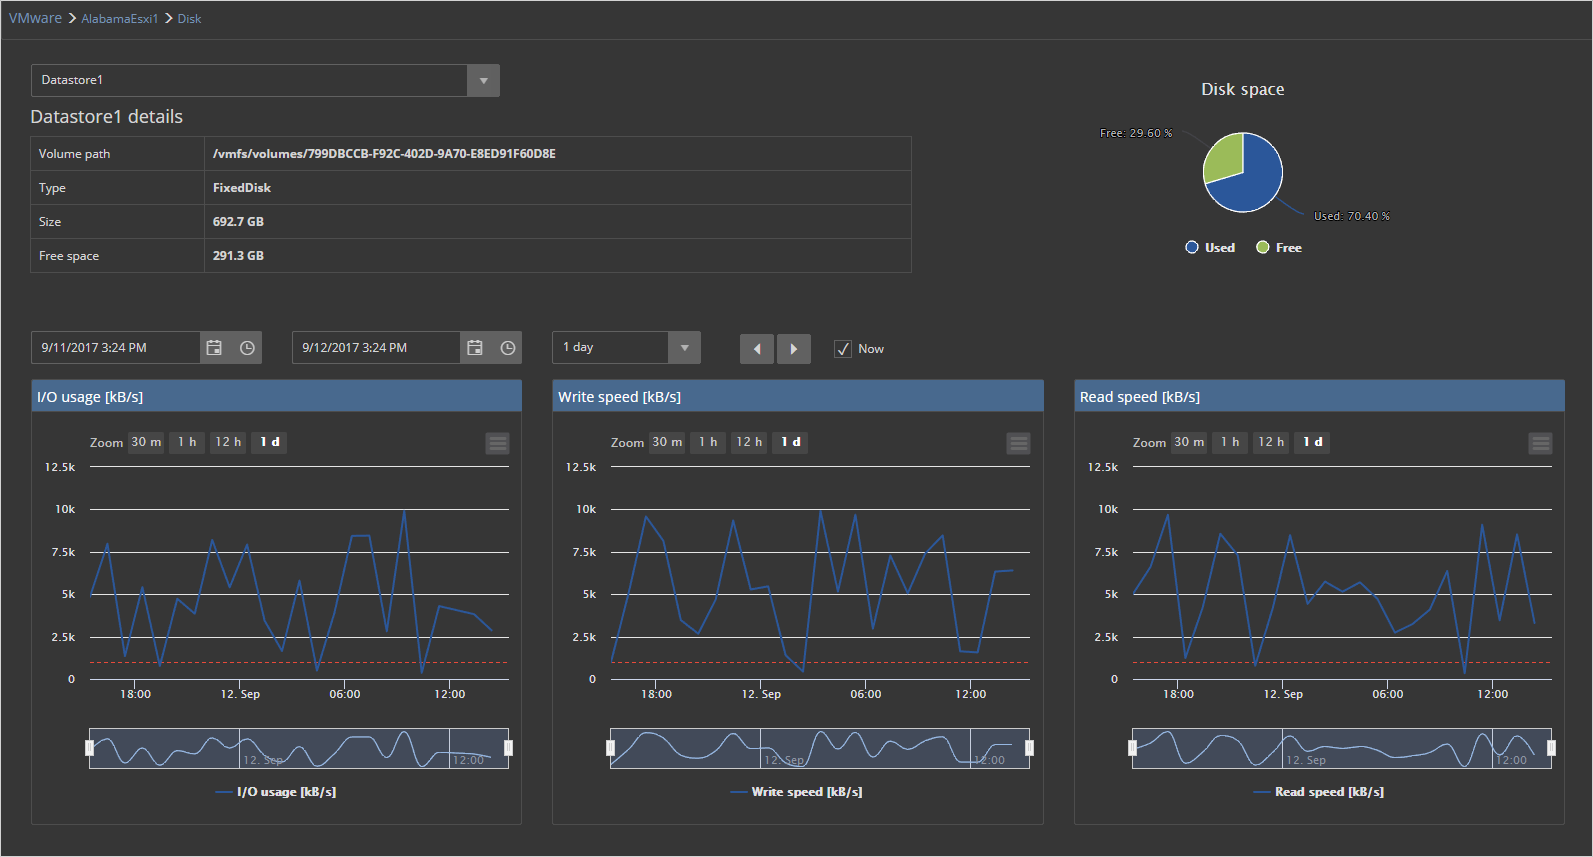
Performance charts allow the historical view of the collected data for performance counters. Each hardware category has its selection of performance charts with additional hardware details for selected performance type – CPU, Memory, Disk or Network.
The memory performance page displays information about memory amount and average usage.
The disk performance page contains information about different disks/data stores along with performance charts for the corresponding data store or disk.
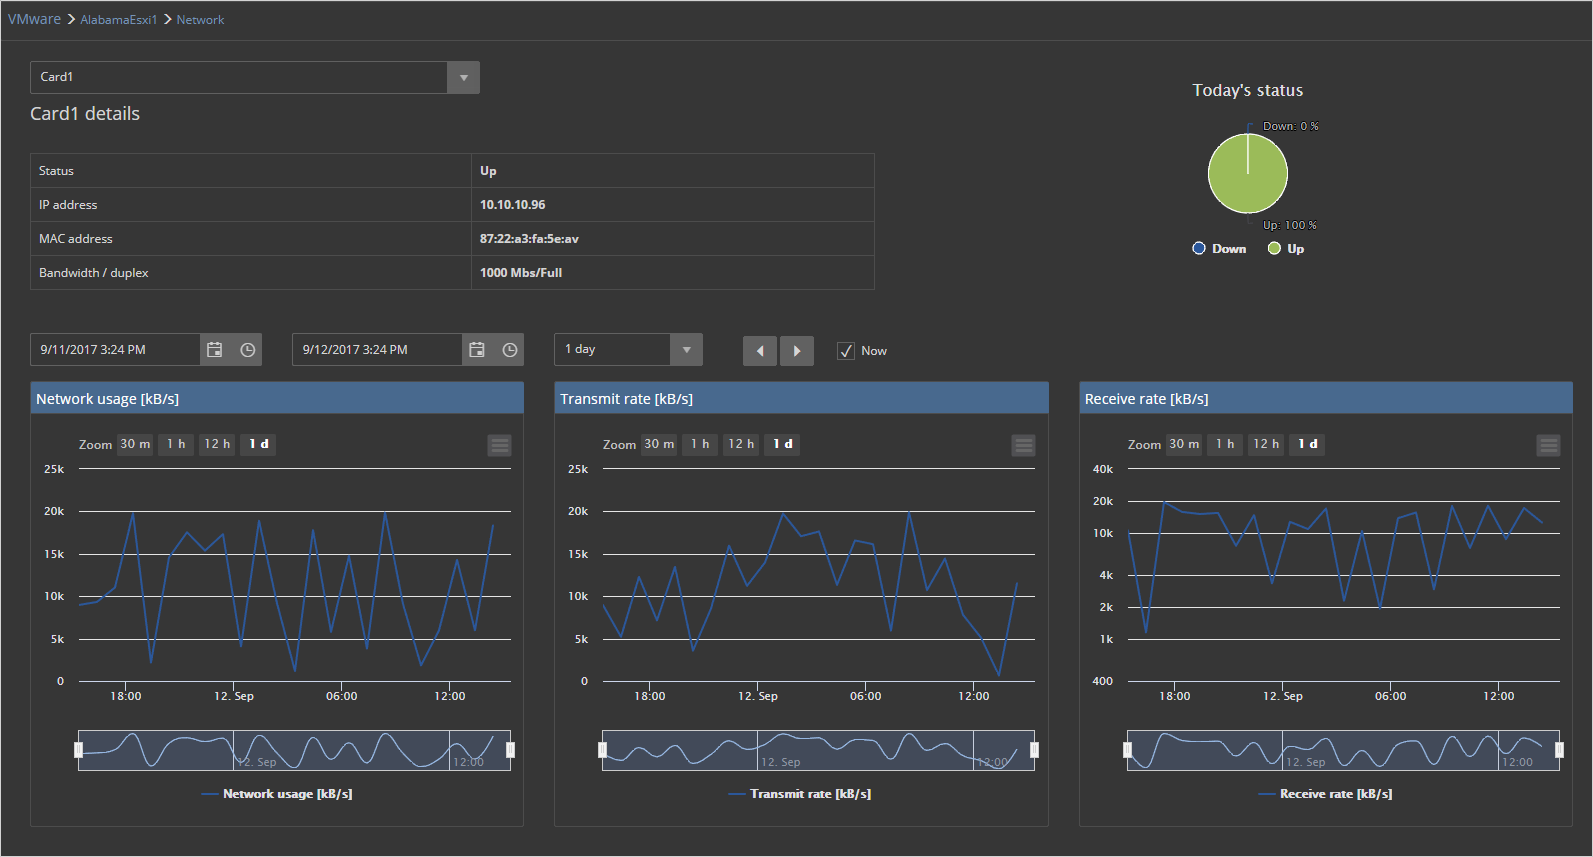
The network performance page has details for individual network cards and belonging performance charts.
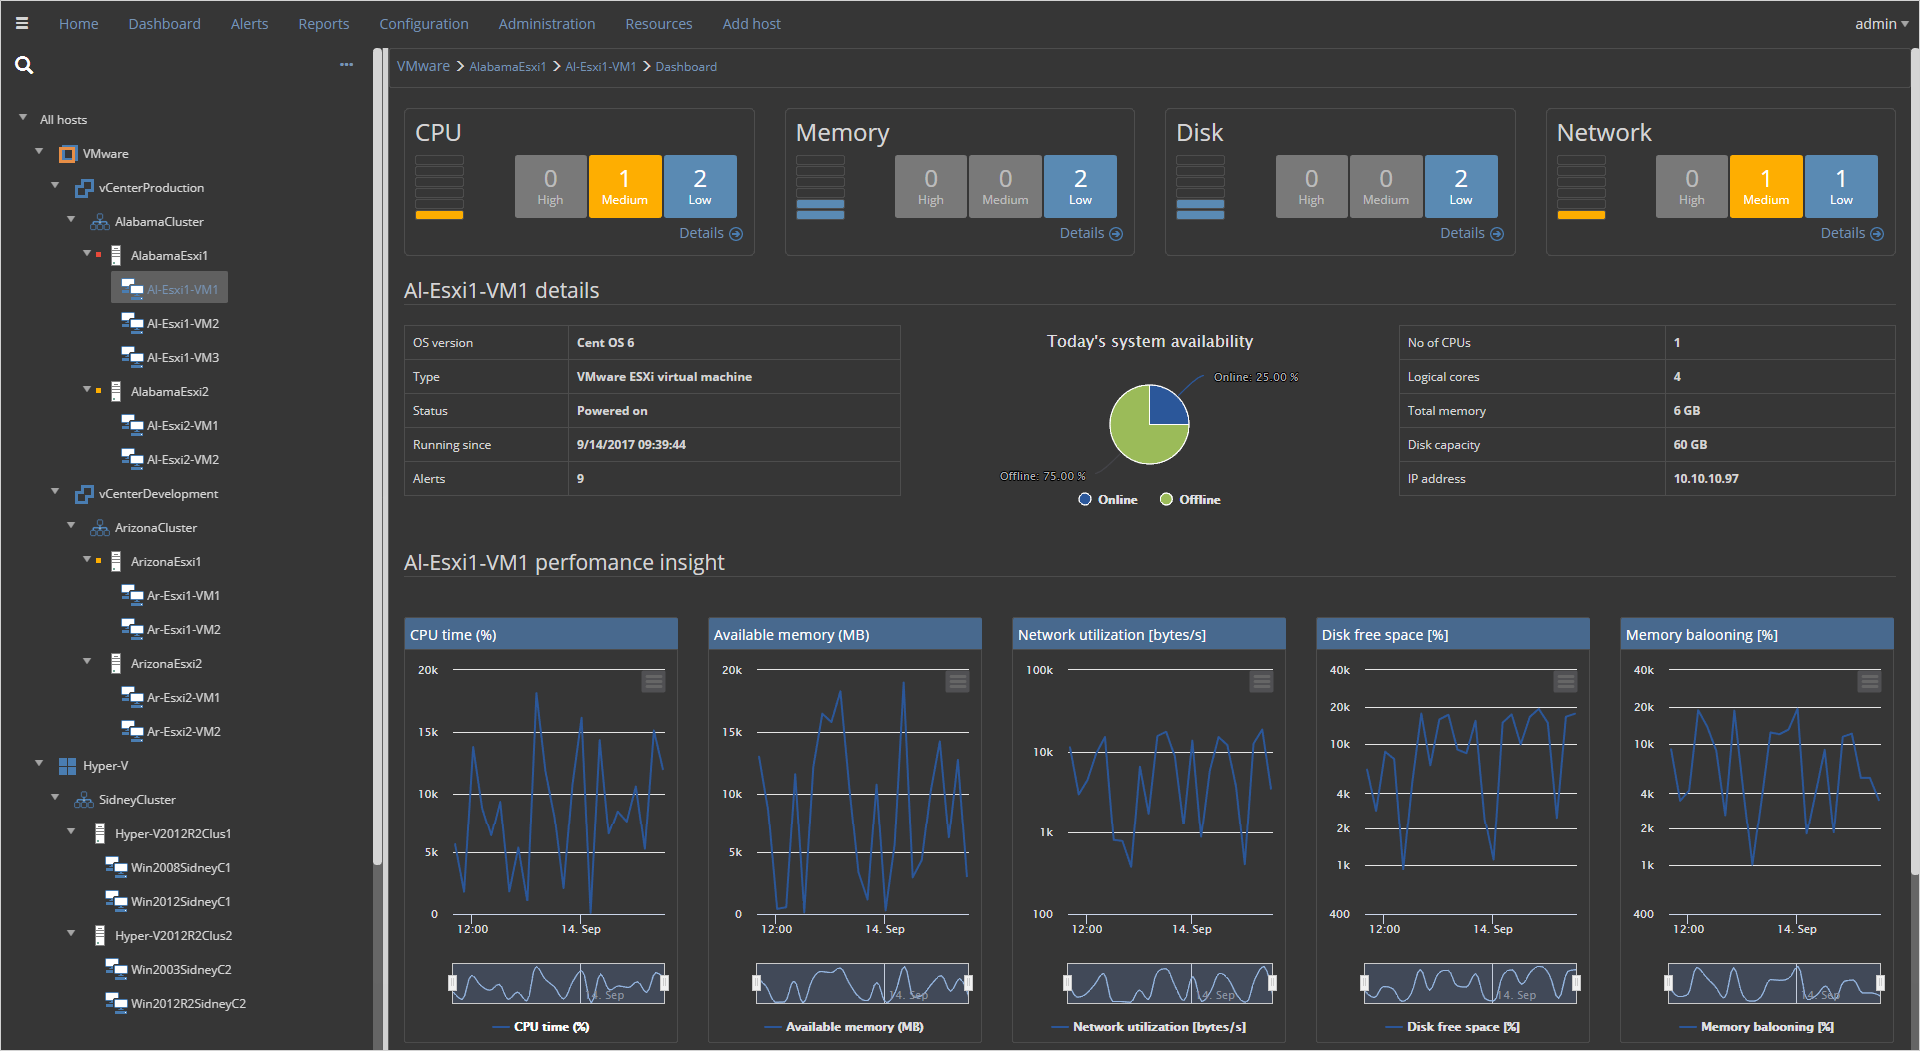
The Virtual machine dashboard uses additional charts to ensure a quick insight into the performance of the selected virtual machine for most important performance metrics.
January 22, 2018


