


In the future release of ApexSQL Monitor 2017, version R1 planned for the late January, we will introduce a Web-based Interface. Below is a sneak peek.
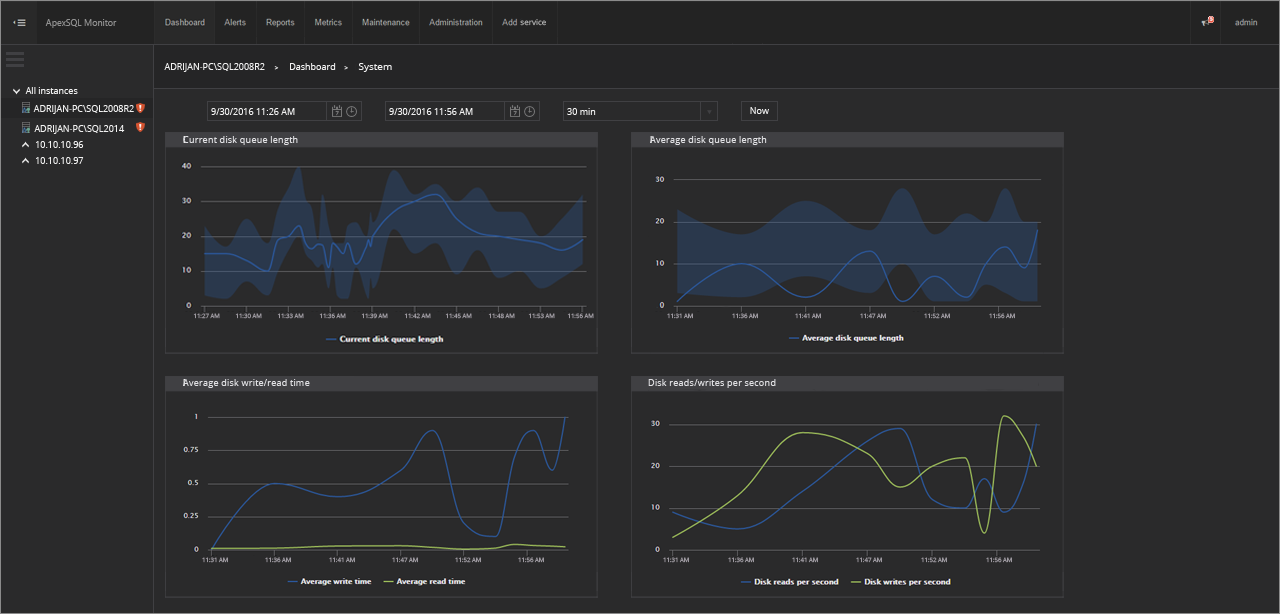
The new dynamic system performance view will provide all necessary information for the monitored instance(s), and their respective metrics.
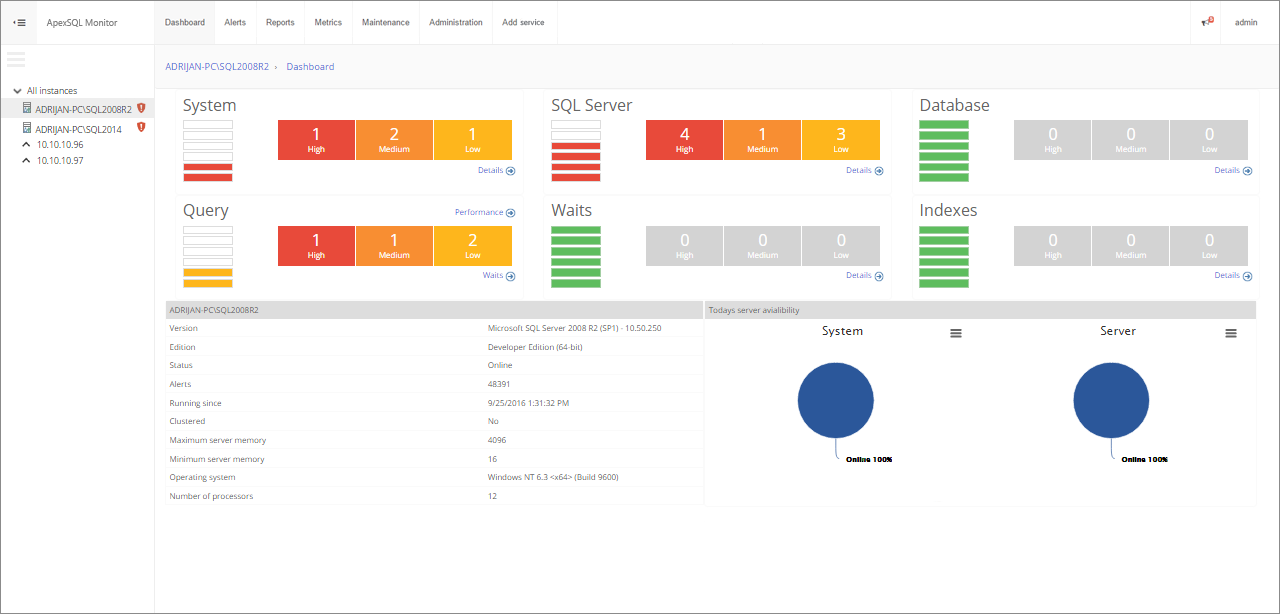
With the improved and redesigned Dashboard overview of the selected SQL servers or Availability Groups/Failover clusters, users can see all of the crucial information (alerts, availability etc.) in the same place.
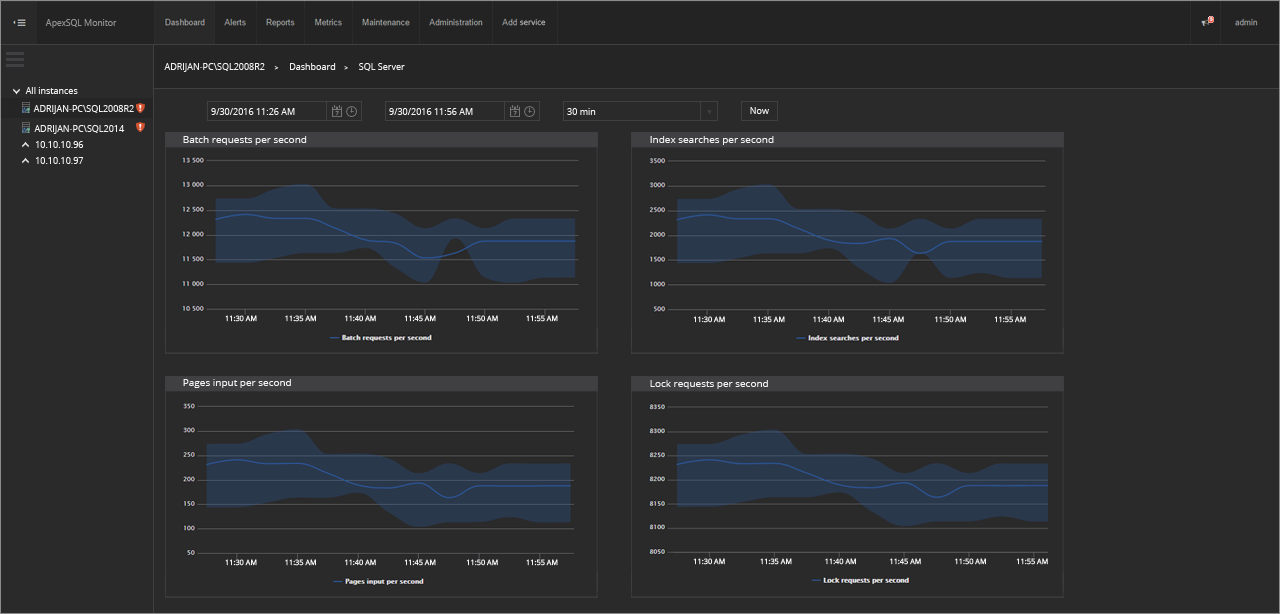
Users can easily monitor SQL server instances performance and determine baselines and analyze the charts for possible issues and bottlenecks.
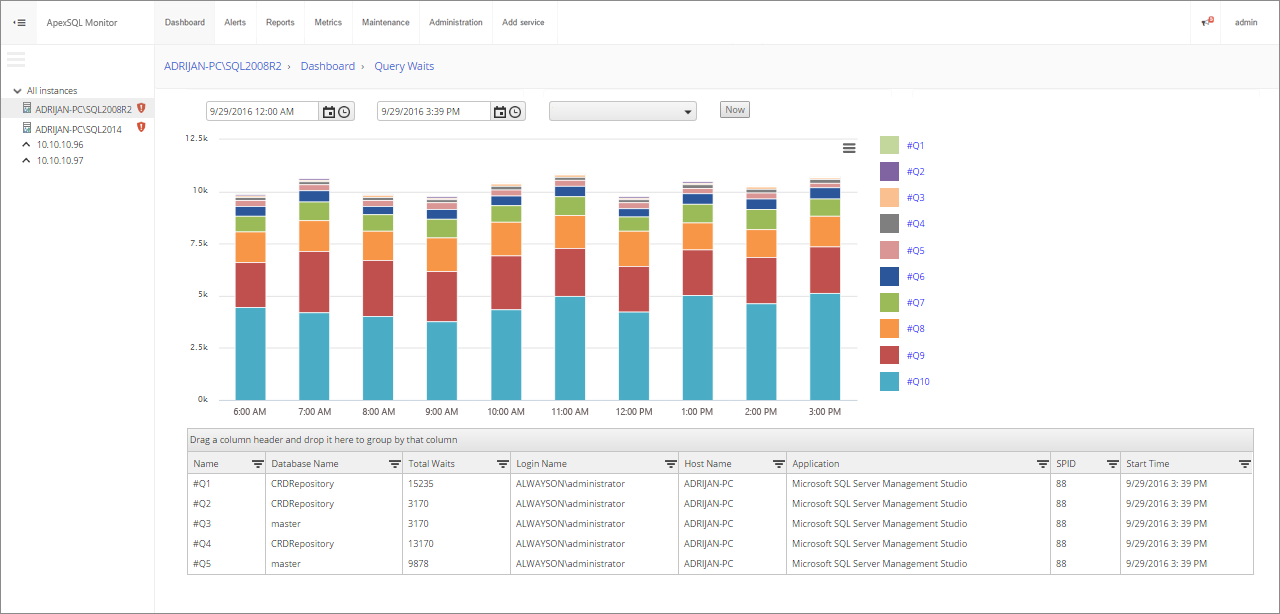
Query waits statistics module shows important information for identifying blocking and slow-running queries.
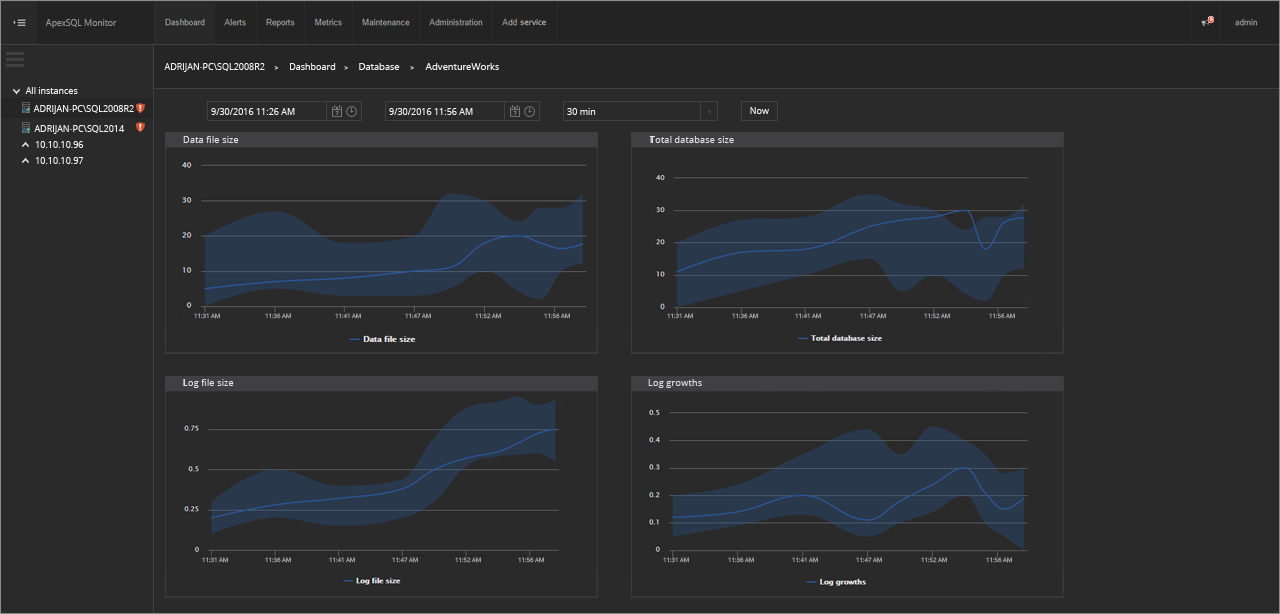
This final view shows varies metrics related to database performance.
October 5, 2016


