


We are excited to announce a new dashboard page redesign including a new panel view for the release of the ApexSQL Monitor R4 which is scheduled for September 2017.
New dashboard
On the new dashboard, you will find improved icons for representing server types e.g. AlwaysOn and server name colors which show the state of SQL Server instance e.g. offline, disabled.
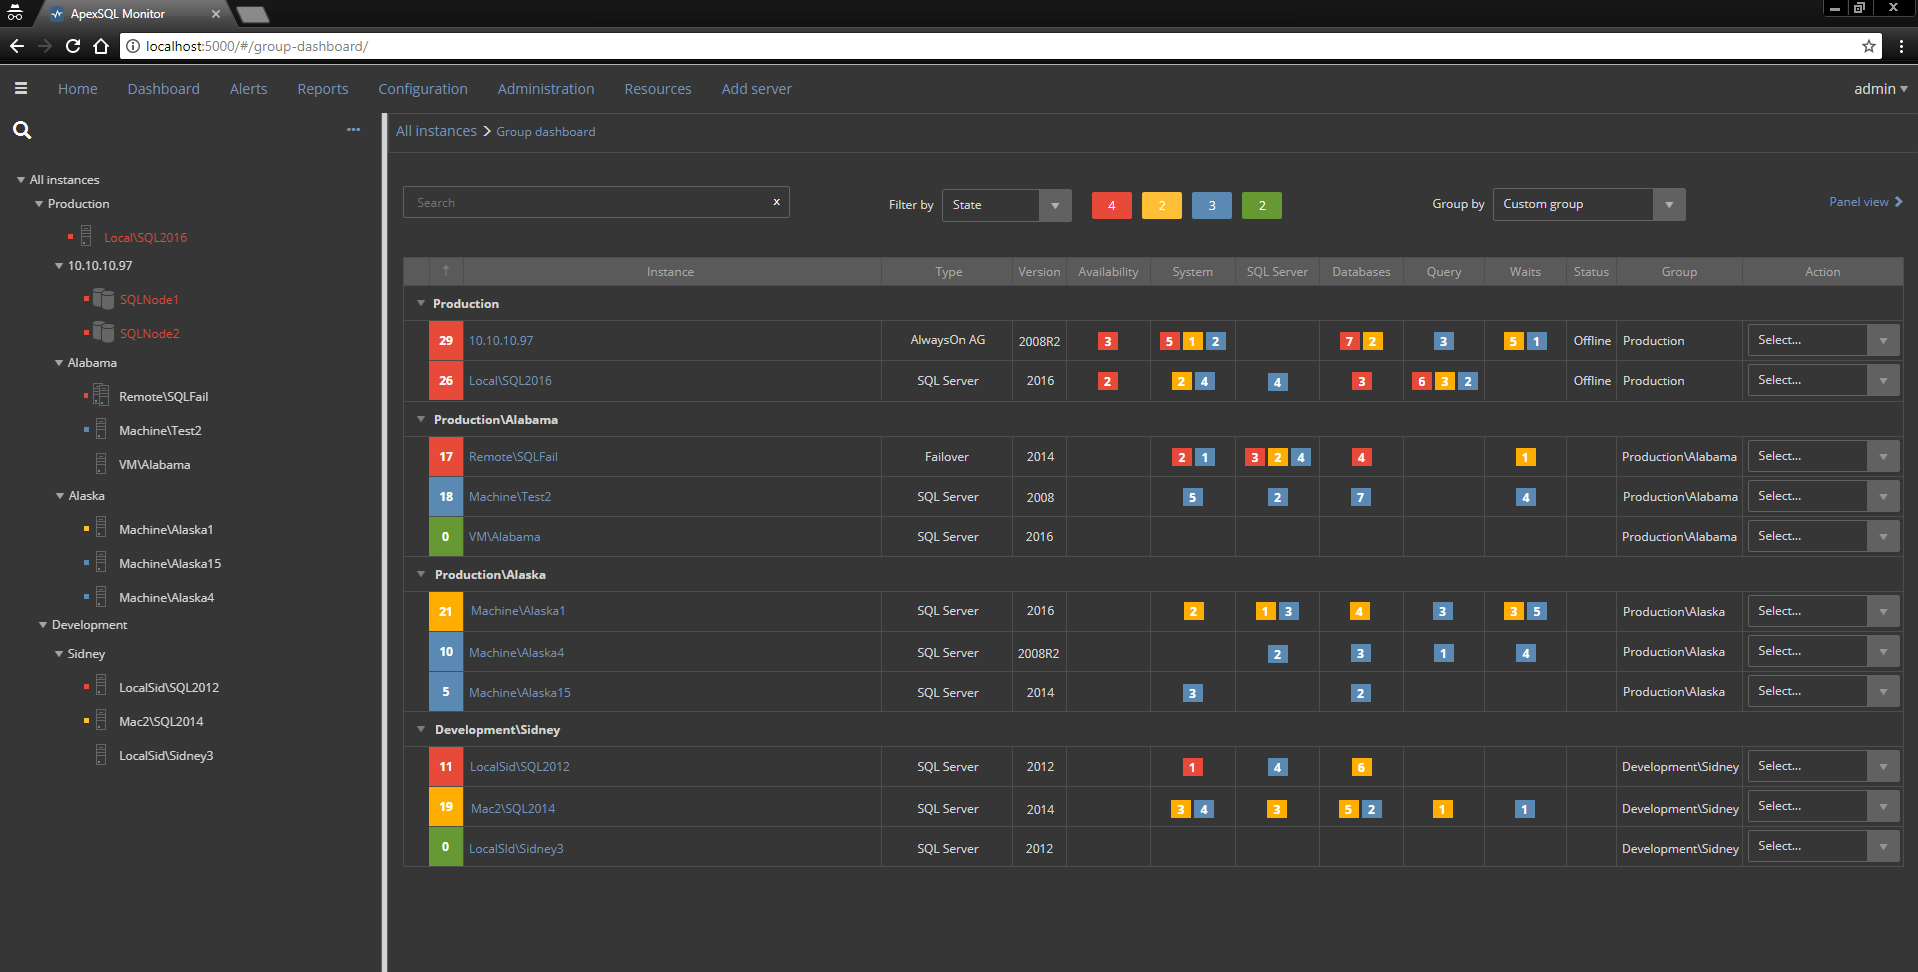
We added new filtering options for the table view:
- Search instance
- Filter table by State e.g. Critical
- Group by – group instances in table by Severity or Custom groups
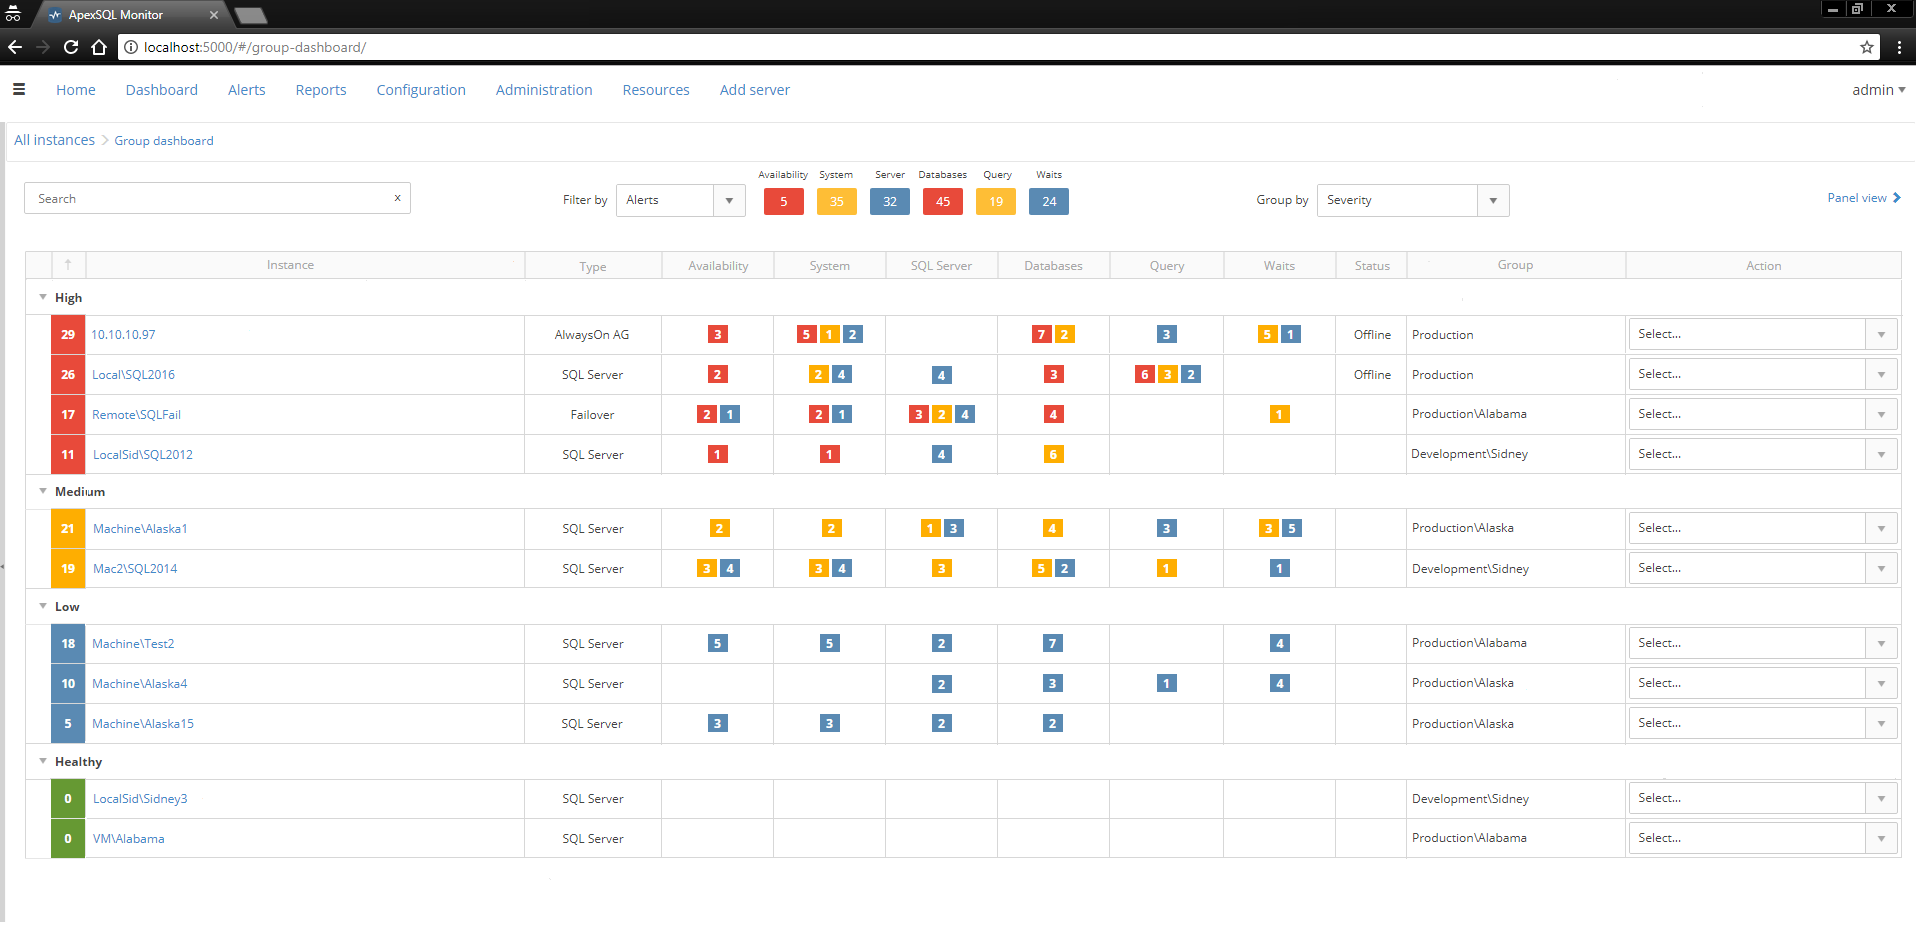
We have also added an additional Group column and improved presentation of alerts per category in the table.
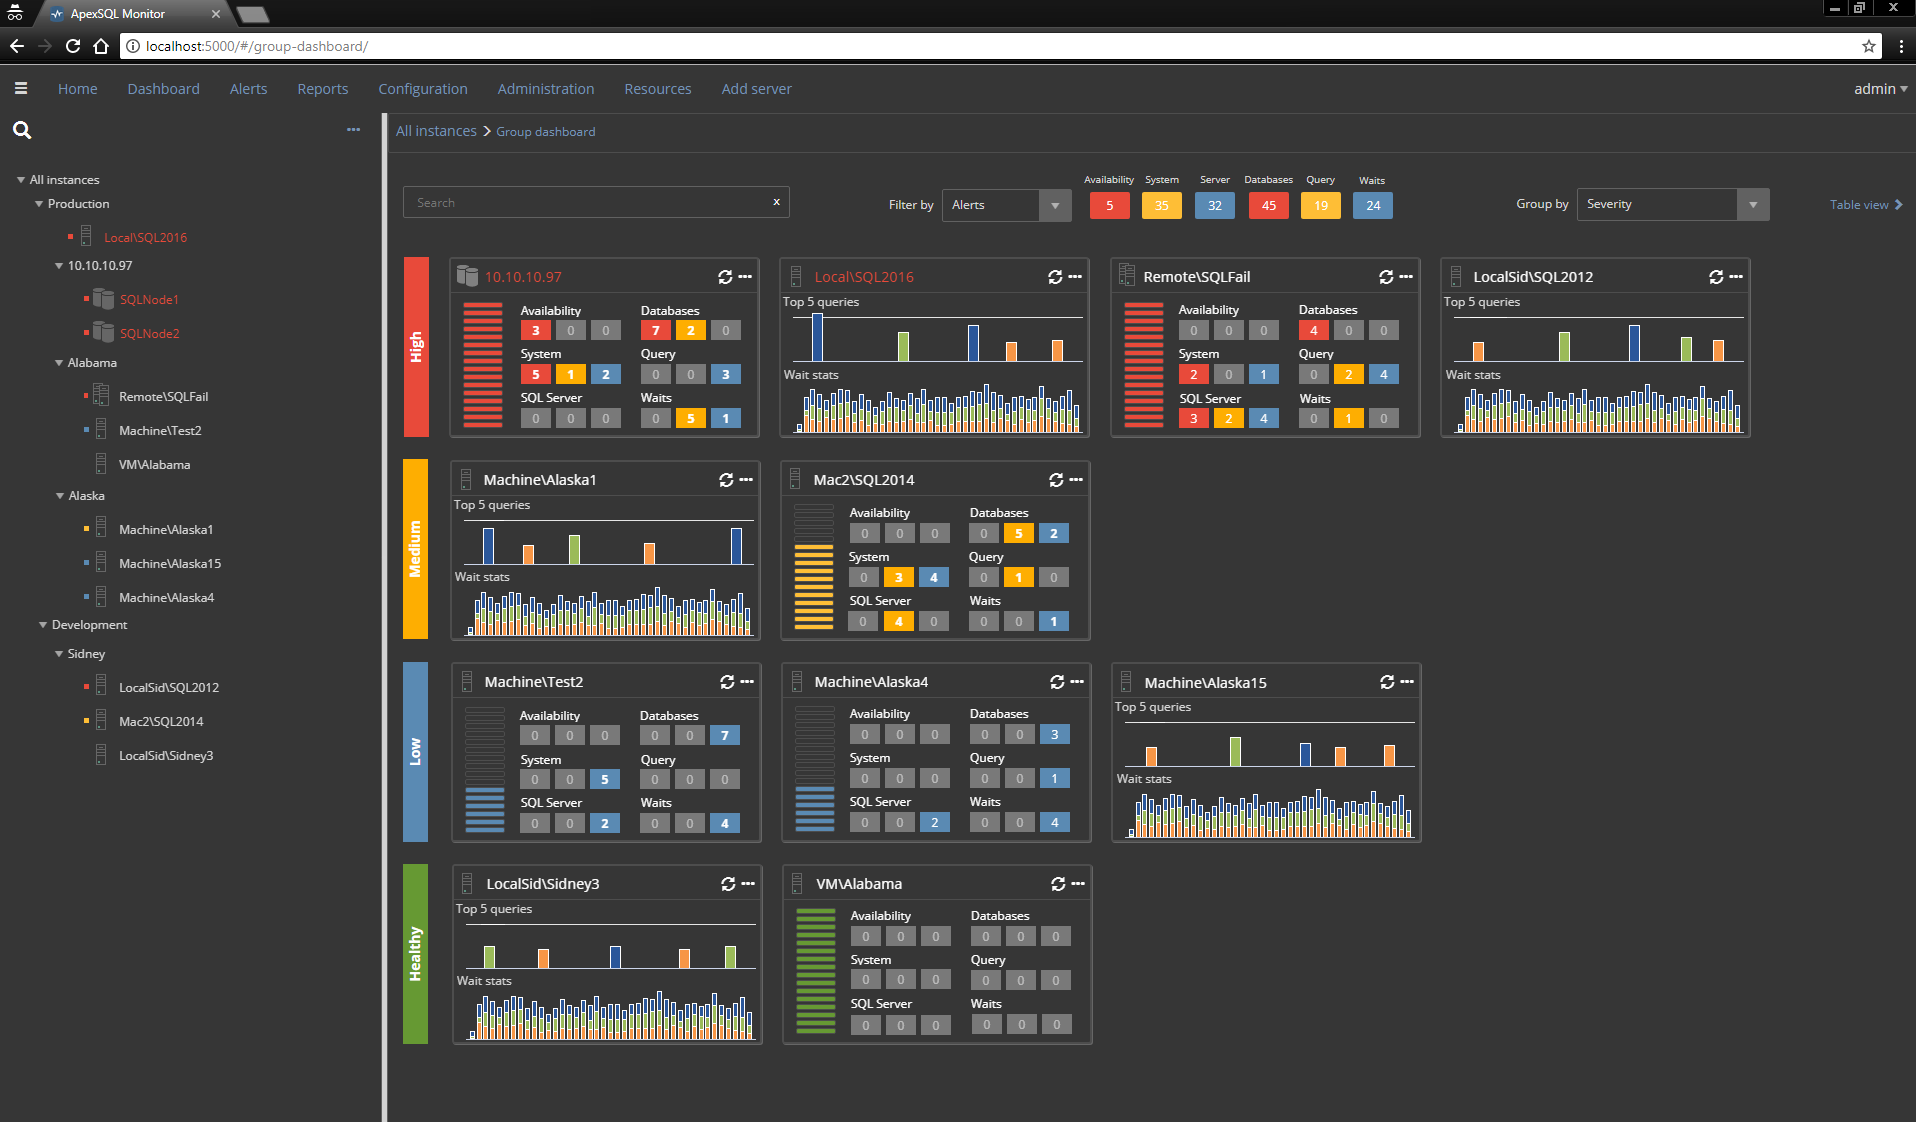
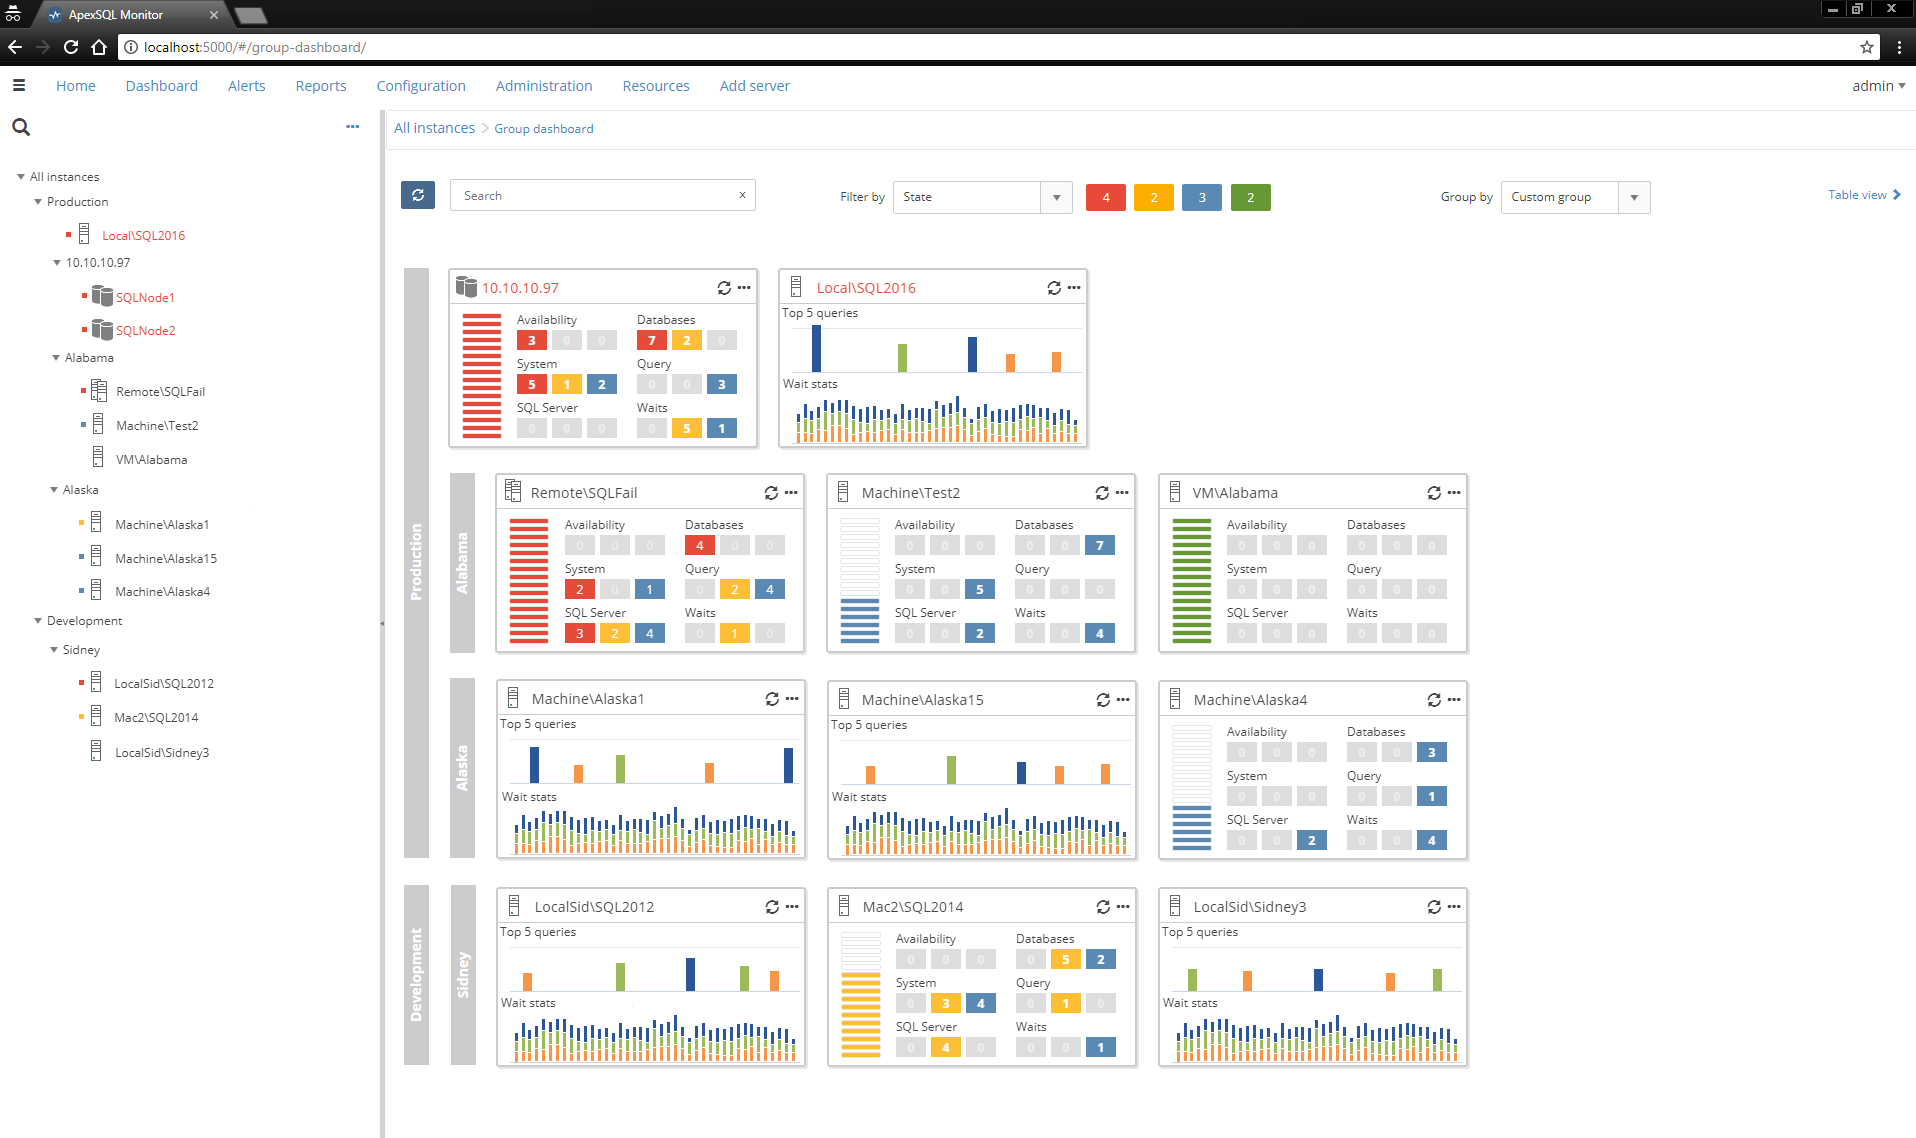
Panel view
Besides the updated dashboard page, we added a new panel view, in addition to the existing table view, to view monitored SQL Server instances.
Besides the State filter we have added a filter by Alerts e.g. CPU which can be changed in the combo box.
On the next image, you can see how panels are grouped by Custom groups e.g. Production/Alaska.
August 24, 2017


