In the new version of ApexSQL Monitor we are introducing a totally re-designed web based user interface and lots of new features and improvements
Web based interface
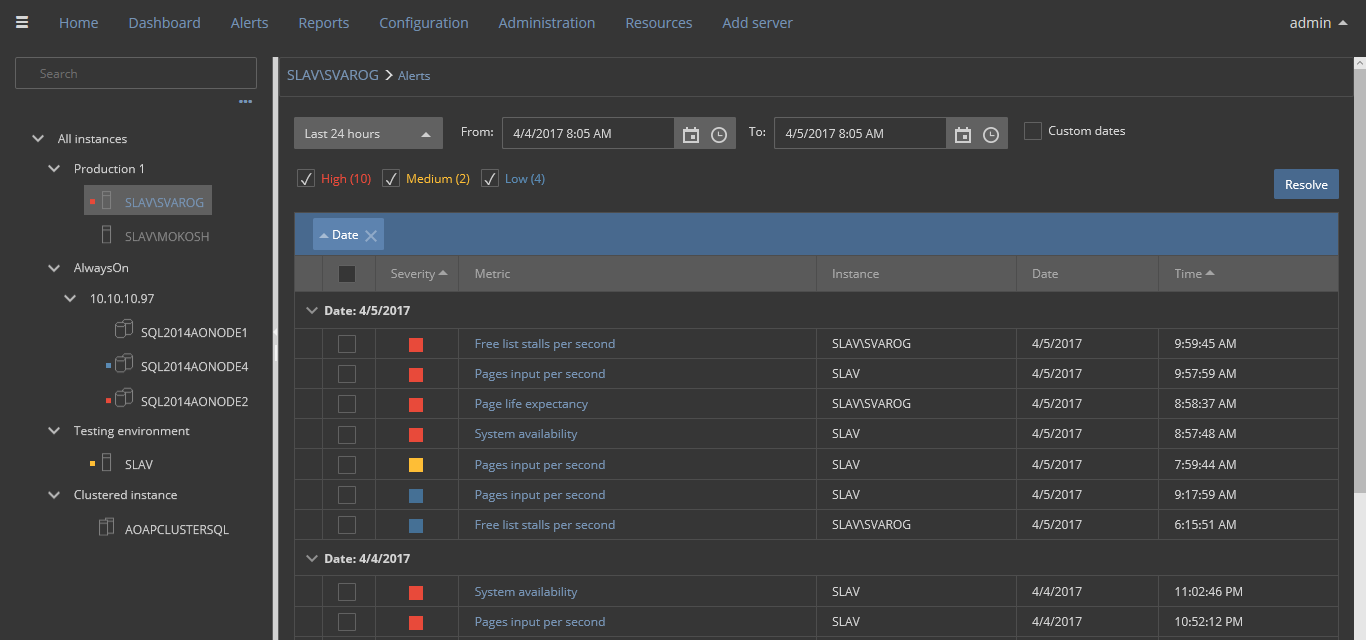
Starting with 2017 R1 version, ApexSQL Monitor is a web-based performance monitoring and alerting tool.
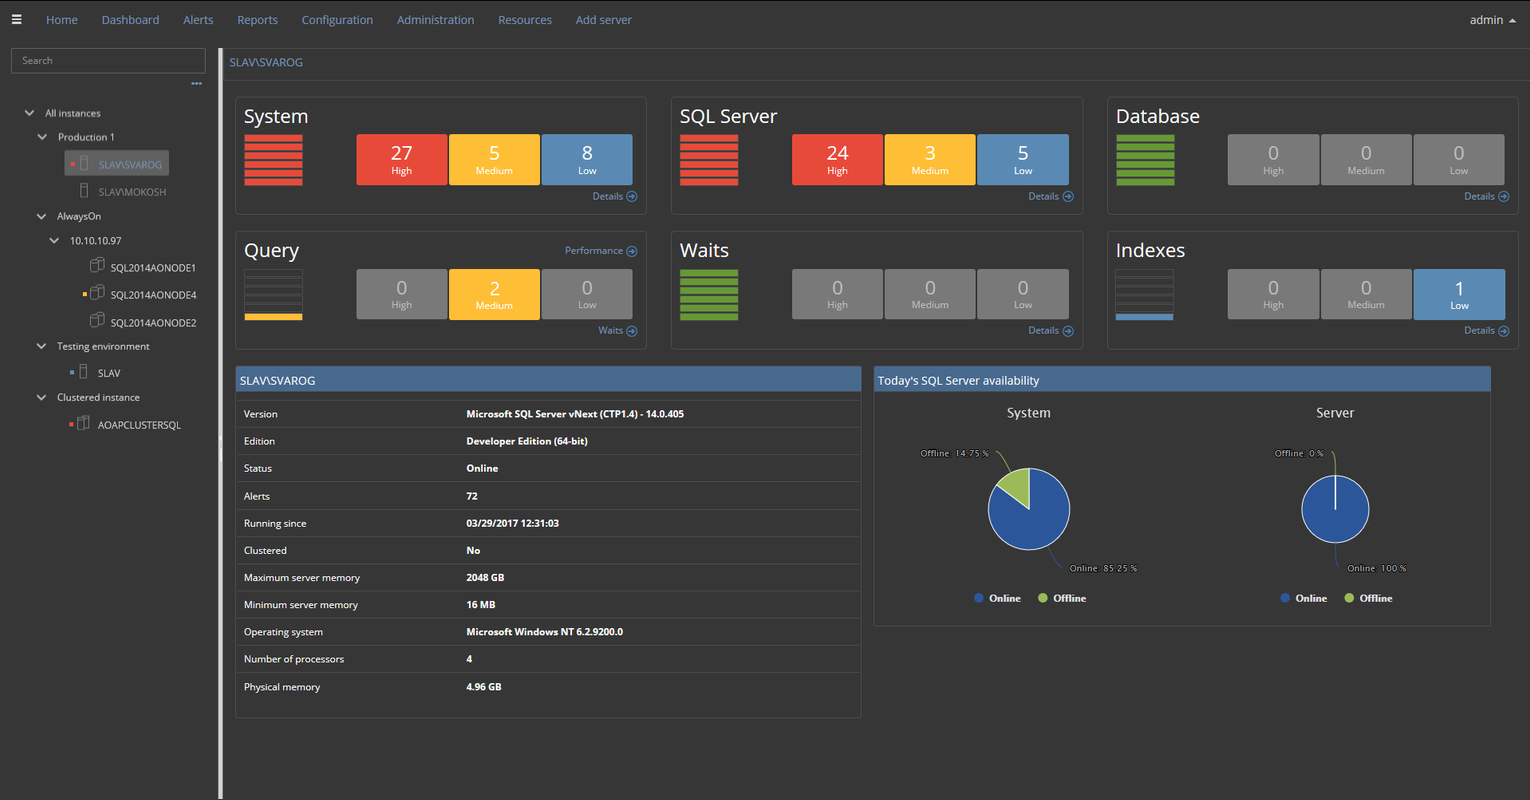
ApexSQL Monitor features a redesigned SQL Server instance dashboard to ensure that the most critical information regarding the SQL Server and system performances are accessible to the user at a glance
The dashboard provides:
- A high level information about the system and SQL Server state
- Alert information and monitored instances availability
- The ability to drill down directly to any critical sub-part for problems identification and troubleshooting
Graphical presentation of performance metrics with historical data
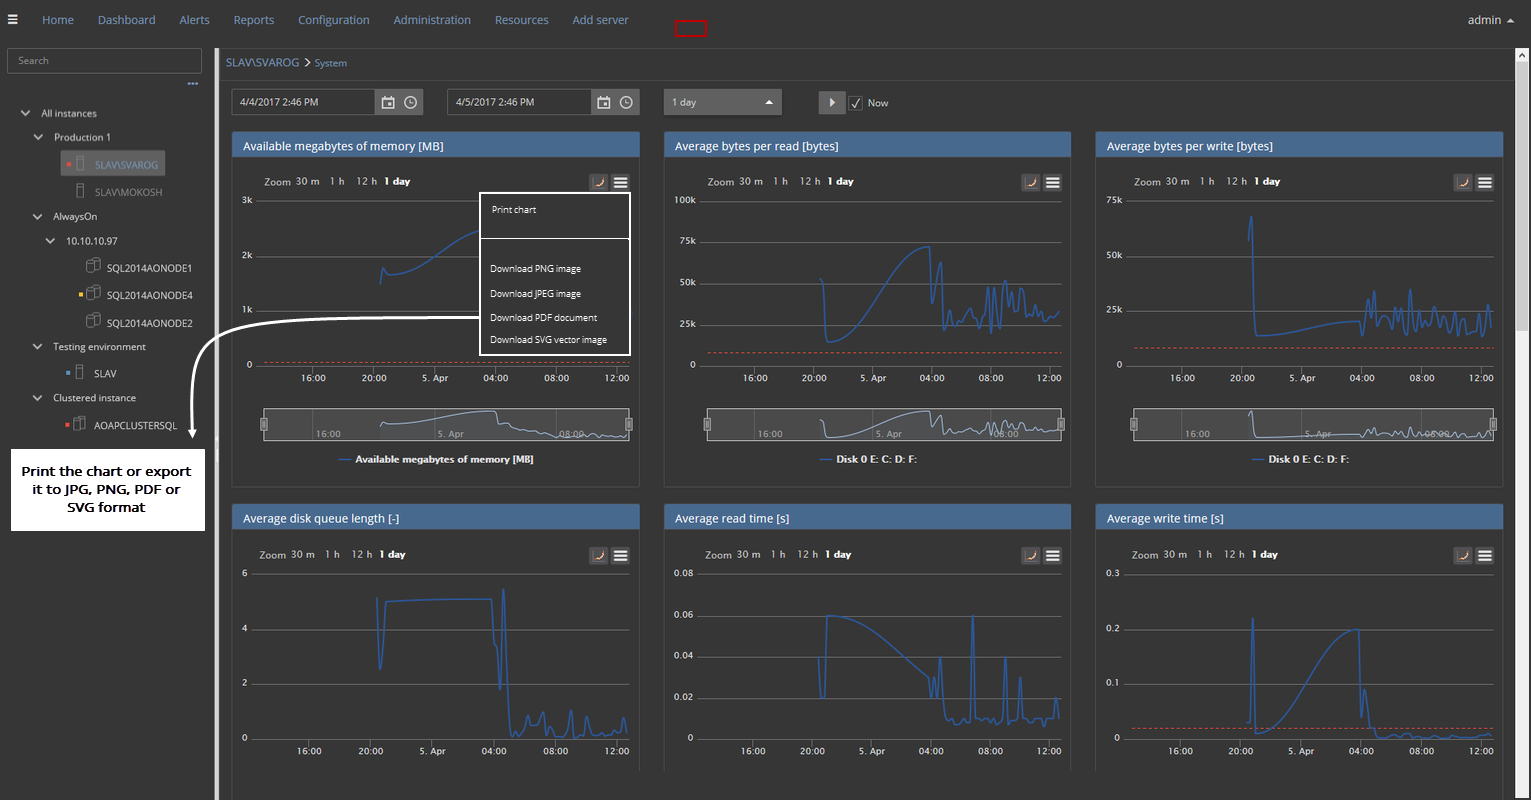
ApexSQL Monitor can chart the most important system, SQL Server and database metrics. The new web interface allows some additional benefits like printing the chart or exporting it to image formats like JPEG and PNG, document format like PDF and even to a vector based graphical format like SVG. Each chart can be zoomed out to a full screen size providing a plenty of details. Charts can also display historical data for any selected period of time
Baselining
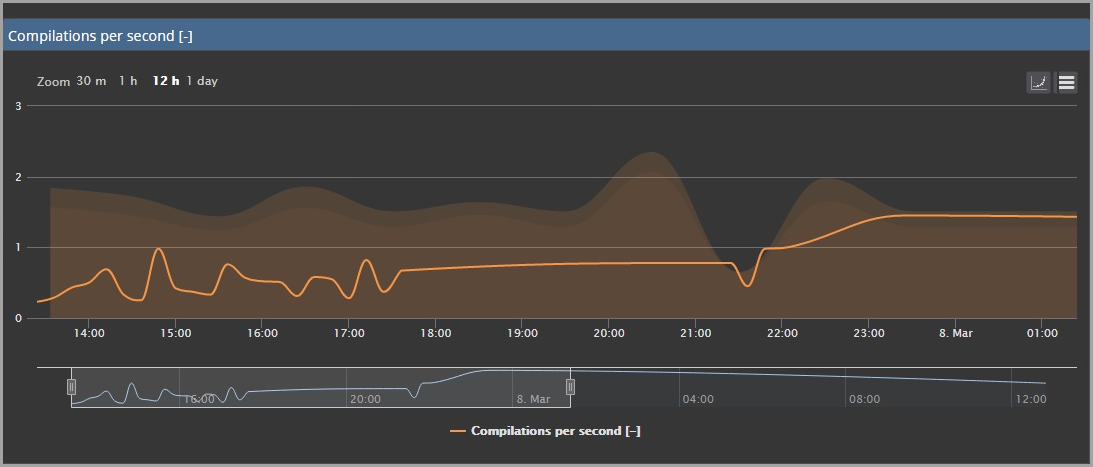
The baselining feature graphically conveys the calculated baseline values and alert thresholds and presents them directly in charts. In the new web interface, the baselined chart can also be printed or exported to any of JPG, PNG, PDF and SVG graphical formats
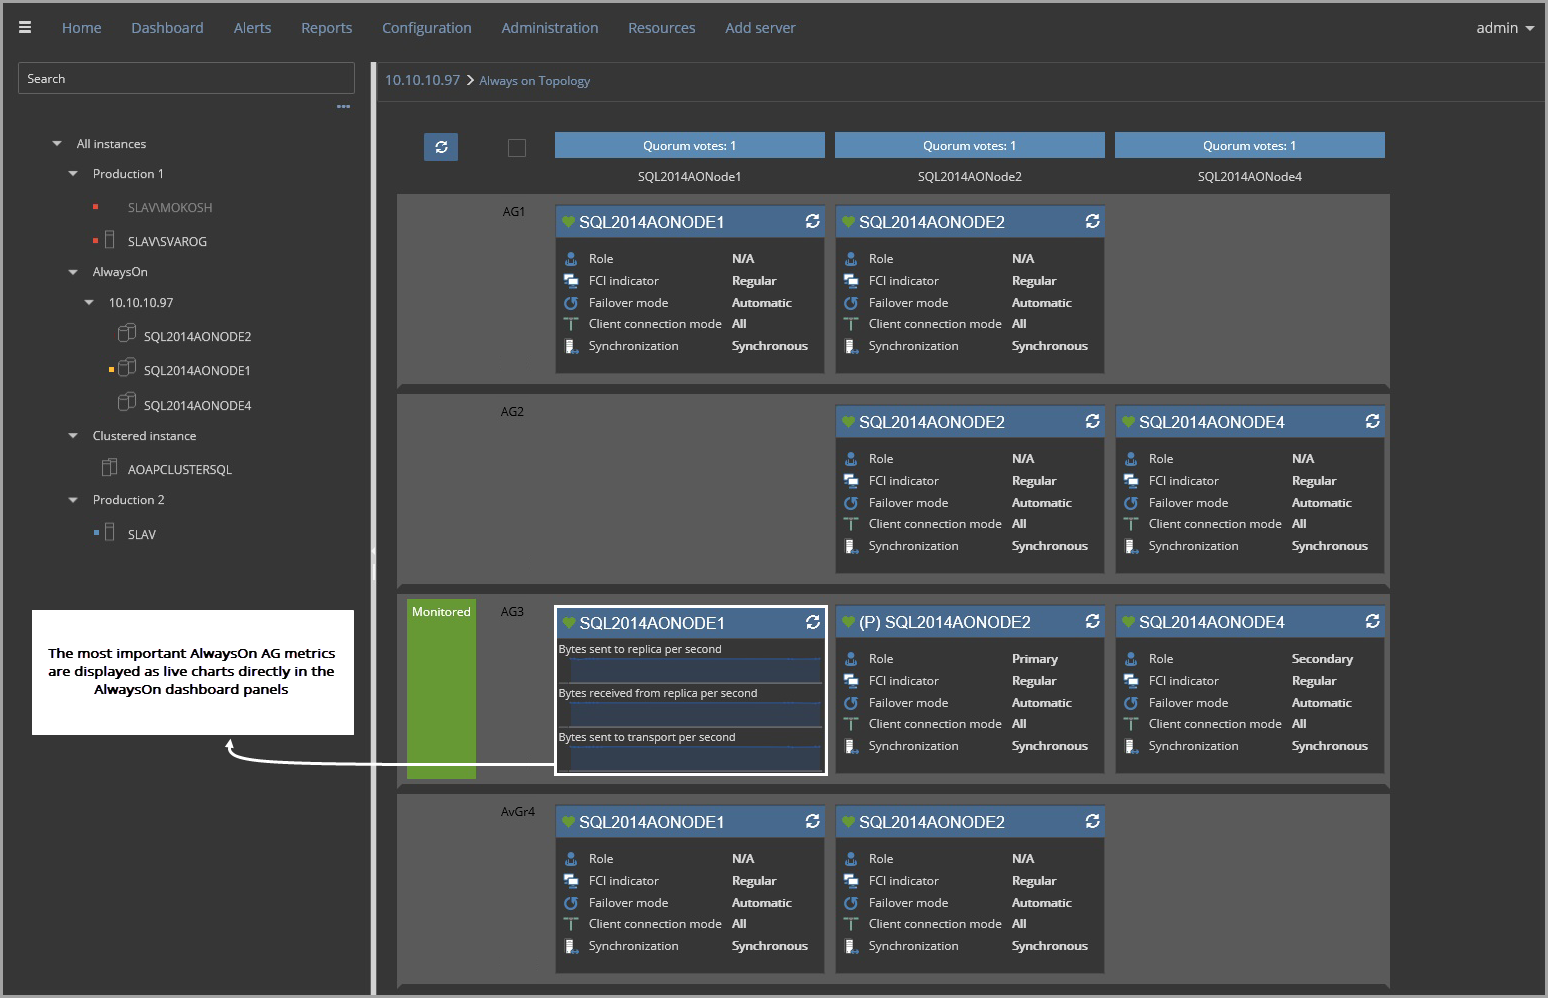
AlwaysOn topology dashboard
The new graphically redesigned AlwaysOn high availability group dashboard can display the full topology of all AlwaysOn Availability Groups hosted on the same Windows Server Failover Cluster (WSFC) environment including:
- WSFC environment details such as Quorum votes
- the ability to resolve and display the whole WSFC and AlwaysOn structure
- the most important AlwaysOn metrics are now displayed as live charts directly in the AlwaysOn dashboard panels
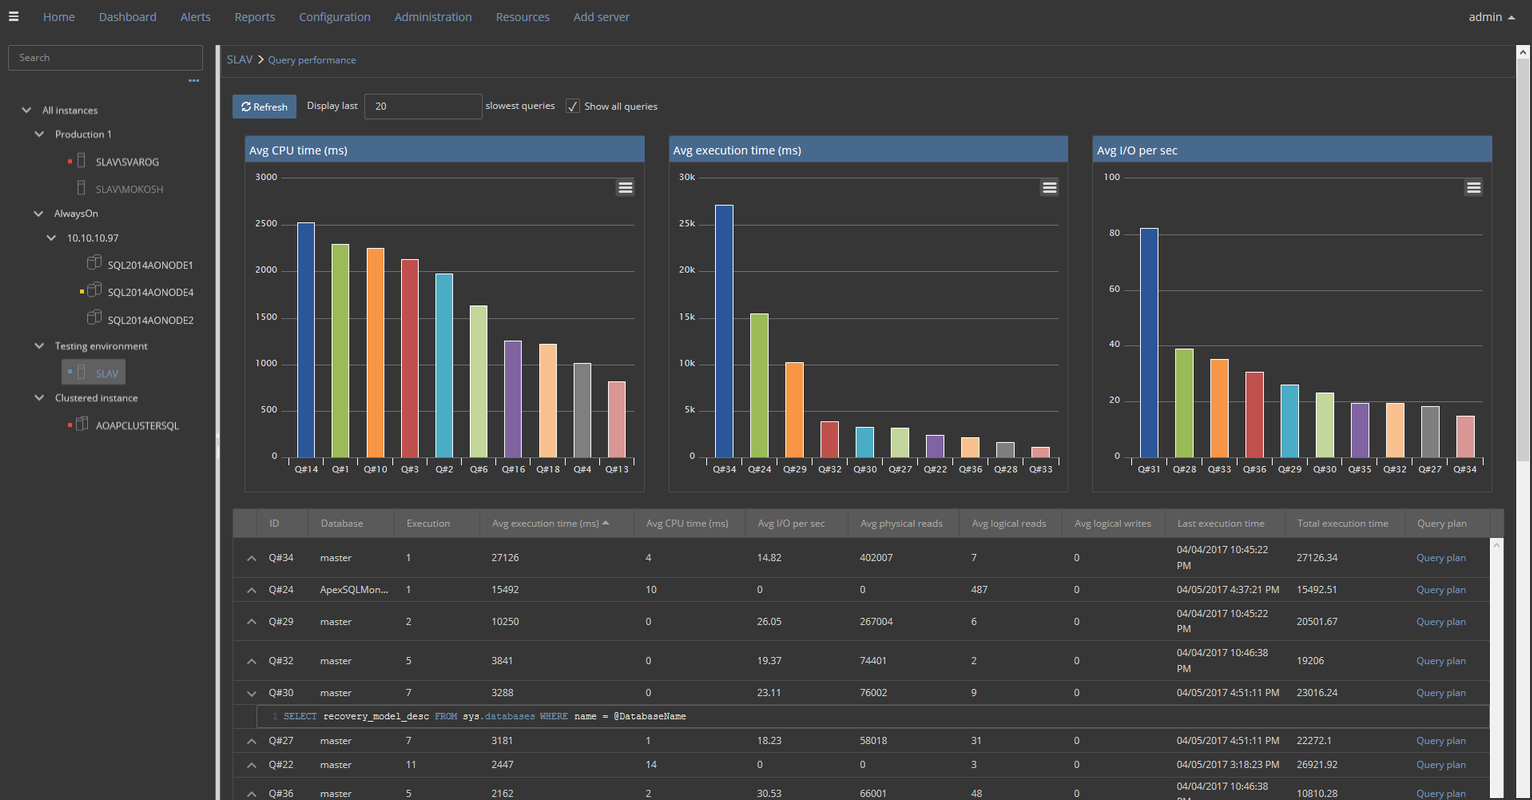
Query performance
ApexSQL Monitor can monitor queries for the potential performance degradation using the following parameters
- time needed by a query to accomplish the execution
- average CPU usage
- average I/O activity
Printing the chart or exporting it to JPEG, PNG, PDF and SVG graphical formats is also added here as a new feature in web interface
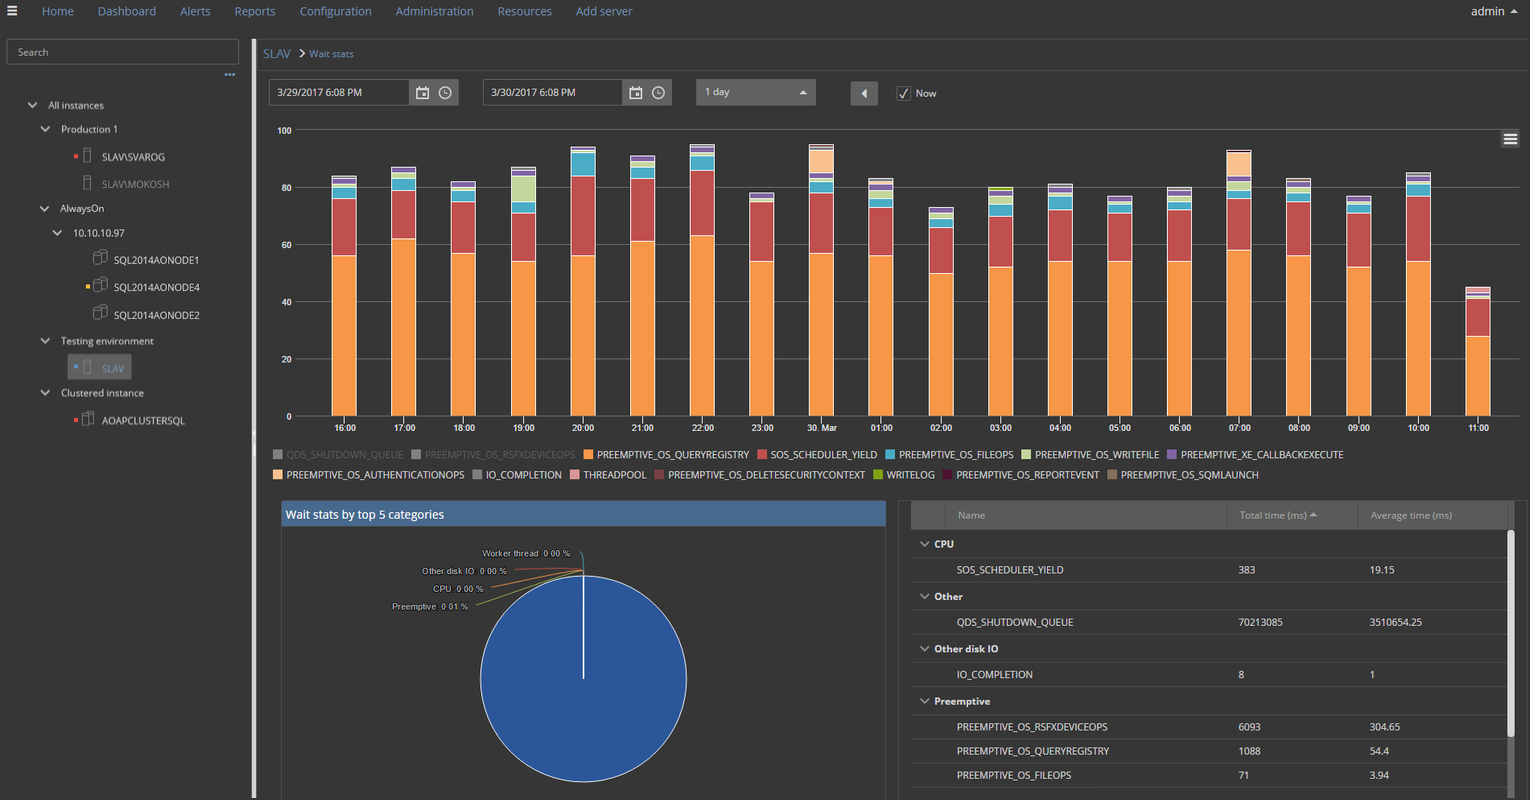
Wait statistics
ApexSQL Monitor allows constant tracking of SQL Server threads by collecting the wait statistics. It is capable of tracking over 500 different SQL Server wait types, including the ability to display historical analysis and drill down to the very root cause of the performance problem
The redesigned web interface provides not only improved the layout, but also added drill down ability by clicking at the bar of interest. This will display more precise wait stats data up to the time frame as small as 30 minutes or by selecting the date/time and period to display from the available drop down menus
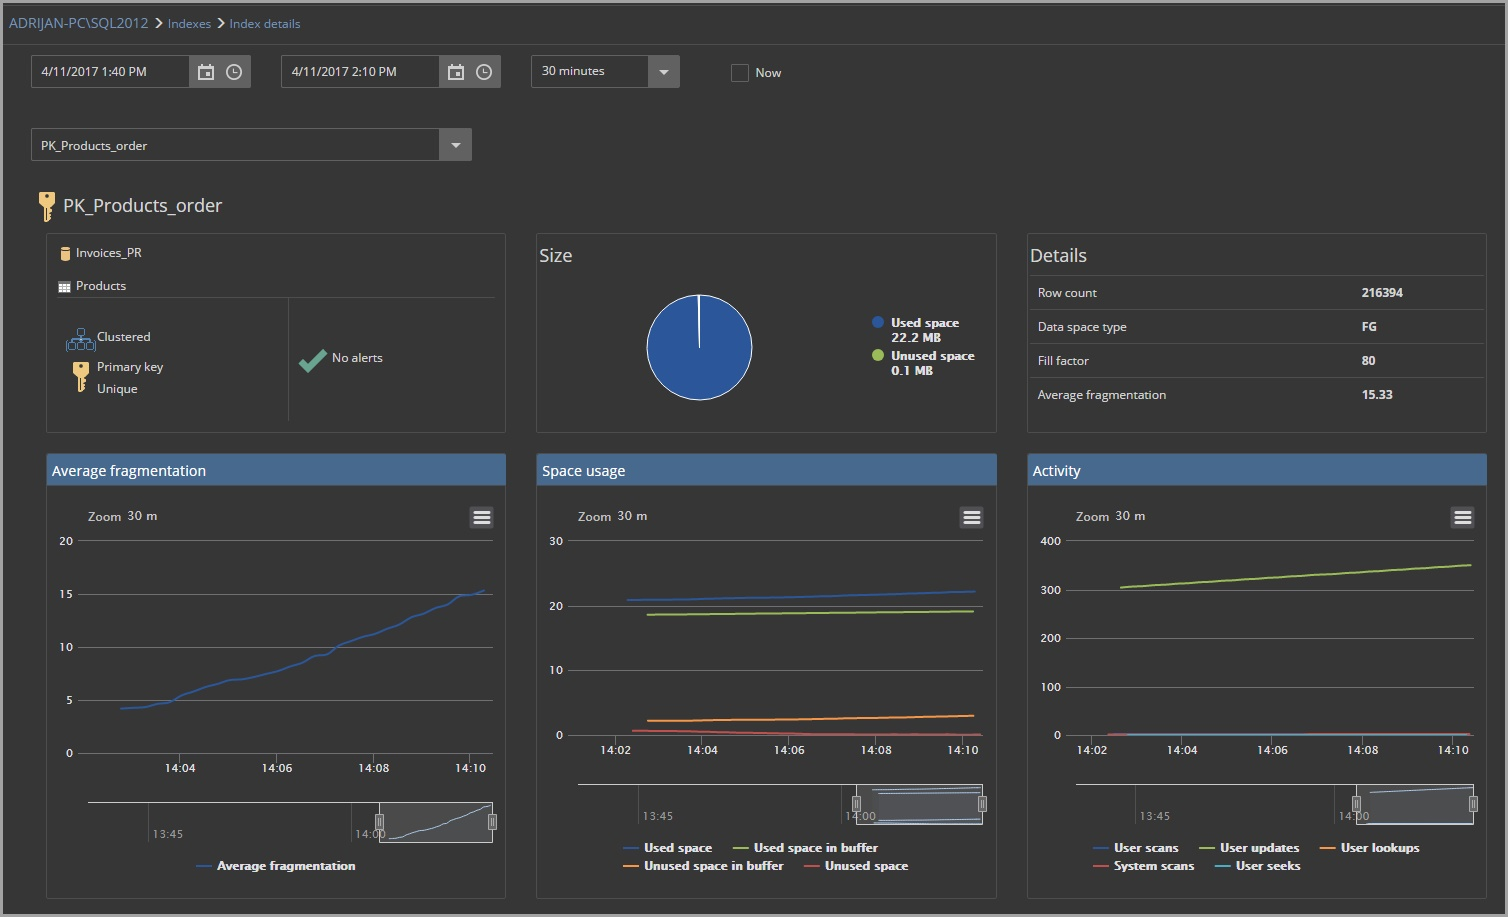
Index monitoring
ApexSQL Monitor can now track database indexes. The newly designed interface in ApexSQL monitor provides all the necessary index performance data graphically conveyed in charts for analysis and resolving performance issues caused by bad and unoptimized indexes
Highly configurable performance metrics
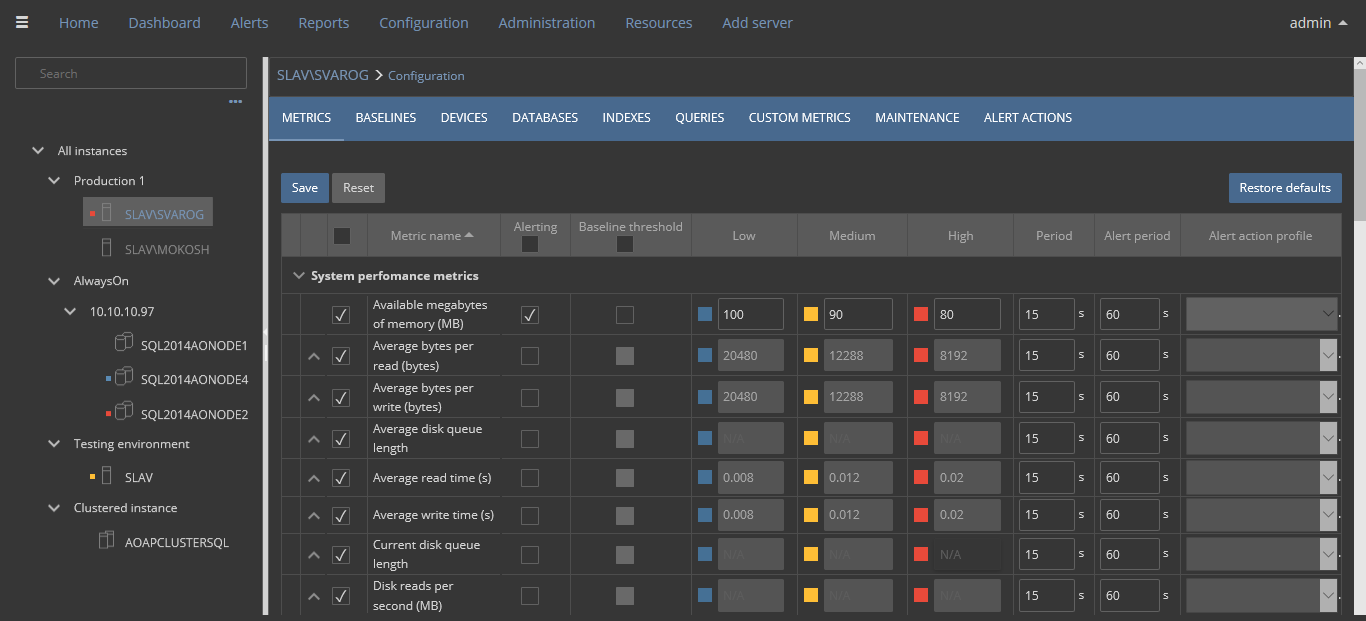
ApexSQL Monitor provides users with the ability to configure what and how to monitor. The granular and configurable performance metrics are easy to use. It allows the following to be configured:
- metrics thresholds
- monitoring configuration for individual devices and databases
- alert actions
- baselining
- custom metrics
- alert actions
- maintenance periods etc.
The redesigned interface has merged the email profile drop down menu into the alert actions drop down menu to allow user a single place configuration and the single place selection for improved usability
Custom reports
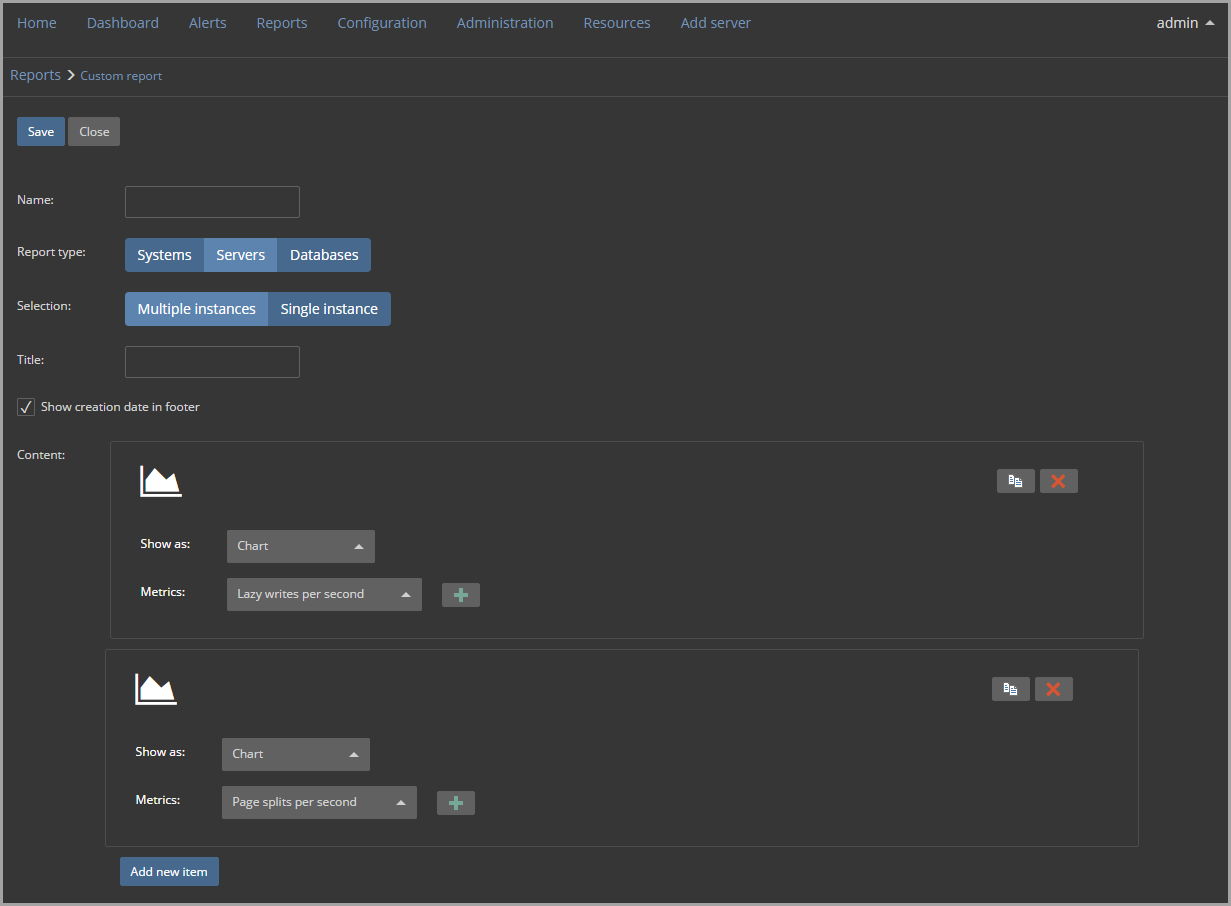
The new Custom reports feature allows creating and exporting user designed reports on any performance counter monitored by ApexSQL Monitor as well as on any of user designed custom metrics
March 1, 2017


