


ApexSQL BI Monitor installation wizard is designed to minimize user interaction
Installation
The first step is the welcome screen
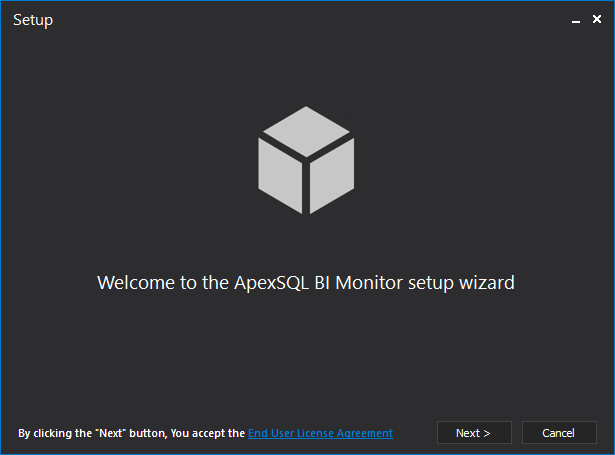
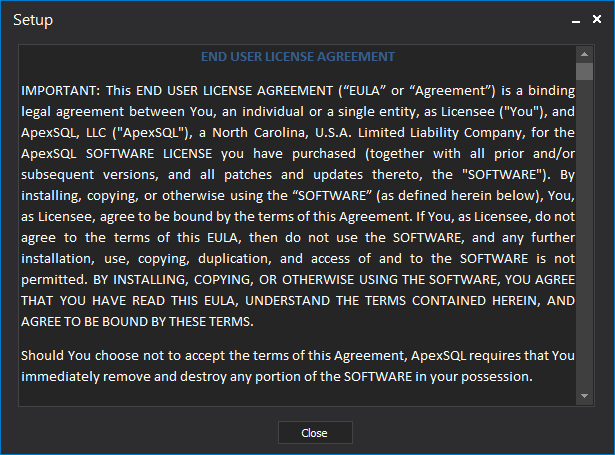
Here, users can also review the ApexSQL LLC EULA
Next step shows users the default file path that installer will use to install the application
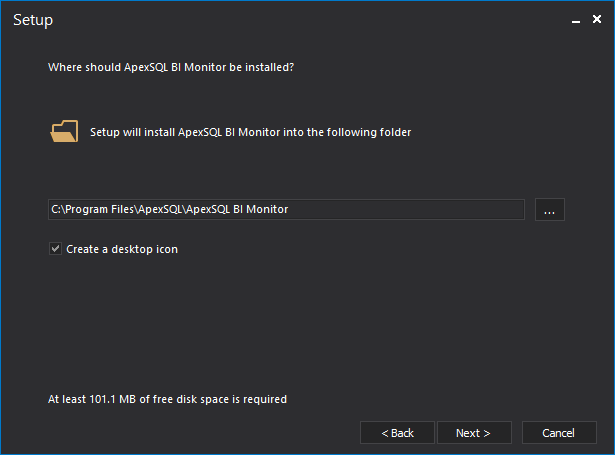
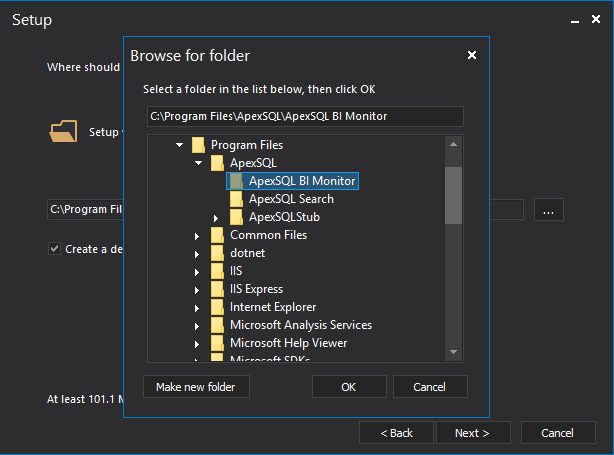
This step also offers an option for the user to change the default installation folder where it is required
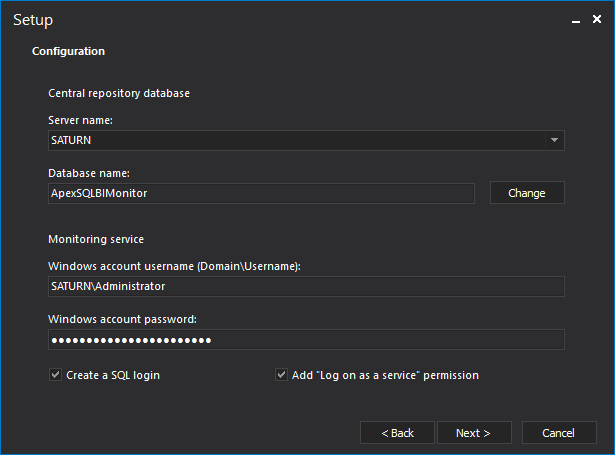
Configuration
The Configuration step is the only step that requires user interaction. Here, SQL Server that will be used to host the central repository database should be chosen by the user. Also, the Windows account and the associated password that ApexSQL Monitor service will run under must be supplied by the user
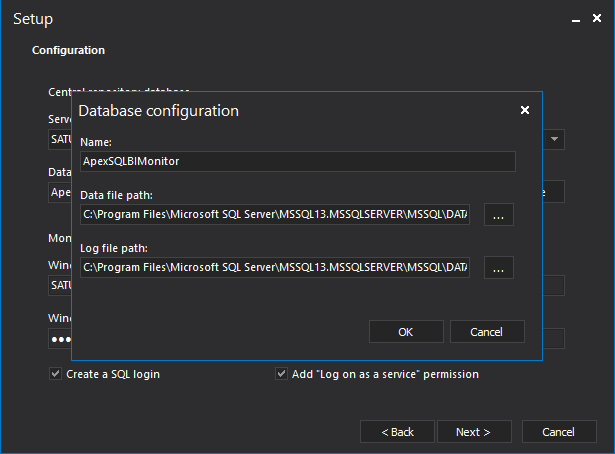
As an option, the default name of the central repository database, as well as the path where its data and log files will be stored, can be configured by the user
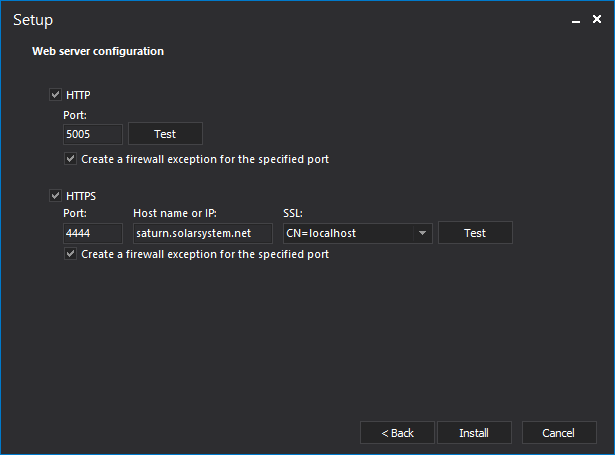
The next step can be used for the web server configuration. The default values are provided for the standard HTTP protocol. The user intervention is optional here in case that change of the default parameters are required, or in case that the user wants to configure the secure HTTPS protocol for accessing the web server
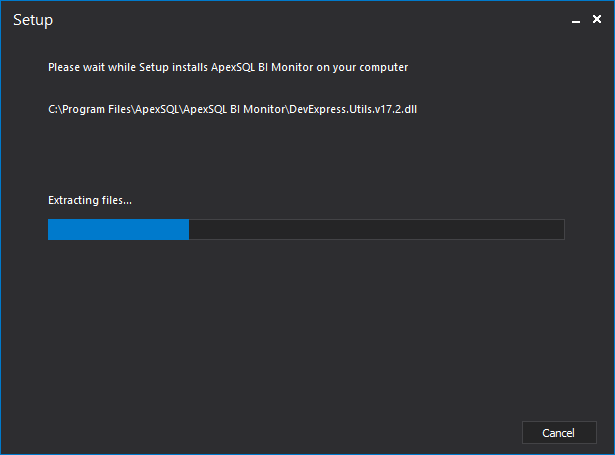
Now wait until the installer completes the installation process
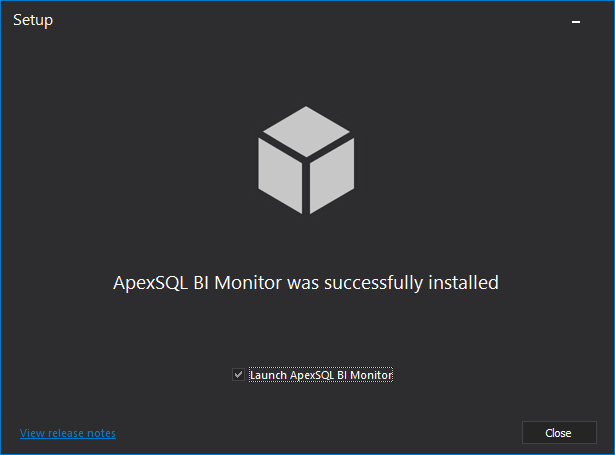
The final installation step confirms the successful installation and allows users option to run ApexSQL BI Monitor immediately after closing the installer
Main interface
ApexSQL Monitor is a web-based application that utilizes a single main menu. The main menu allows navigation to various application pages including the Home page, dashboard, alerts review, reporting on collected data, monitoring configuration, application administration, resources, and “Add services” page for adding the new SQL Server services for monitoring:

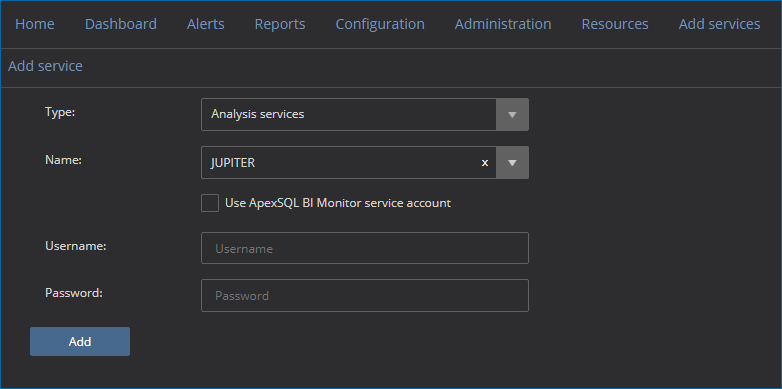
Adding a service for performance monitoring is a one-step task. Users need to click on the “Add service” link in the main menu, choose SQL Server service type, select the instance or type the name directly in the combo box and provide login credentials. Clicking on the “Add” button add the service for monitoring:
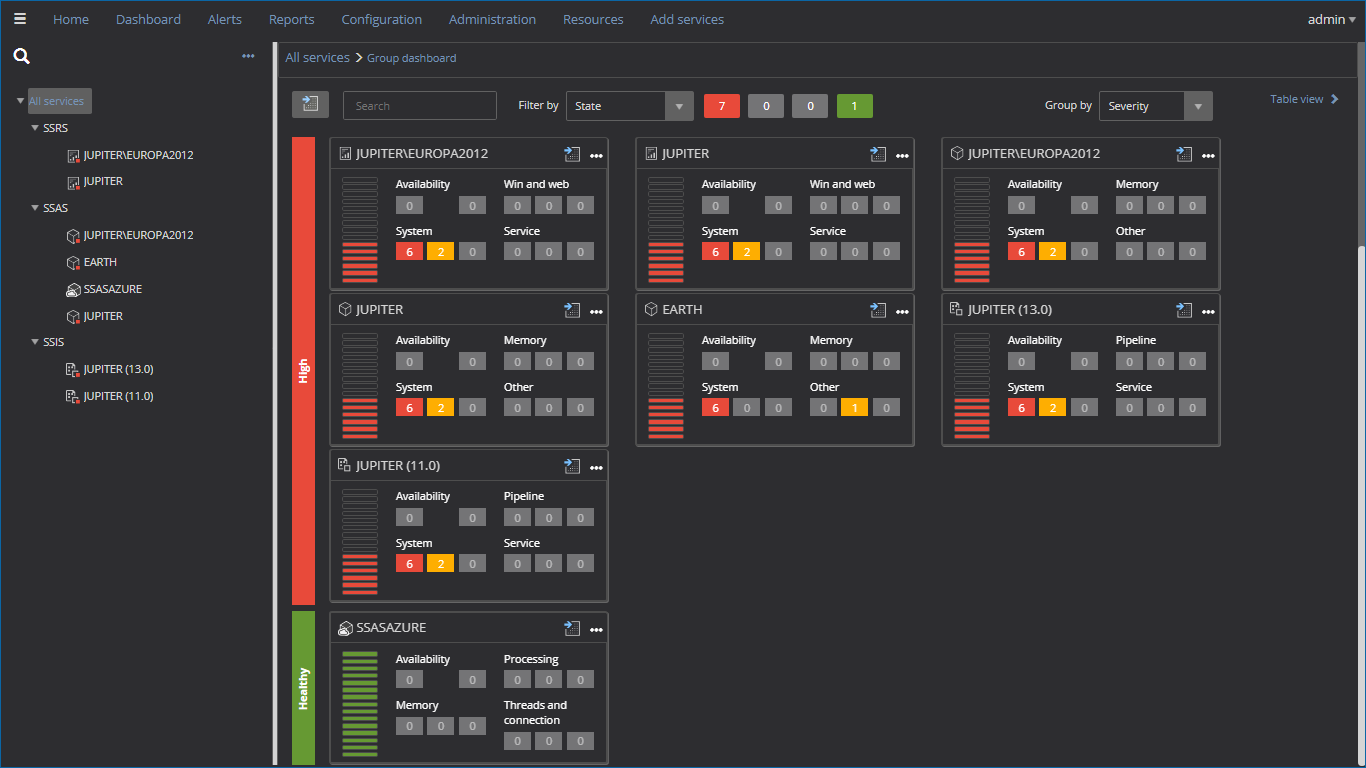
The global information about added services is available from the group dashboard – the default page that shows up when starting ApexSQL BI Monitor and it can also be accessed by pressing the “Home” link in the main menu. It provides various information about all monitored instances such as type, status, version, but also global alerts info for service availability, system, and, depending on service type, the most important performance categories for analysis, integration and reporting services.
The Group dashboard is also used to manage service credentials, disable/enable service monitoring or to remove a service from the application. The default view is panel view:
And here is the shot of the same dashboard that uses the light theme

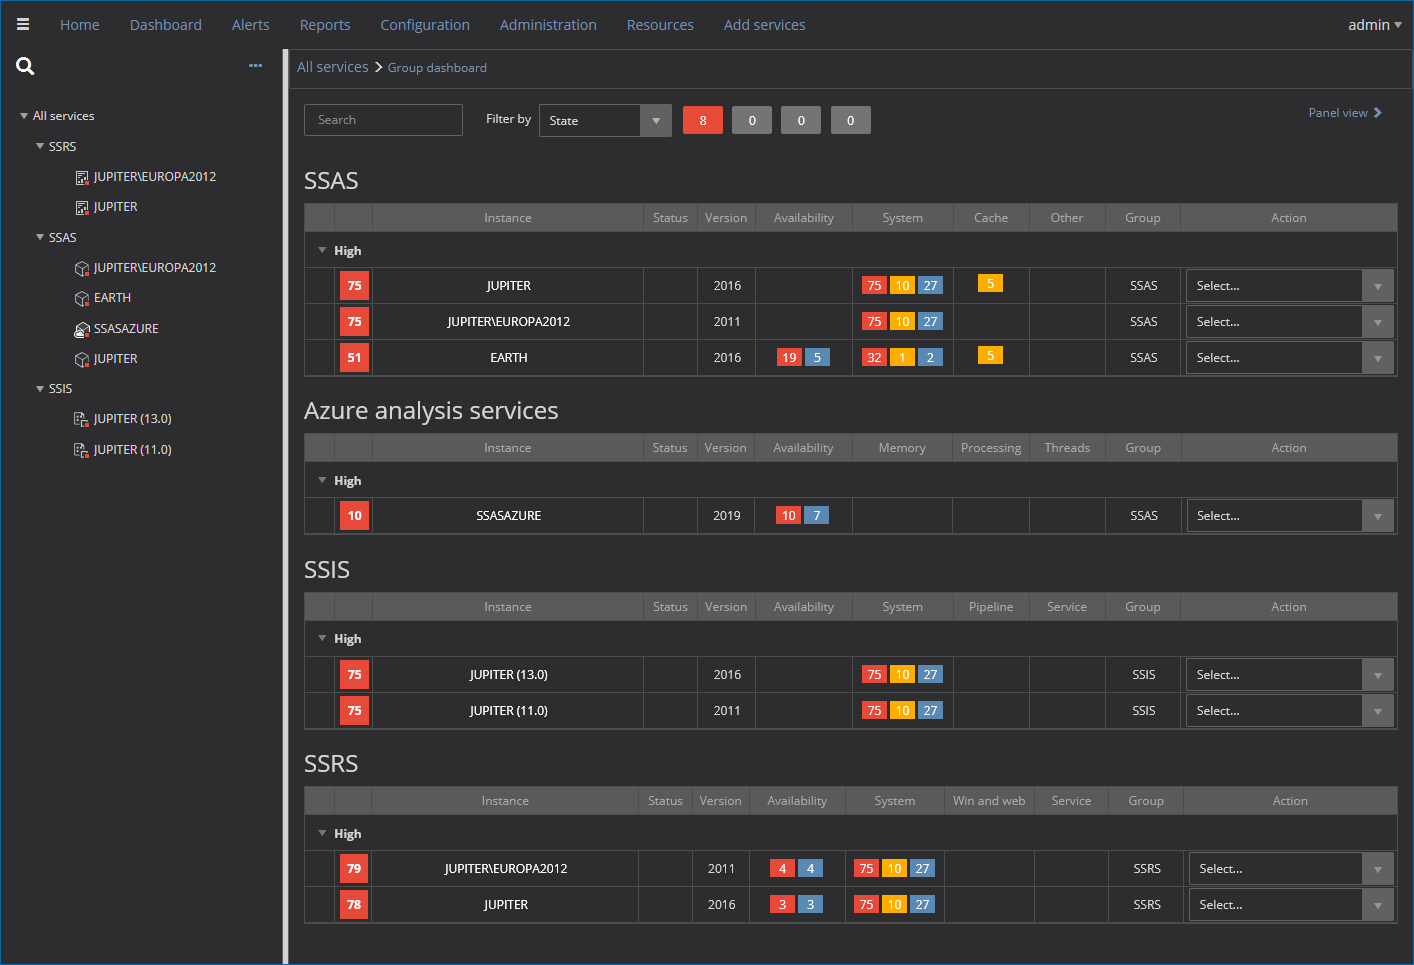
The user can switch to a table based dashboard view:
Navigation
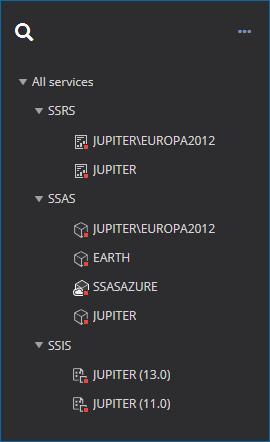
The tree view allows the user to view monitored services, basic information on their status, alerts and the service type. A quick search of the monitored services is available for easier handling of situations where a large number of services are monitored:
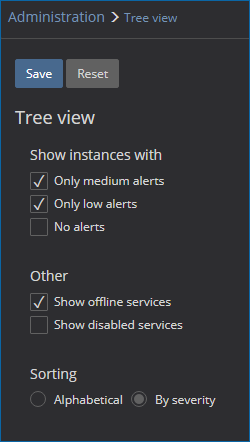
By selecting the ellipsis button in the tree view, it is possible to configure the tree view itself. Here the user can set what services to be visible in regards to the alert severity, as well as whether to display the offline/disabled servers and how the services should be sorted.
Dashboard
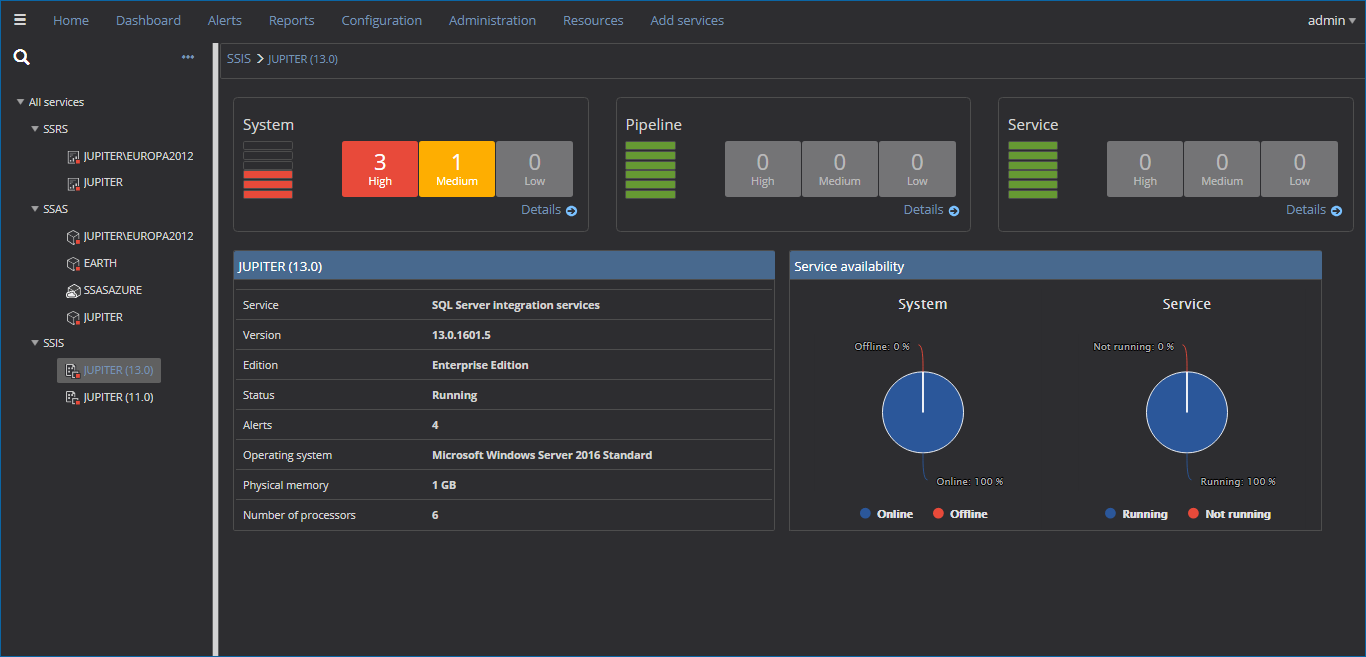
The service dashboard displays various information for the selected monitored service. It provides the general information on the system and SQL Server service, availability of the hosting system and status of SQL Server service, as well as information about the alerts that occurred on the instance including where the alert occurred, severity and the number of the alerts triggered for each category
The service dashboard is the starting point for drilling down to various performance pages via provided links, where the user can get precise performance details for each performance category:
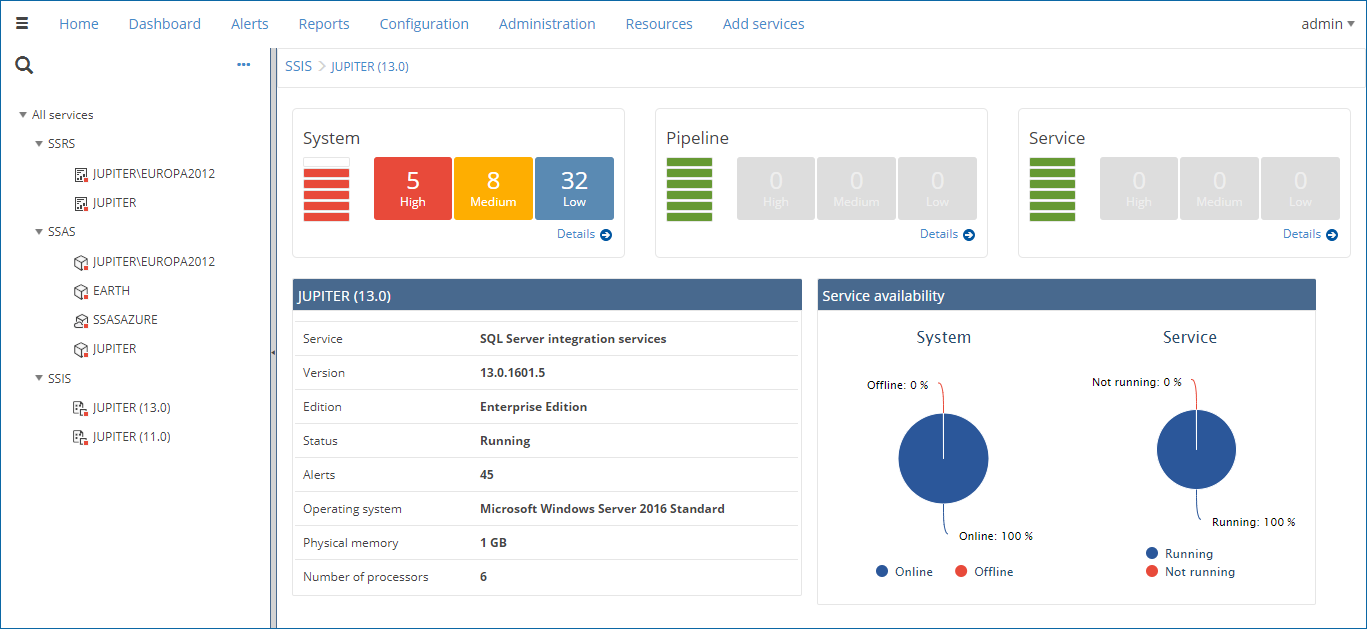
And the light theme of the service dashboard page
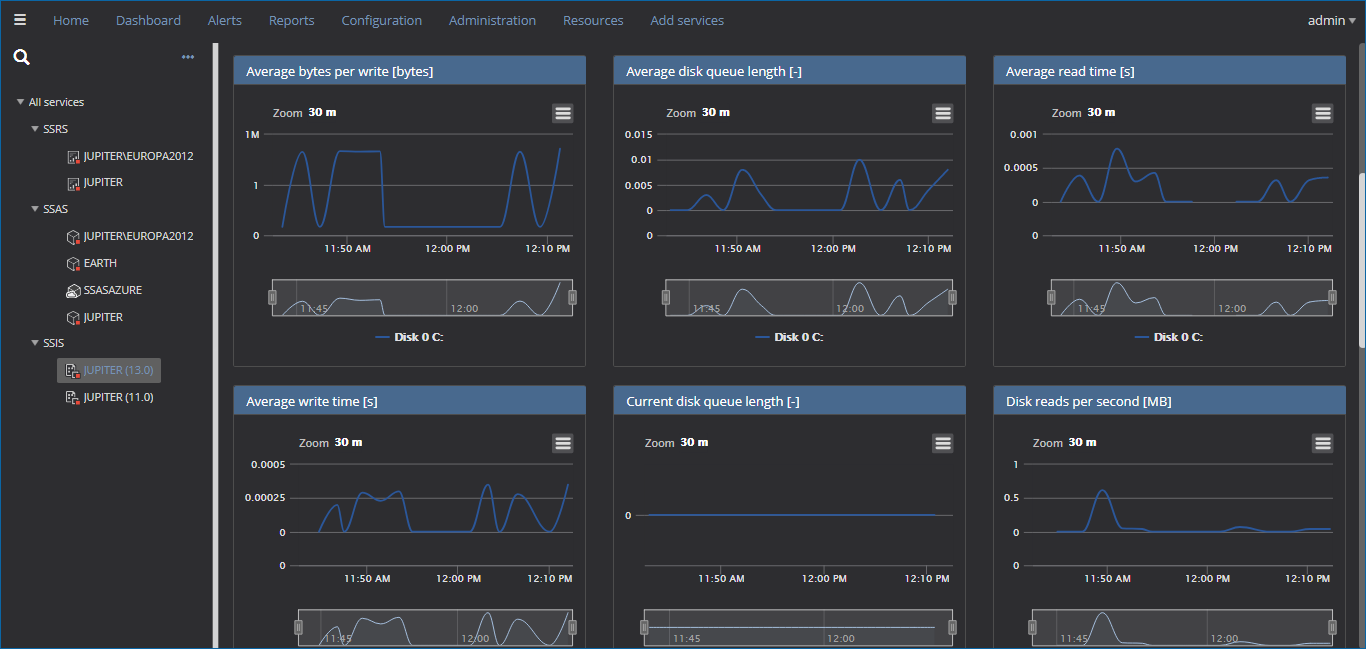
Monitoring details
The system and the service-specific performance categories charts pages allow users insight into graphically conveyed performance metrics data. The charts page allows a historical overview of the performance metrics collected over time. The user can select various chart periods, from 30 minutes, which can provide full precision of the metric data up to 7 days for the global view of the performance data changes over time:
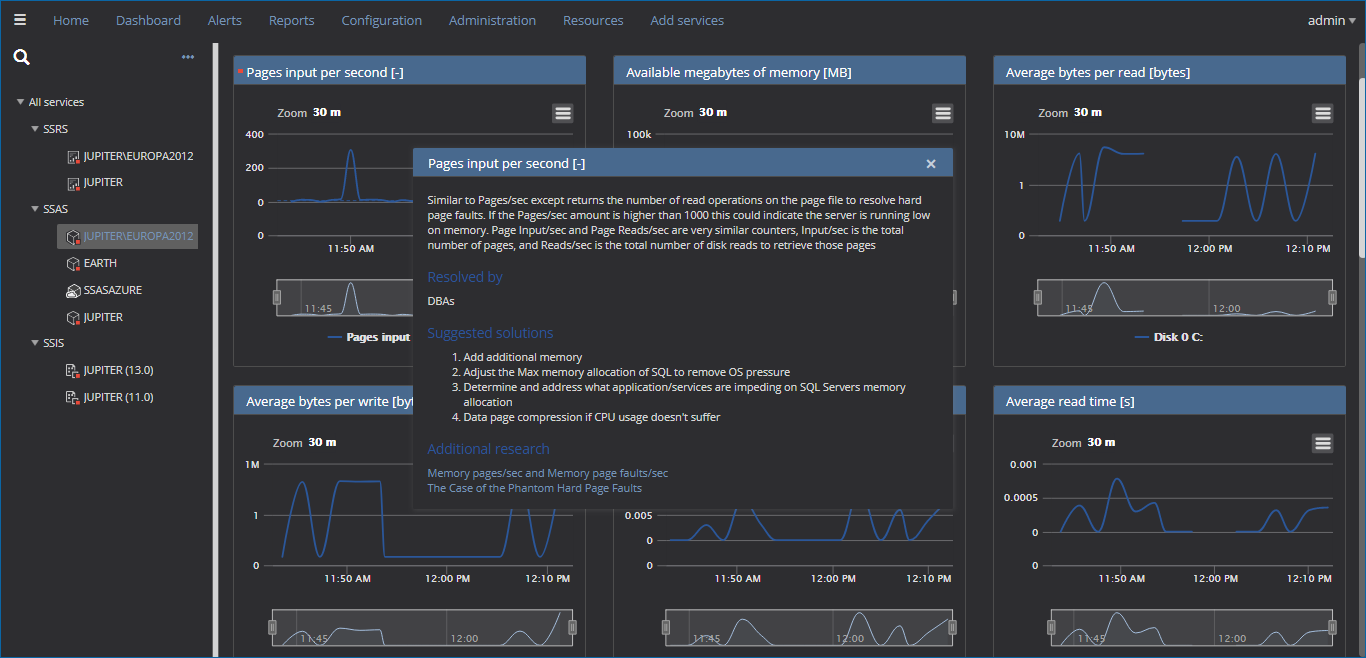
Clicking on chart title displays a popup window with detailed information, troubleshooting guide and additional resources for the given performance metric:
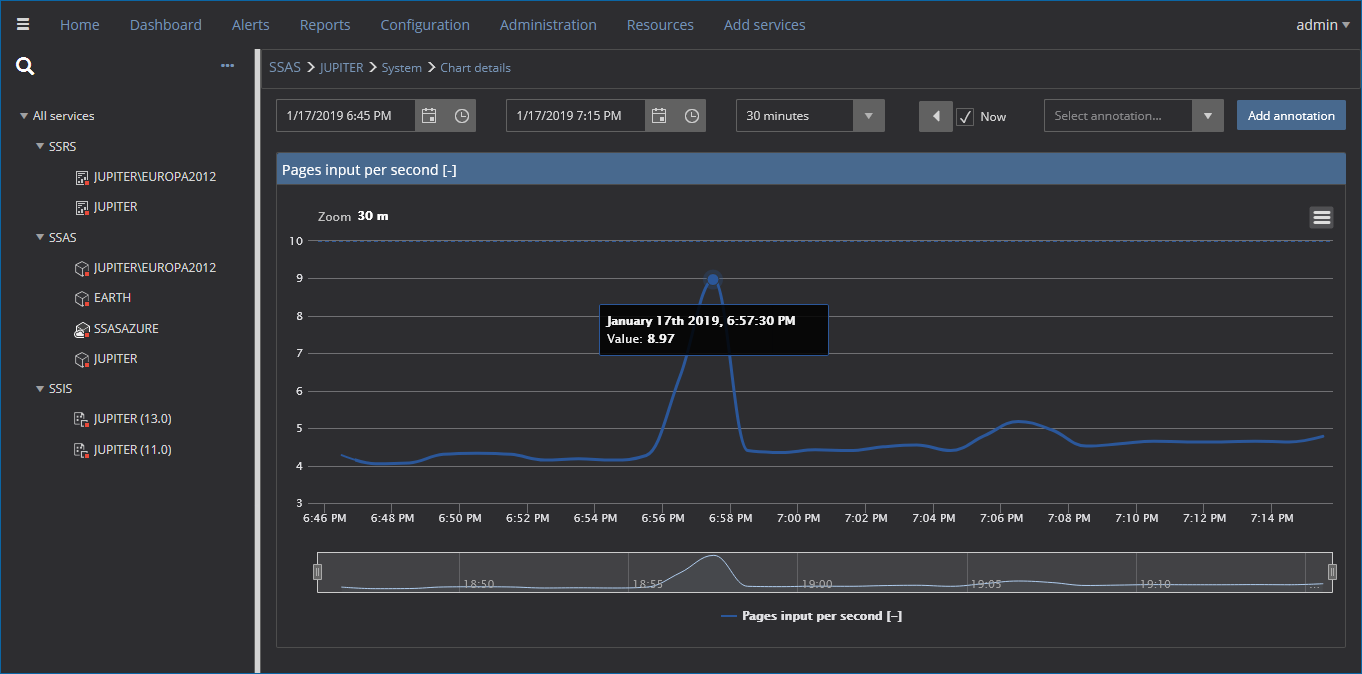
Clicking on the chart displays it in full-page size to ensure more straightforward review of performance metric data:
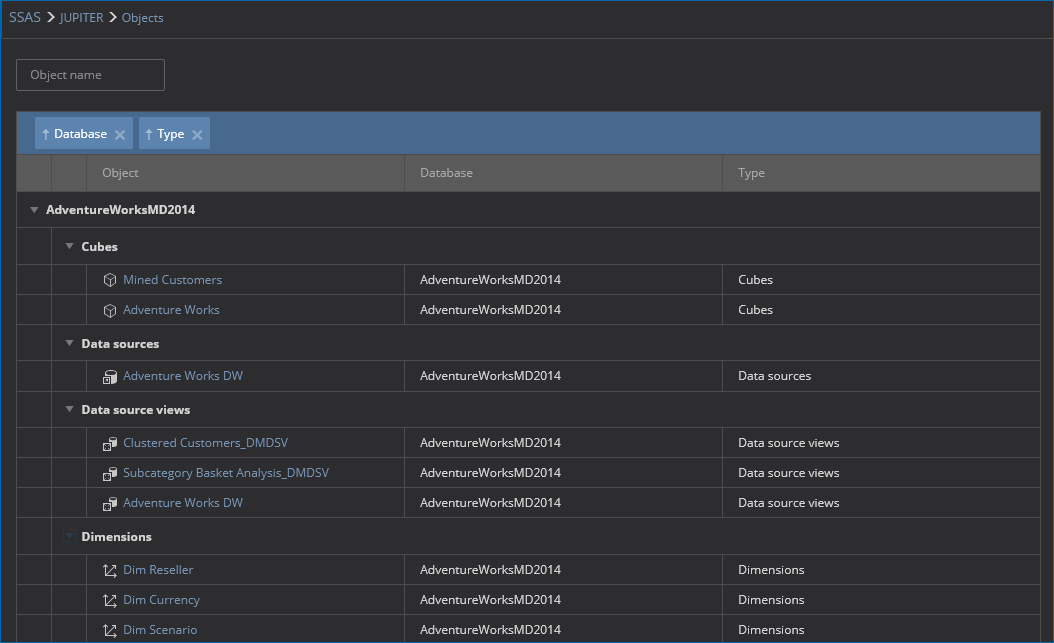
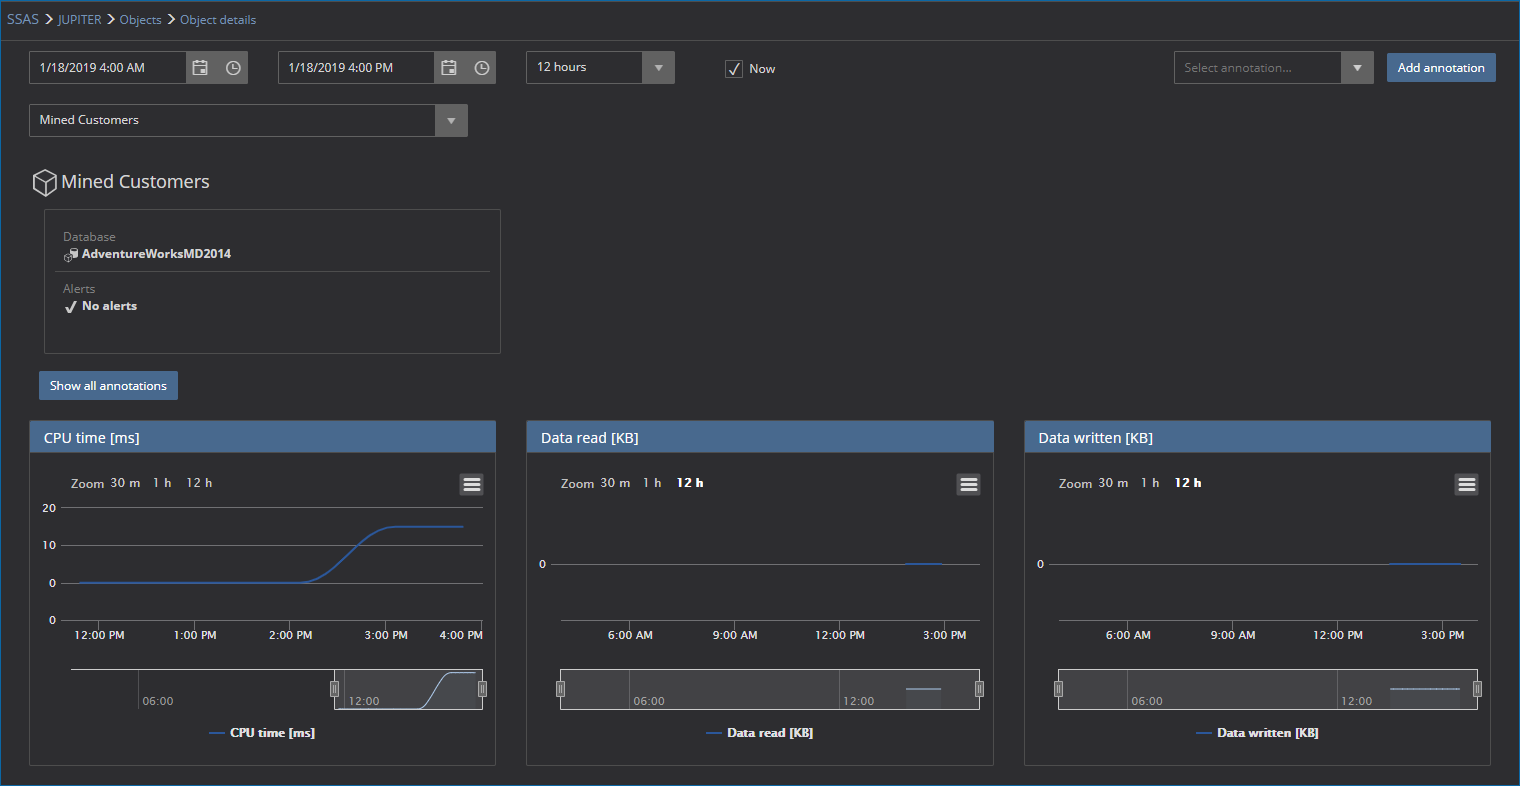
The objects page, available through SQL Server analysis services dashboard, lists all multidimensional (cube) database objects. The user can filter objects by name and view object type:
By clicking on the specific object in the table, a page with object performance charts is displayed:
Alerts
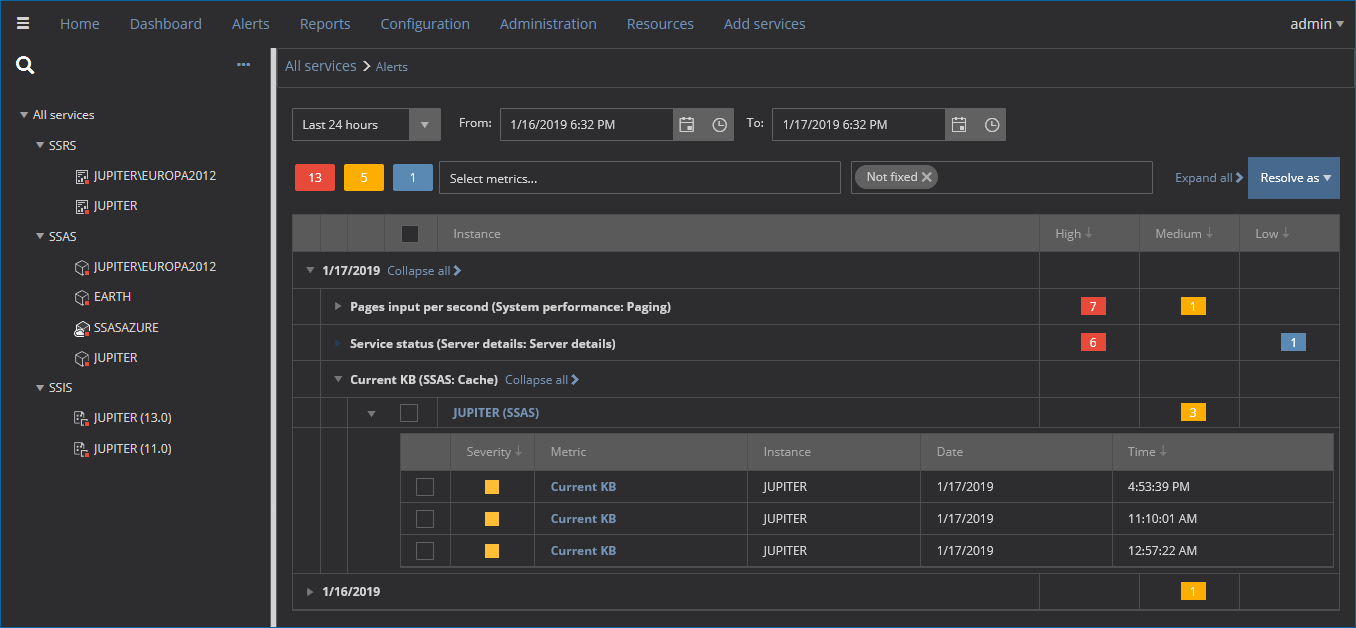
Selecting the “Alerts” link from the main menu opens the alerts page which lists the alerts raised for the specific service. The page allows previewing the alerts list for the user-defined period. Alerts are grouped based on date, metric and service to allow faster management. Alerts can be filtered based on severity, performance metric type, resolution state and read/unread state. The user can also resolve multiple alerts simultaneously on this page:
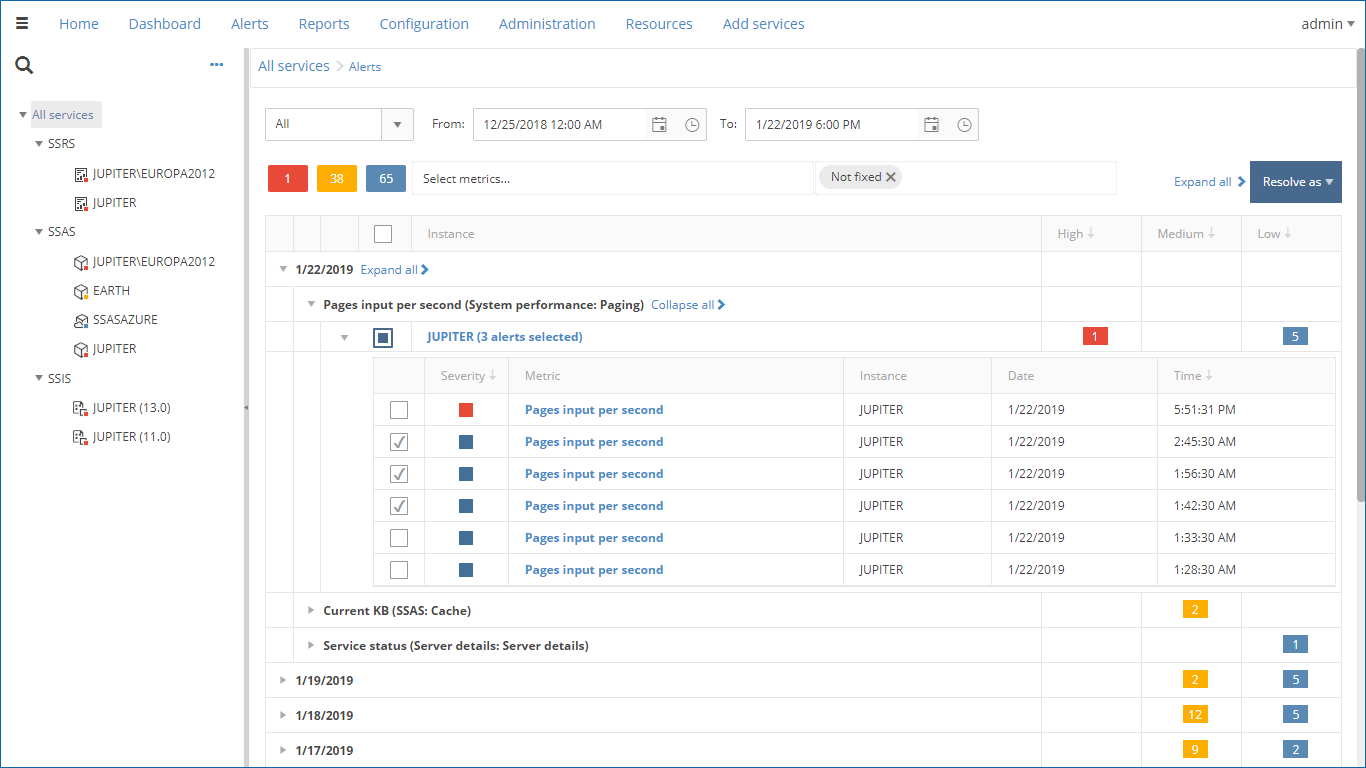
Here is how the Alerts page looks like when used with the light theme
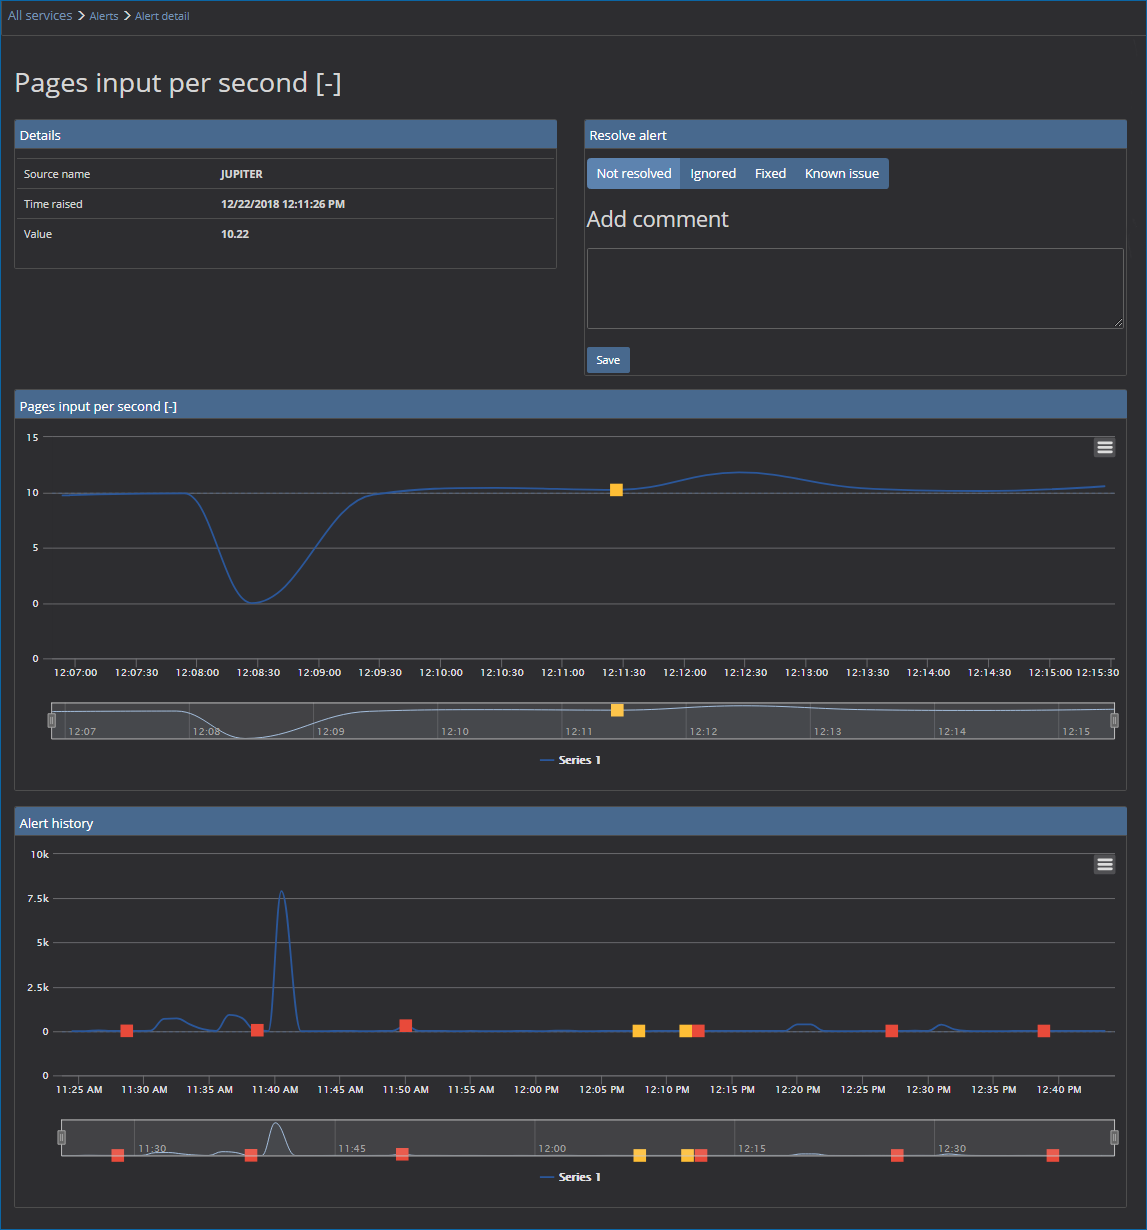
Selecting the specific alert displays the alert details page. The page displays the metric chart with the indication when the alert was raised, as well as a history chart displaying all previous alerts of that type. Once reviewed, the alert can be resolved by the user:
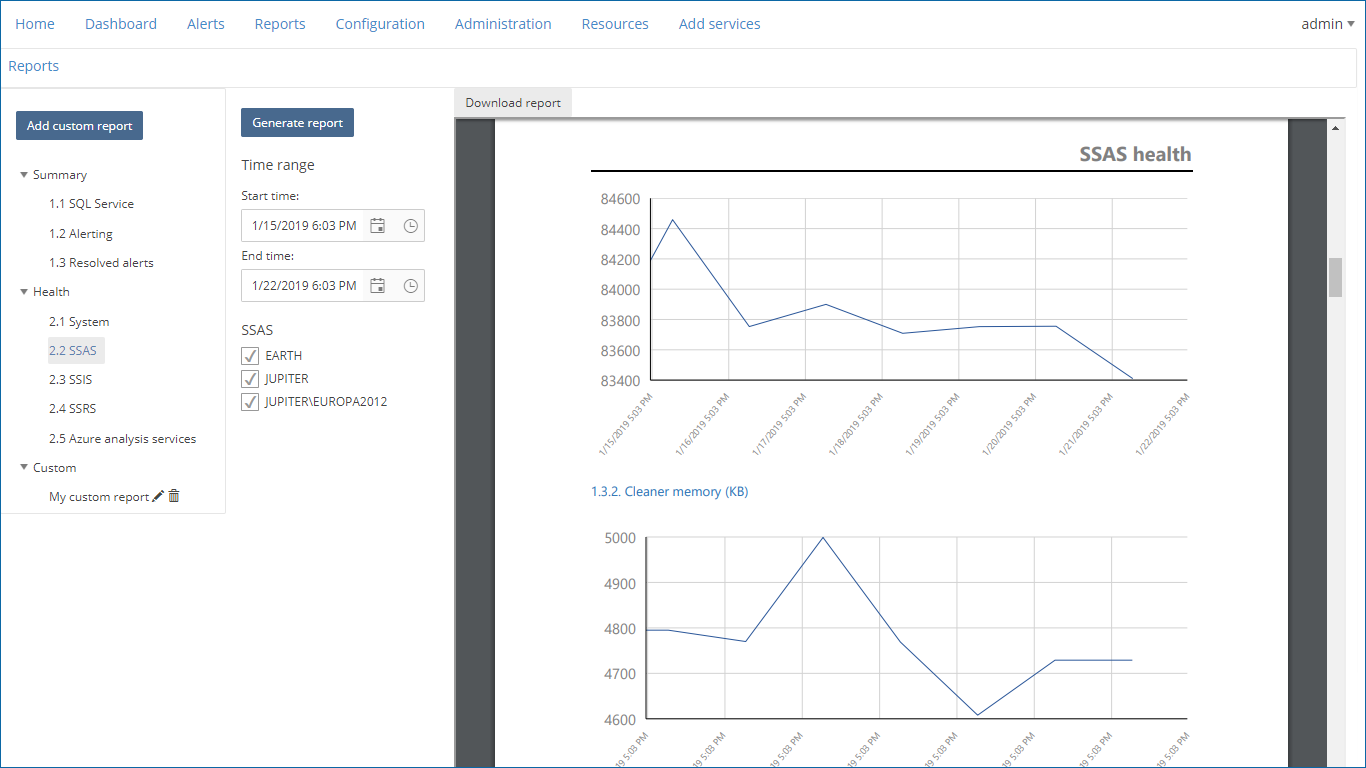
Reports page allows the creation of various predefined metric reports. Reports can be customized by allowing the user to select one or multiple servers and/or databases (depending on the selected report) and to specify the time range for which the report is needed. The report can be instantly previewed or downloaded:
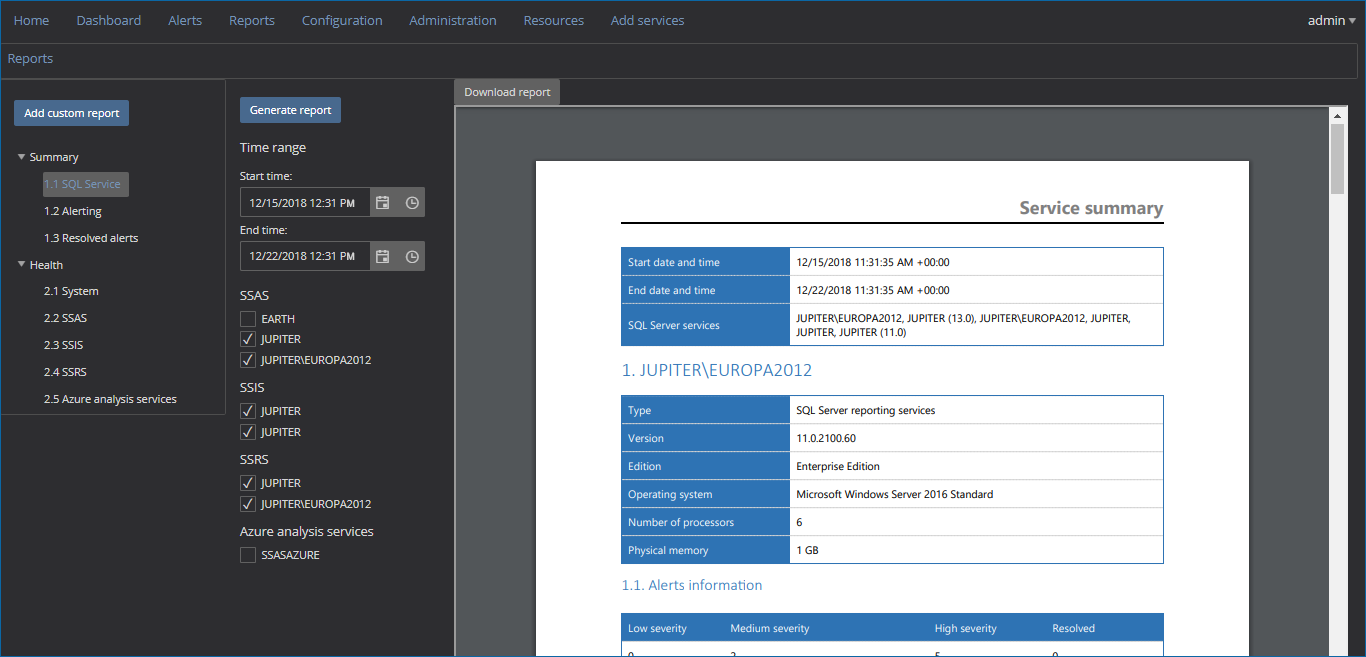
And the same reports page in the light theme
Reporting
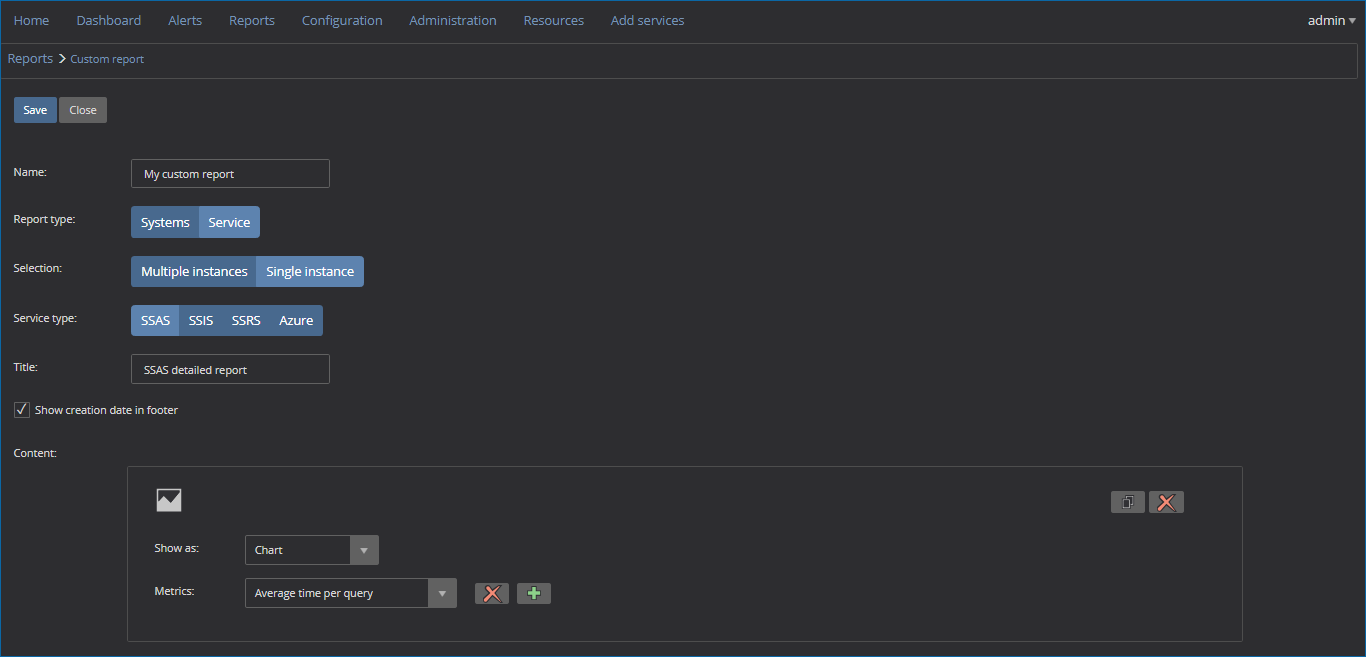
By selecting “Add custom report” in the reports page, the various custom reports on System and SQL Server services metrics can be created by the user and saved for further use:
Settings
Configuration page contains multiple subpages for configuring various parts of the performance monitoring process, accessible via the provided configuration page submenu:

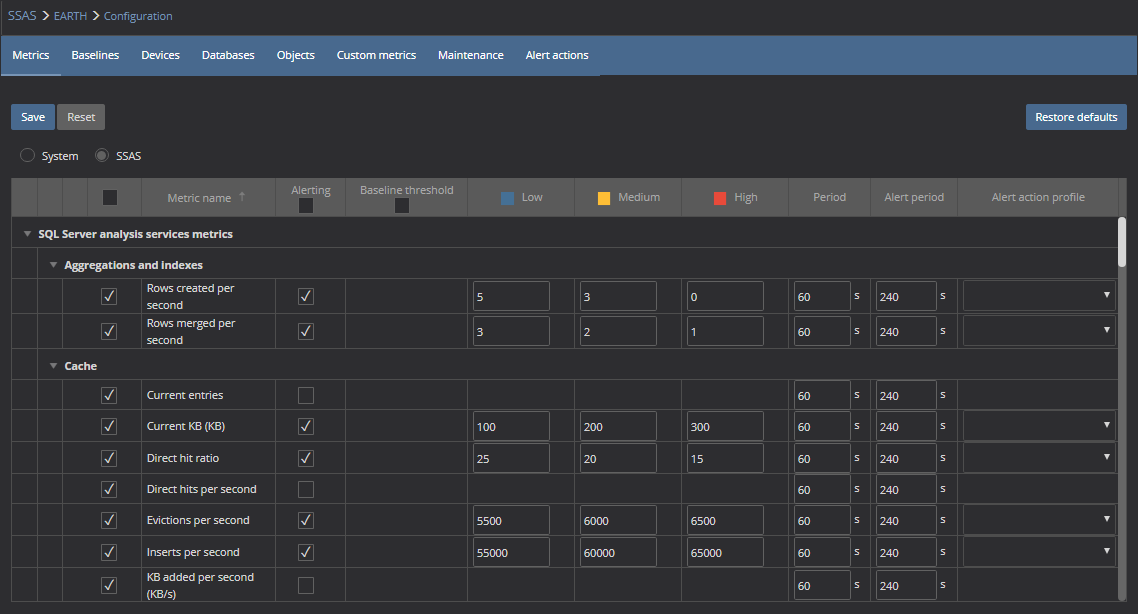
Metric configuration page is the default configuration page. Here the user can select what metrics to monitor (or not), enable or disable alerts for each metric, alter alert threshold values and the alert period for multiple or specific metrics. The predefined or user-created alert actions can be assigned to desired metrics here:
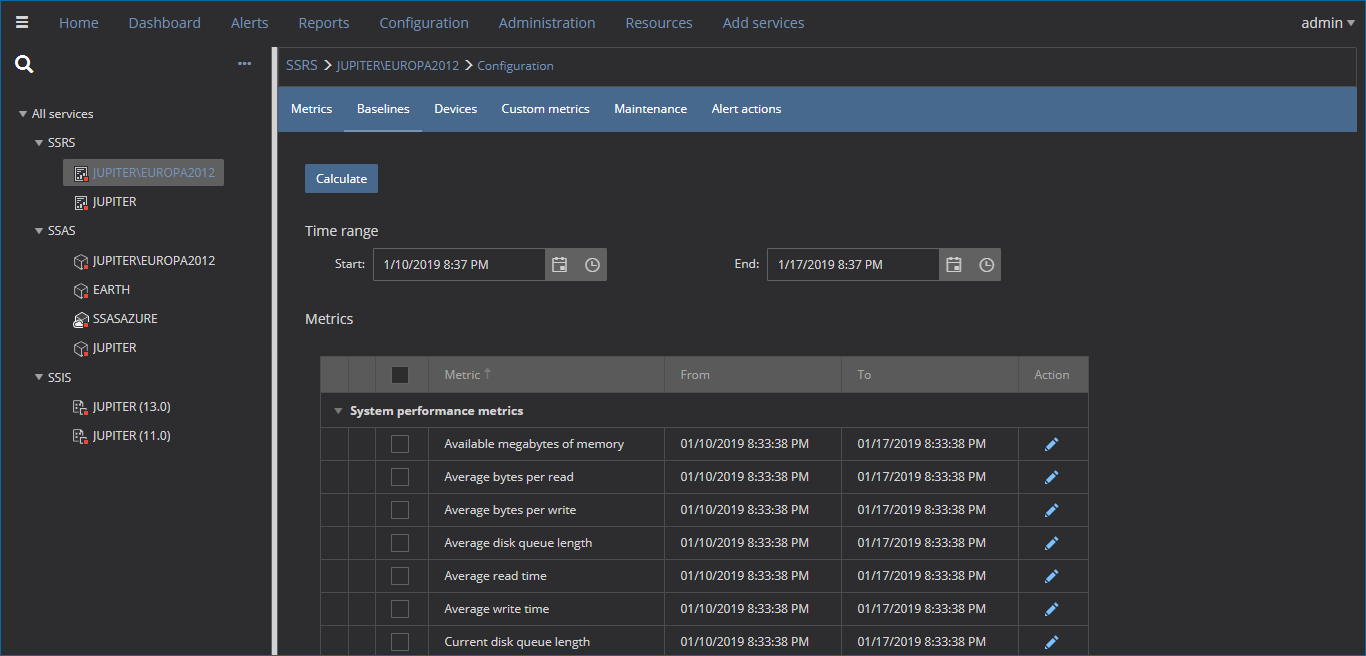
The user can calculate baselines just for selected or for all metrics at once in the baselines configuration page. After selecting the period that should be used for baseline calculation, pressing the “Calculate” button calculates the baseline values:
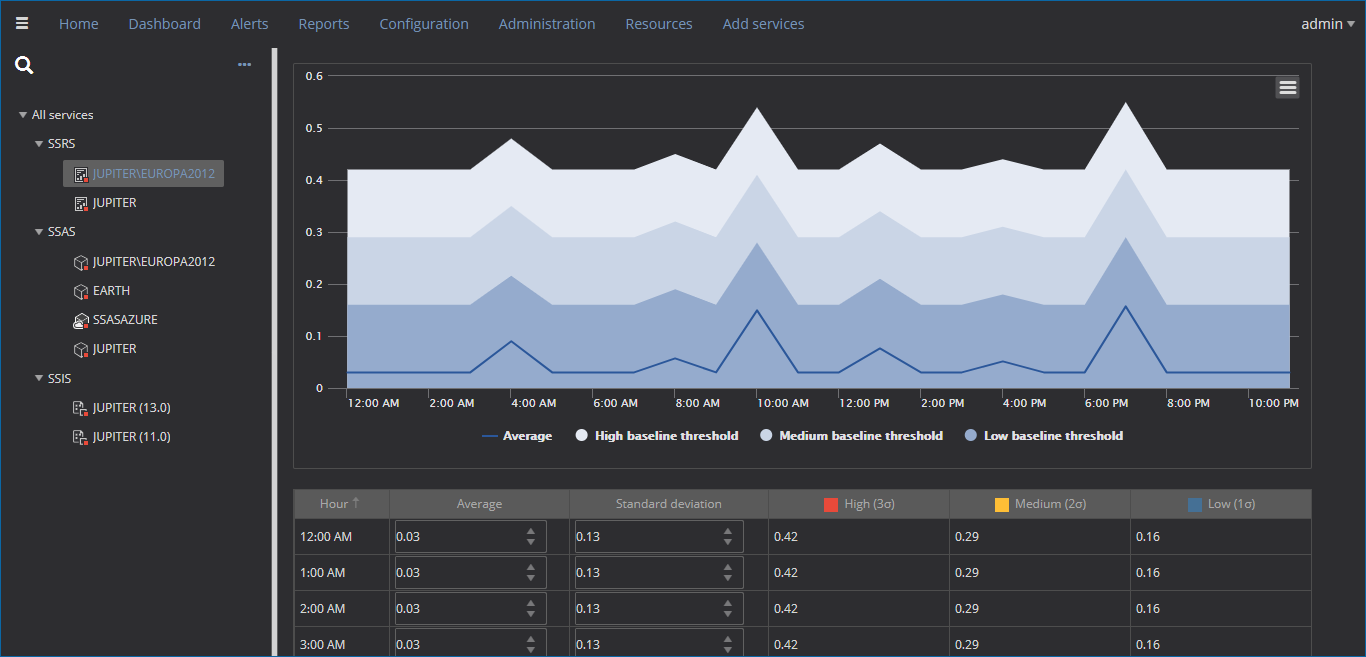
Clicking on the “Edit” button opens the baseline details page. Here, the user can view baseline details and adjust the baseline thresholds using either the interactive chart or the table below it:
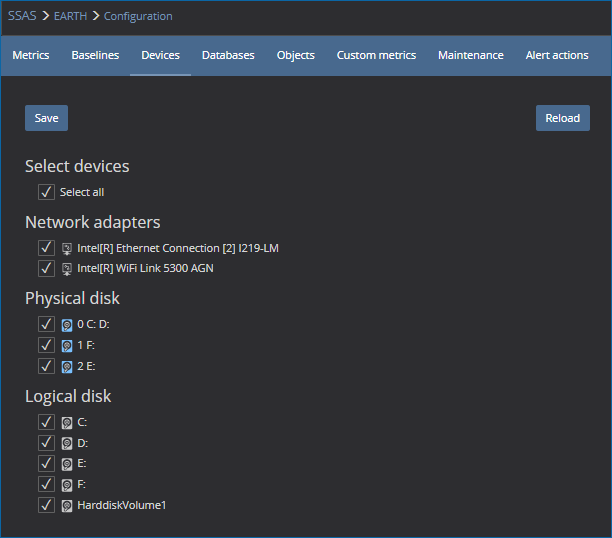
The devices configuration page provides options to include or exclude specific devices from the monitoring process:
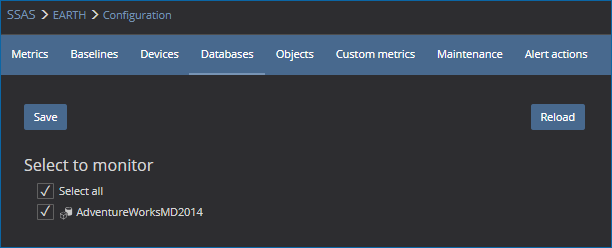
Selecting which multidimensional databases should be monitored or not can be set in the “Databases” configuration page:
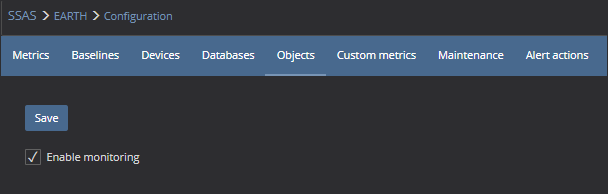
Toggling multidimensional database object monitoring can be done in the “Objects” tab
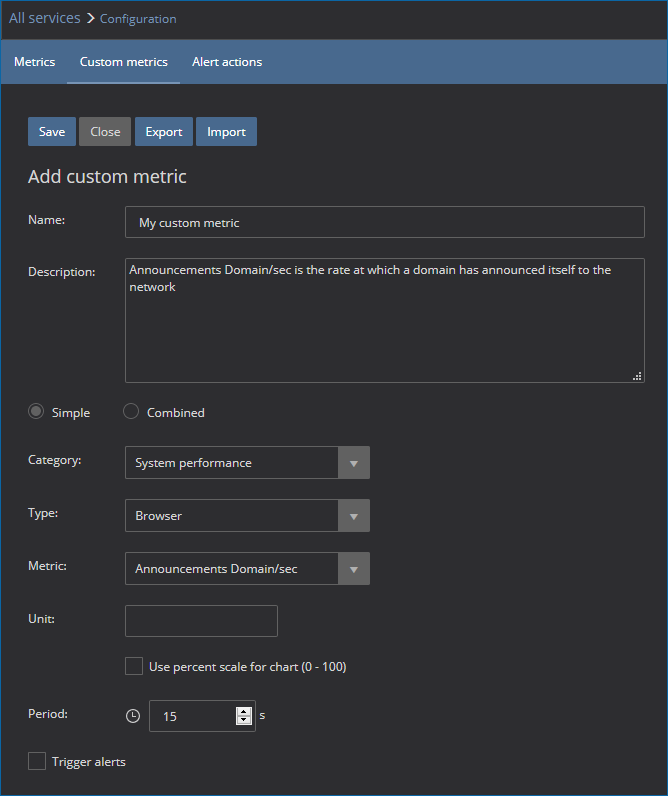
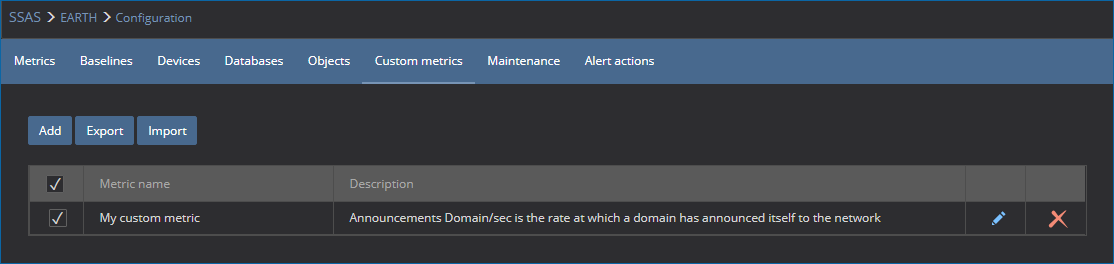
The Custom metric configuration page allows creating the custom system, SQL Server analysis, reporting and integration services metrics that, once created, can be used and configured as any built-in performance metric:
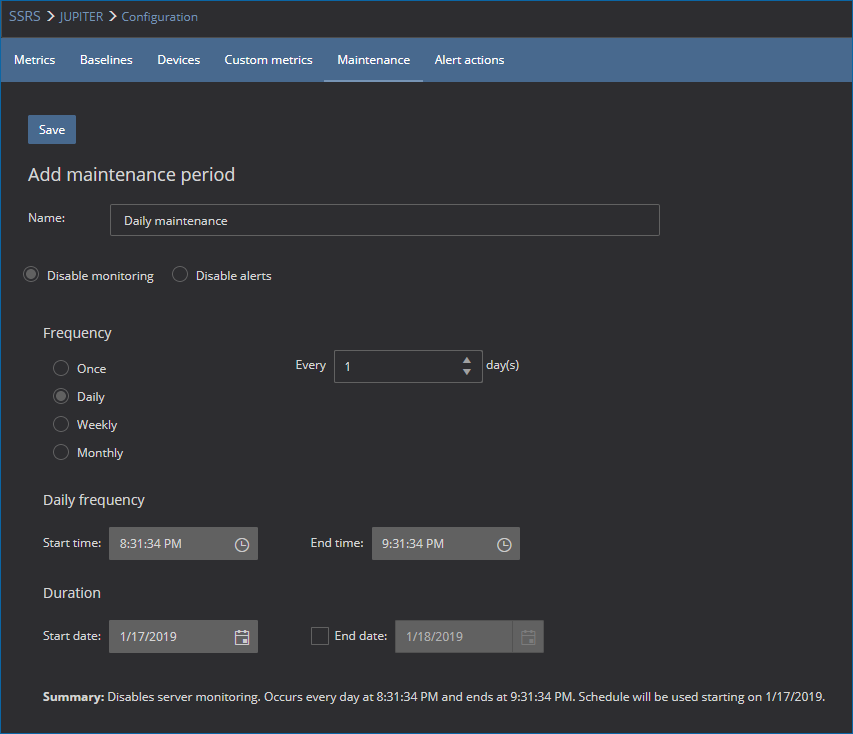
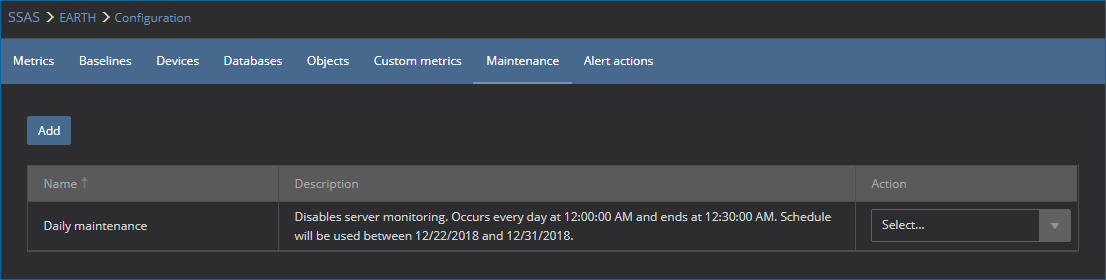
The Maintenance period configuration page allows scheduling maintenance periods when the performance monitoring or alerting have to be disabled:
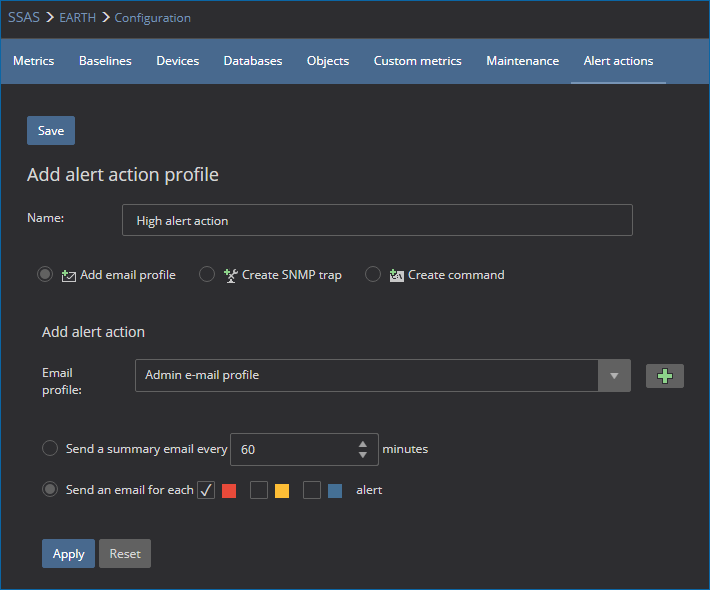
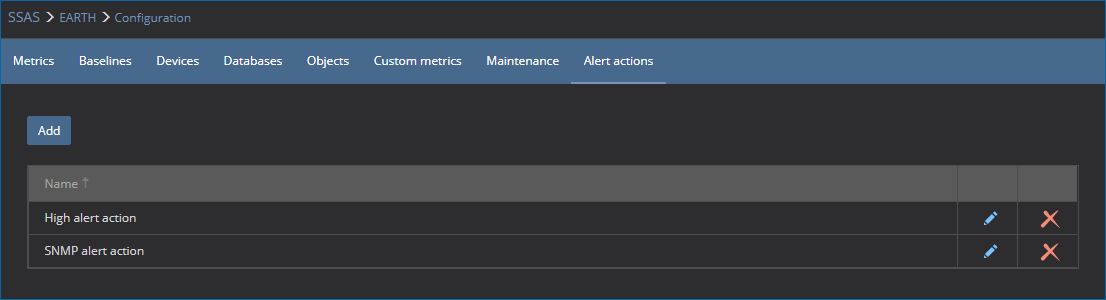
The Alert actions configuration page can be used to create various alert actions such as adding email profiles, creating SNMP traps and executing CLI/Power shell commands when an alert occurs:
Administration
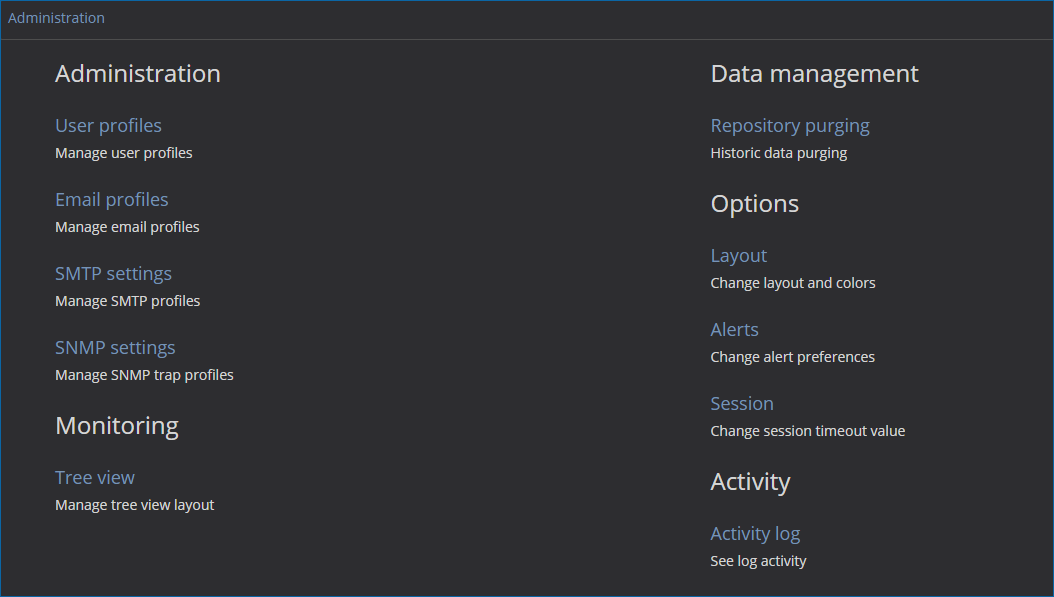
The Administration page is accessible via the link in the main menu. The links in this page could be used for managing various application settings:
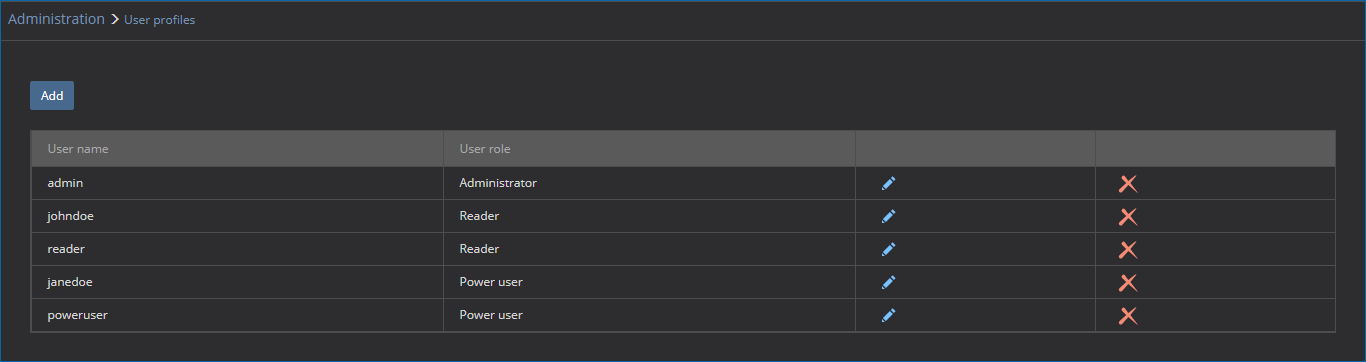
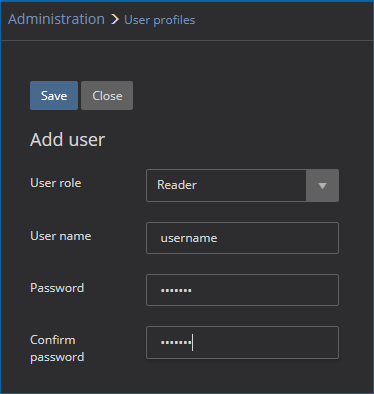
The User profiles page allows adding, removing and editing application users. Each user can be assigned with the one of Administrator, Power user or Reader role:
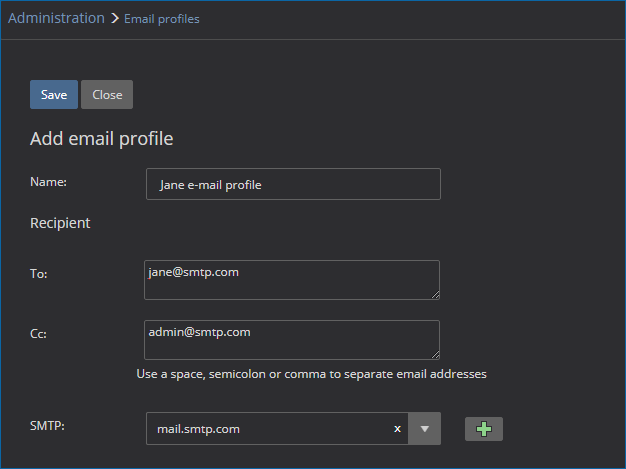
Email administration page allows adding, removing and editing email profiles:
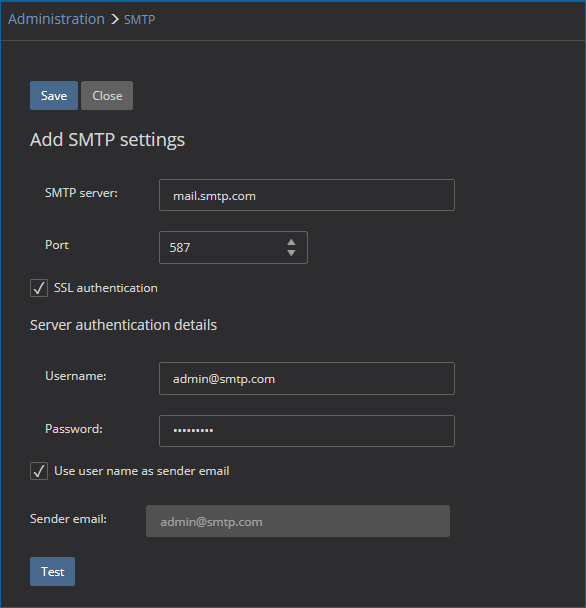
The SMTP configuration page allows creating, removing and editing SMTP mail server profiles:
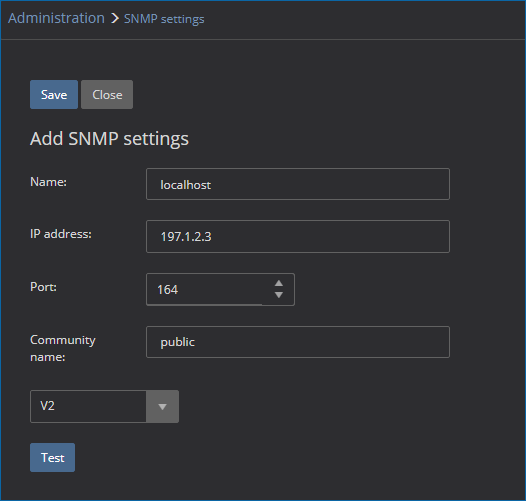
The SNMP settings allow creating, removing and editing SNMP trap settings:
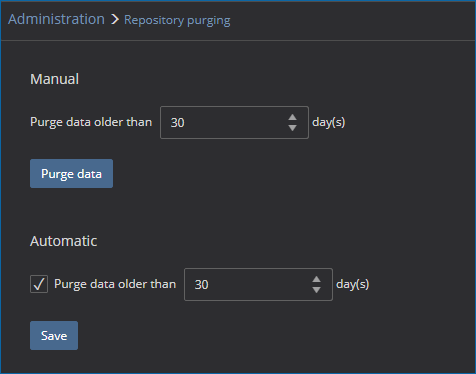
The Repository purging settings allow the user to define data retention policy for data stored in the repository database, by instructing the application to delete data older than the specified number of days regularly. Data purging can also be executed manually by the user:
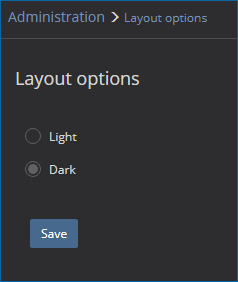
Layout options settings allow switching between the light and dark application theme:
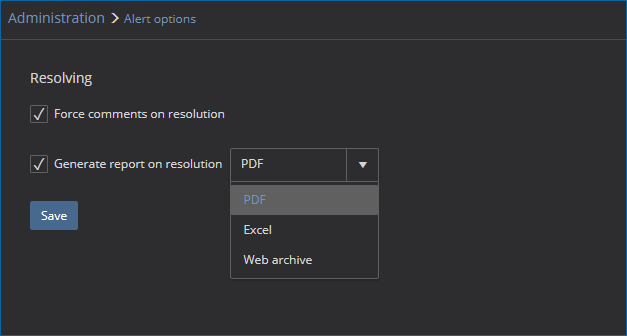
The Alert options administration page allows setting a rule that force users to add comments as part of alerts resolution. Here, the user can set up an option to automatically generate a report when an alert is resolved. Report can be generated and stored in .pdf, .doc or .mht file formats:
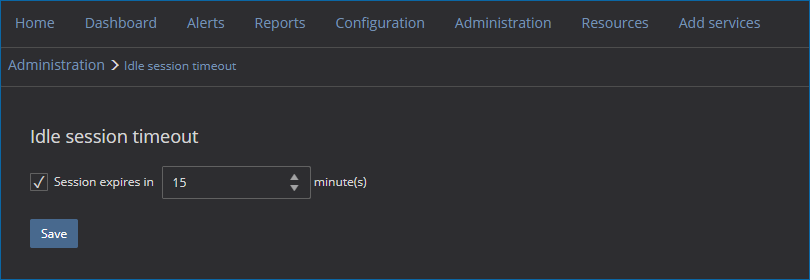
The Idle session timeout administration page allows the user to set idle session timeout period or to disable timeout entirely:
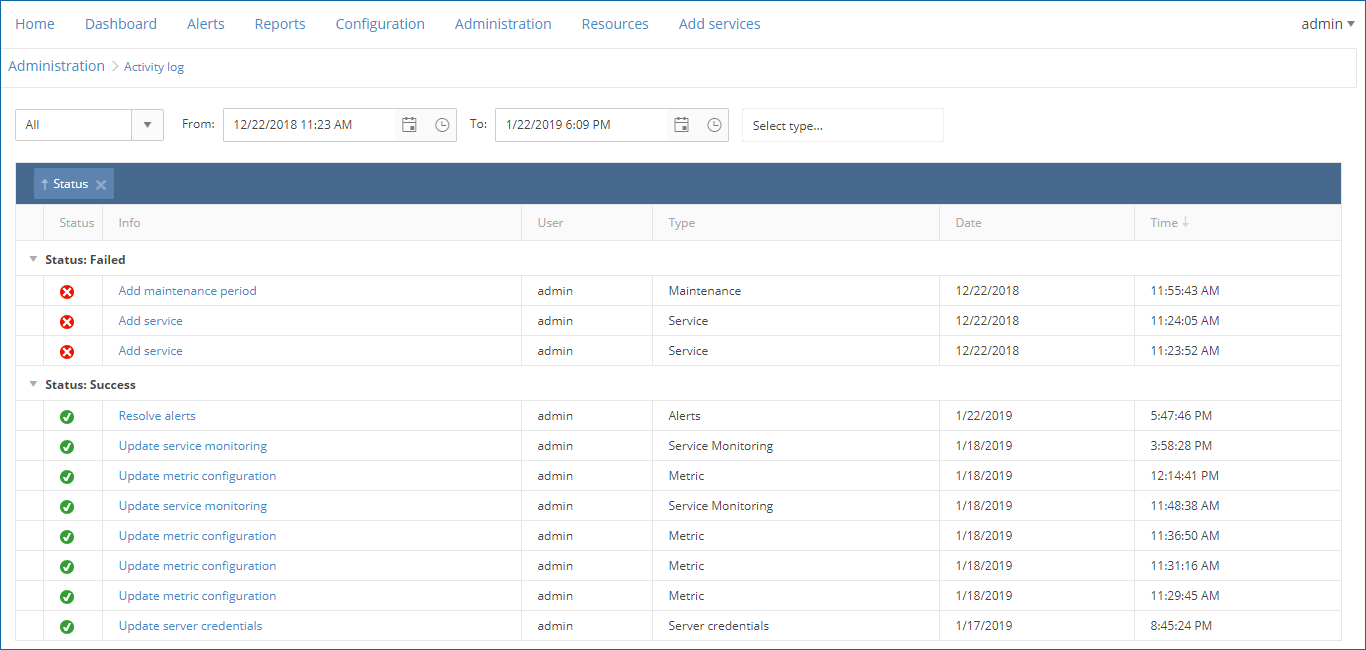
The Log activity administration page allows reviewing the history of ApexSQL BI Monitor configuration changes:
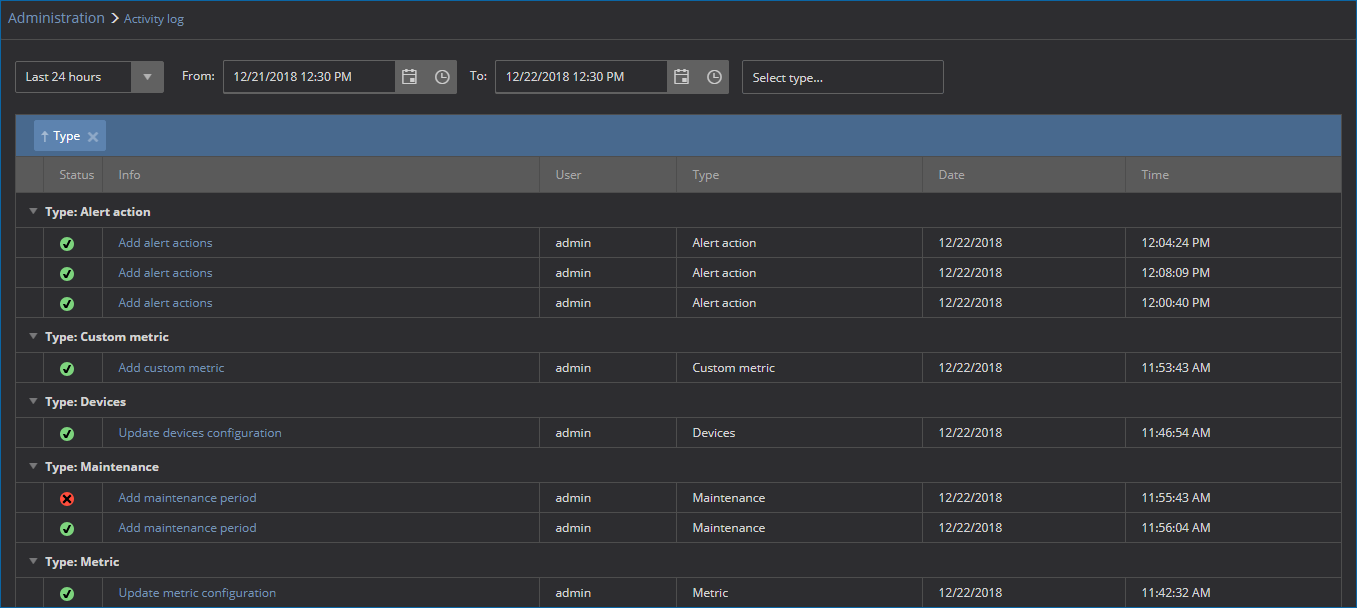
The look of the Log activity page when the light theme is used
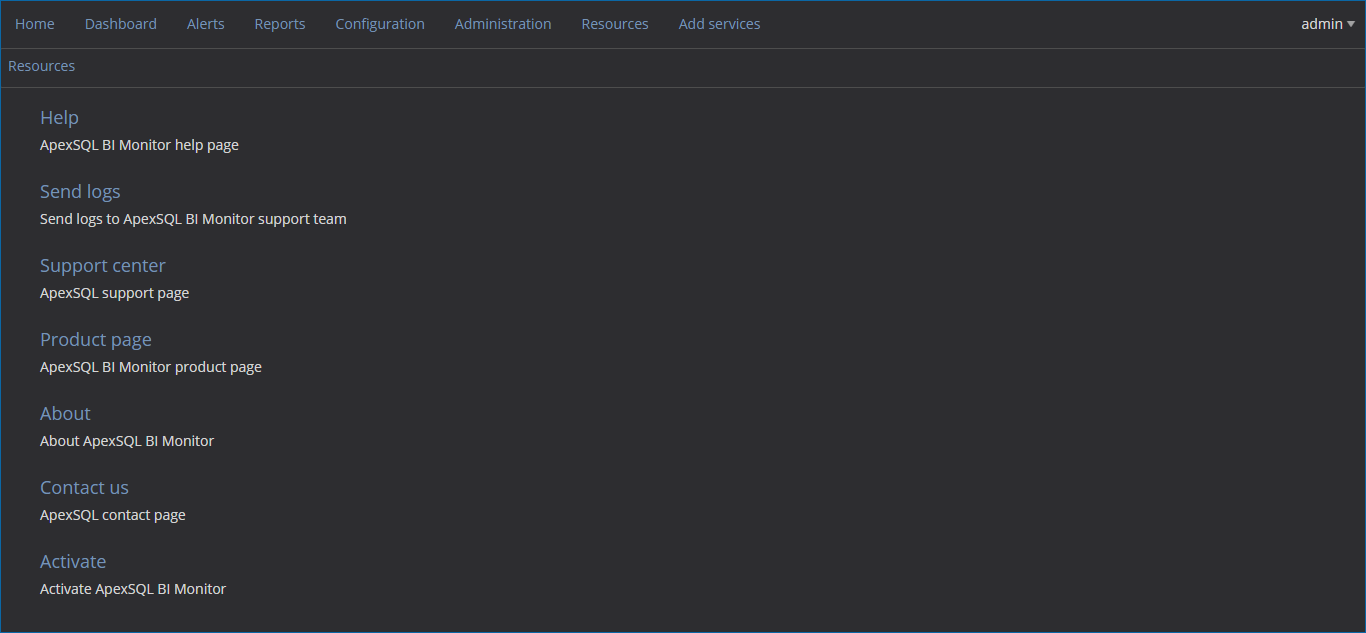
Resources
The resources page allows the user to connect with ApexSQL teams, access application help, and product page or handle application update and activation tasks:
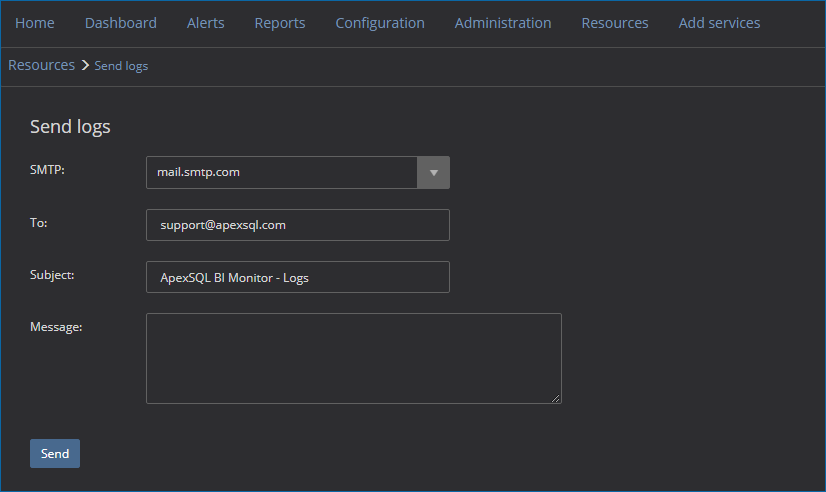
Clicking on the Send logs link opens the Send logs page
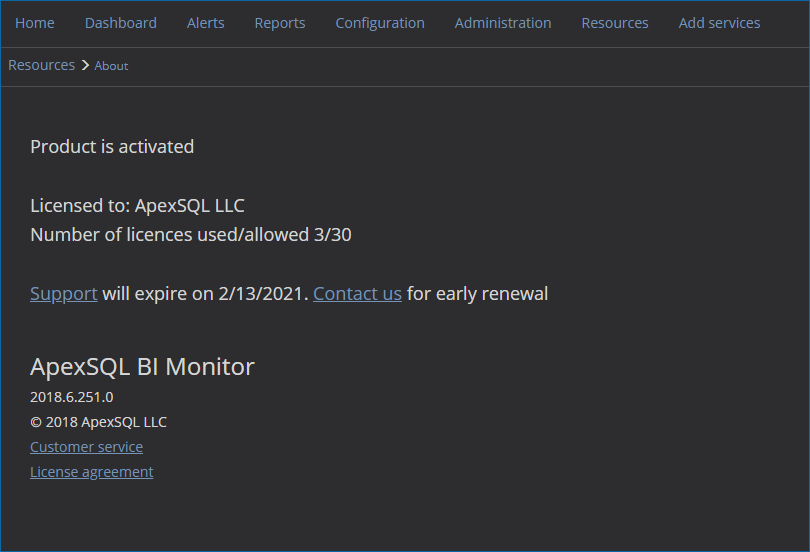
The About link opens the About page where information about the used and allowed number of licenses is provided, as well as the information about the ApexSQL BI Monitor version currently in use
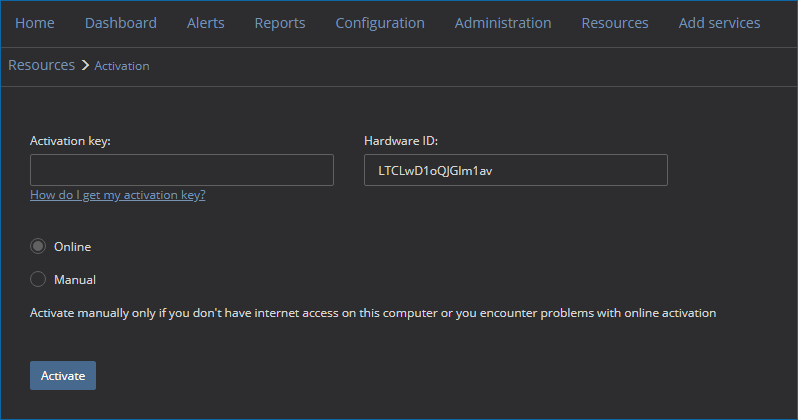
The Activate link in the Resources page brings the Activation page where the user can activate the ApexSQL BI Monitor with the provided license key, either using the online or manual method
February 4, 2019


