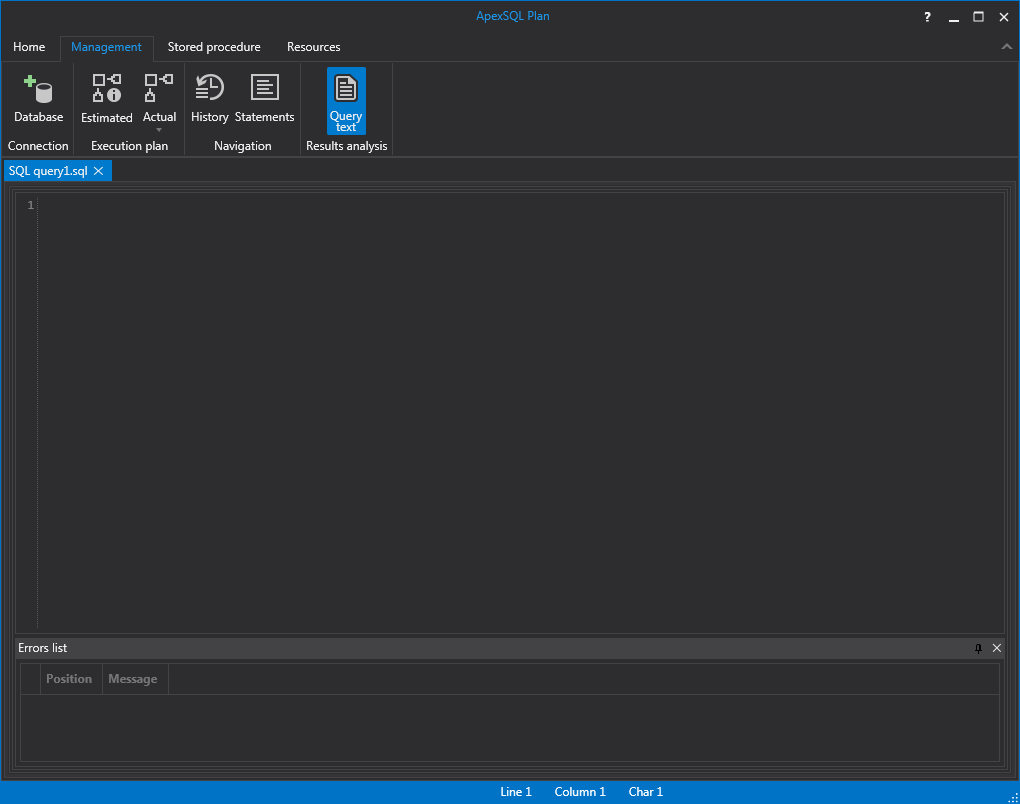
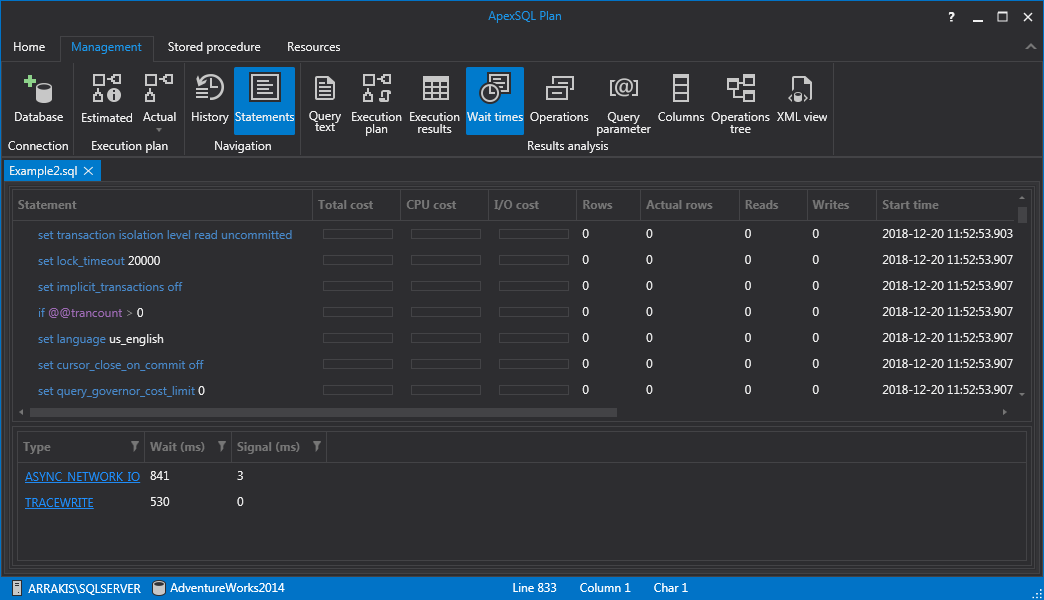
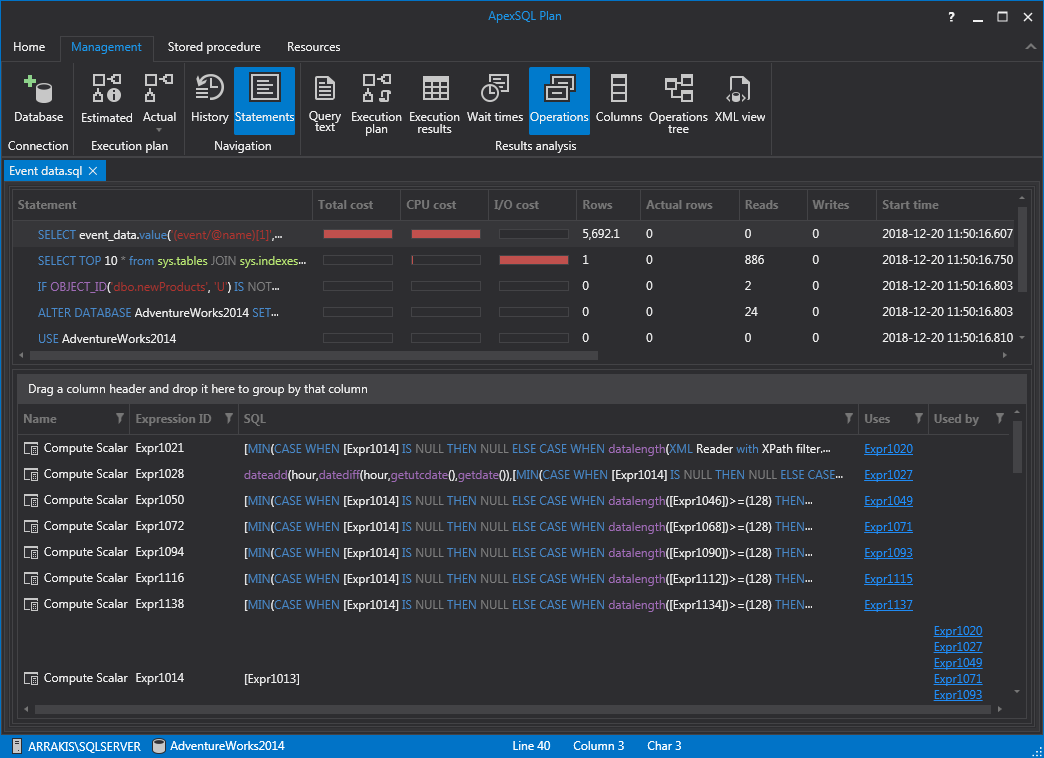
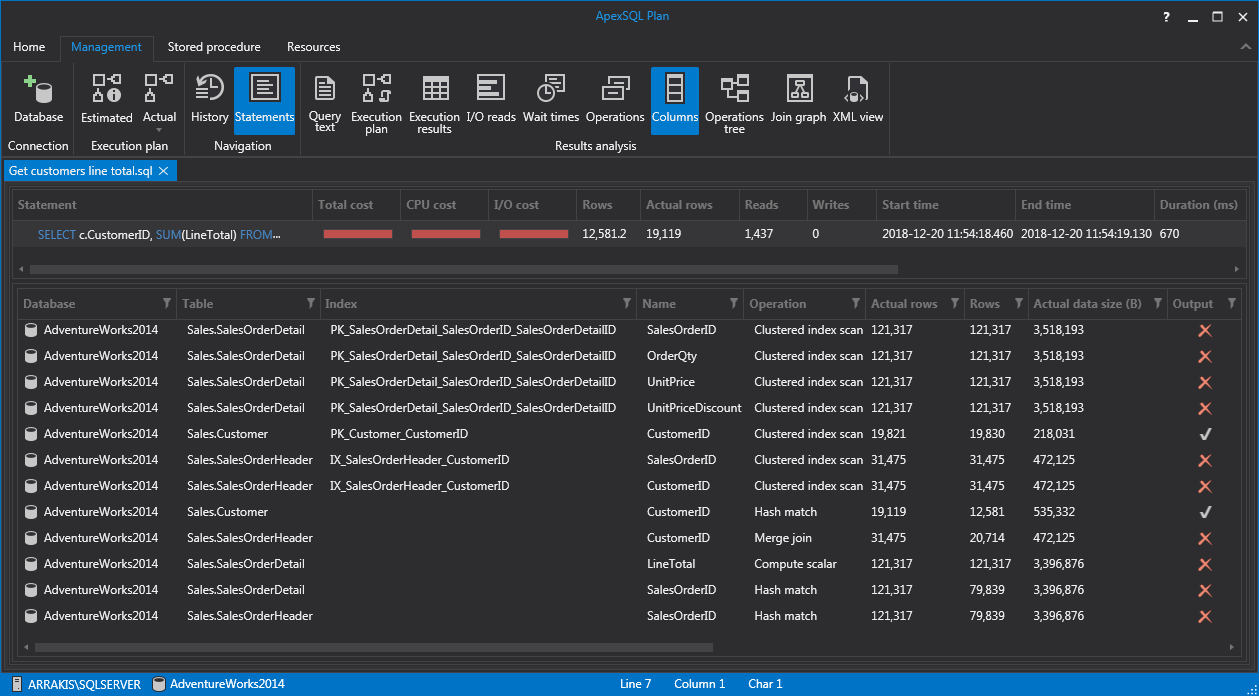
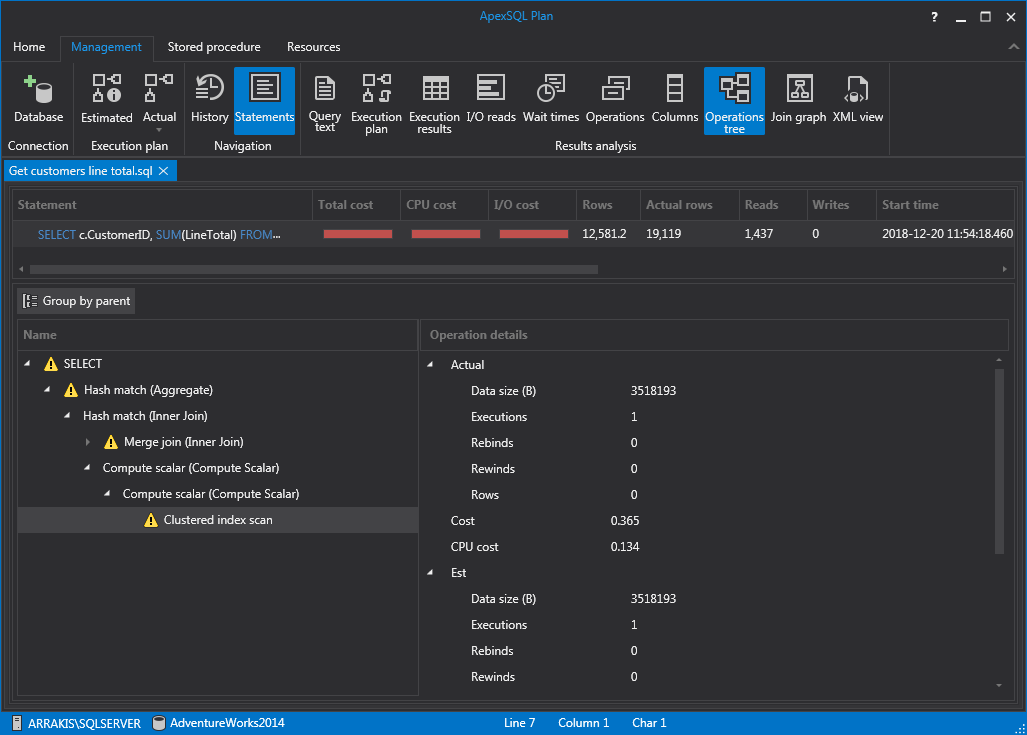
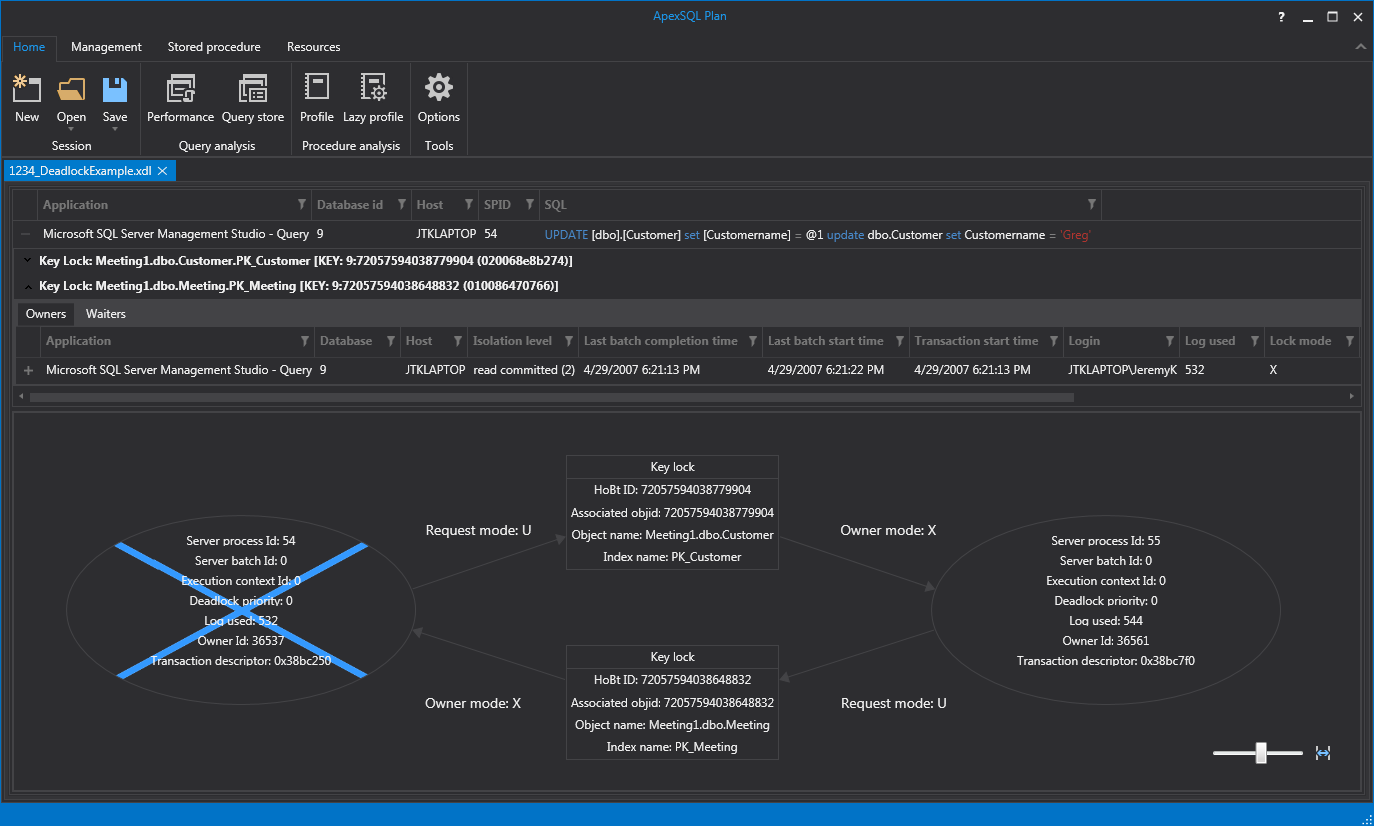
The main window of ApexSQL Plan. This window is shown when new session in ApexSQL Plan is started:
Home ribbon bar, with analysis and main application options:

Management ribbon bar, with dropdown action buttons:
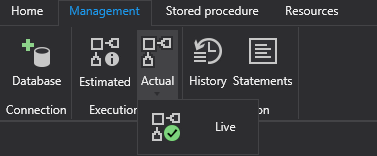
Stored procedure ribbon bar, with selection of options for profile analysis:

Resources ribbon bar:

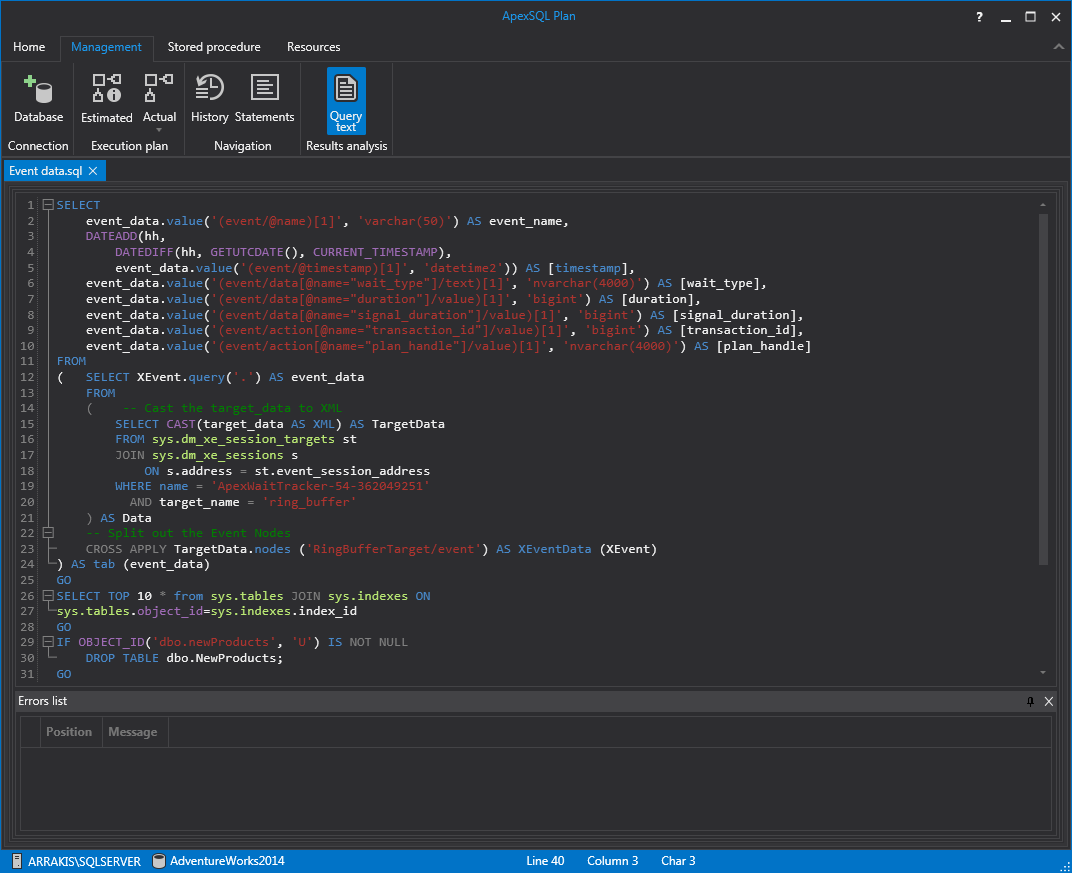
This Query text tab is used for writing execution plan queries. This tab is also shown when a previously saved execution plan query is loaded:
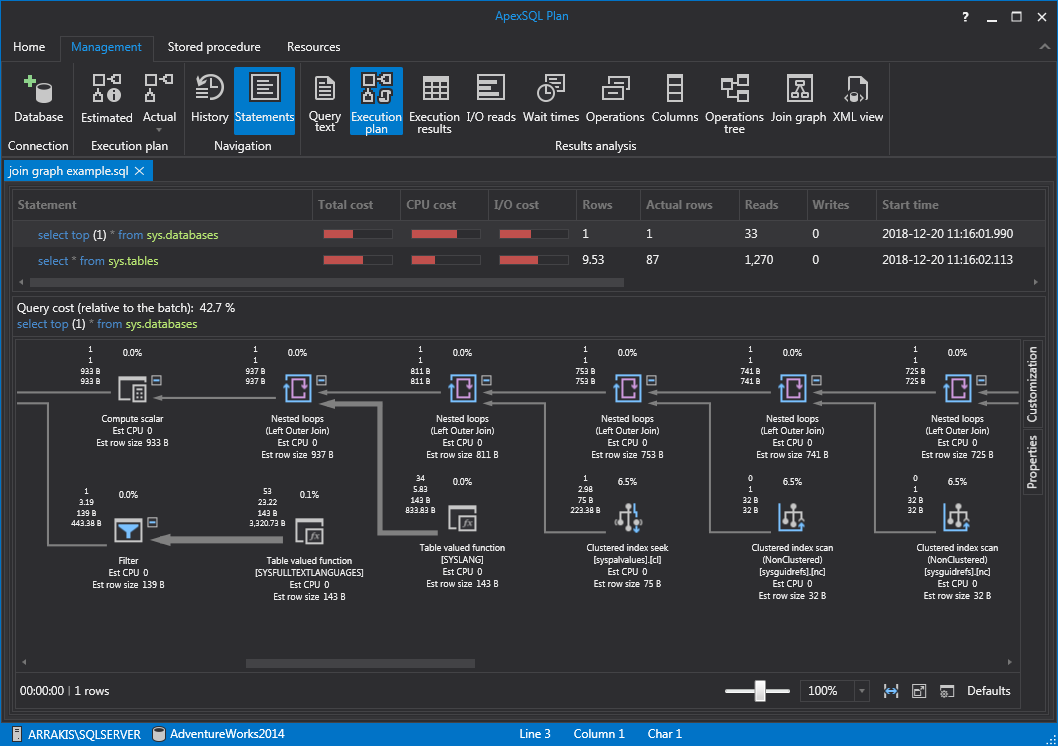
The Execution plan tab is activated, along with other tabs, seen on the bottom of the window, when an execution plan is executed to create an actual, live or estimated query execution plan:
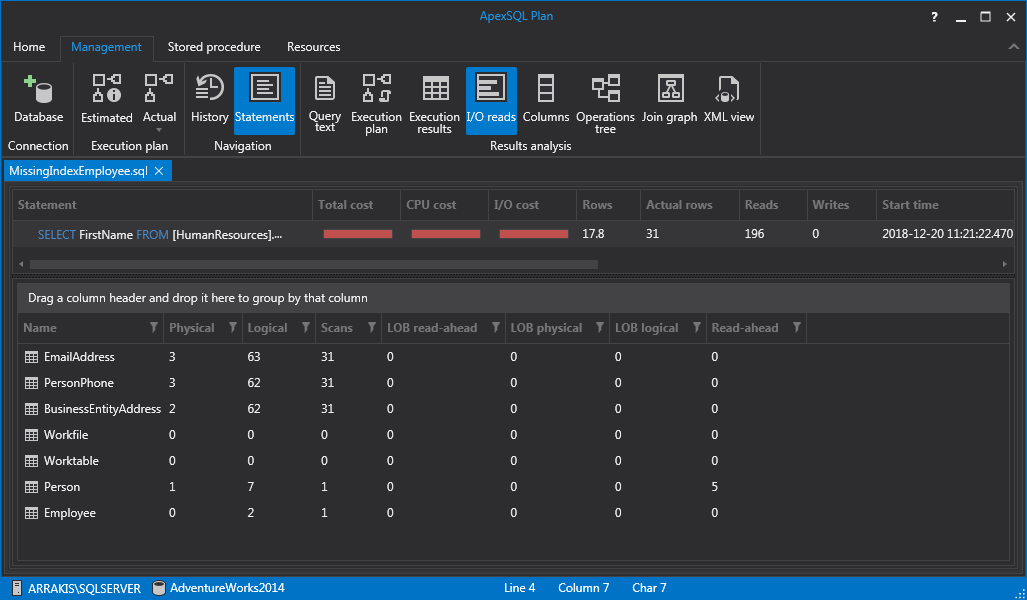
The I/O reads tab is used for performing I/O reads analysis along with scan counts:
The Waits tab is used for analyzing wait statistics of executed queries:
The Operations tab shows simplified and expanded operations that are used in the selected query and allows implicit conversions within.
The Columns tab is used for reviewing all columns used in the plan, and their associated operations and indexes:
The Operations tree tab is used for analyzing query operation tree details:
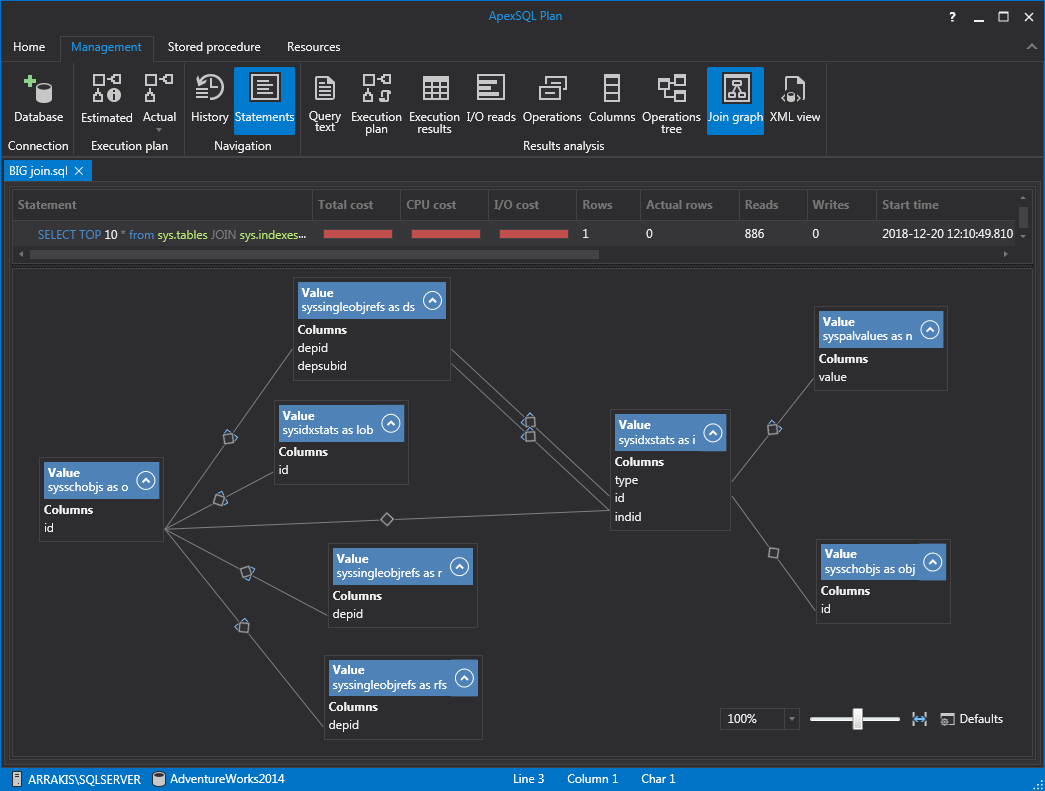
The Join graph tab is used to graphically display relationships between database tables involved in the execution plan:
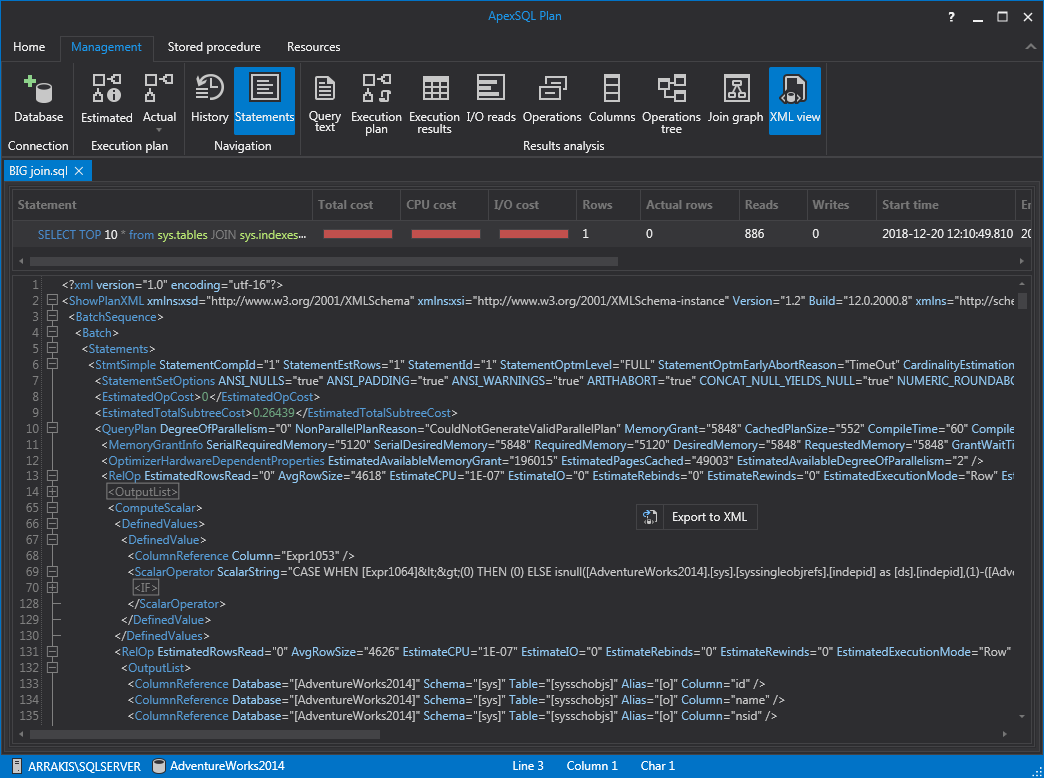
The XML view tab is used to display the query execution plan in XML format:
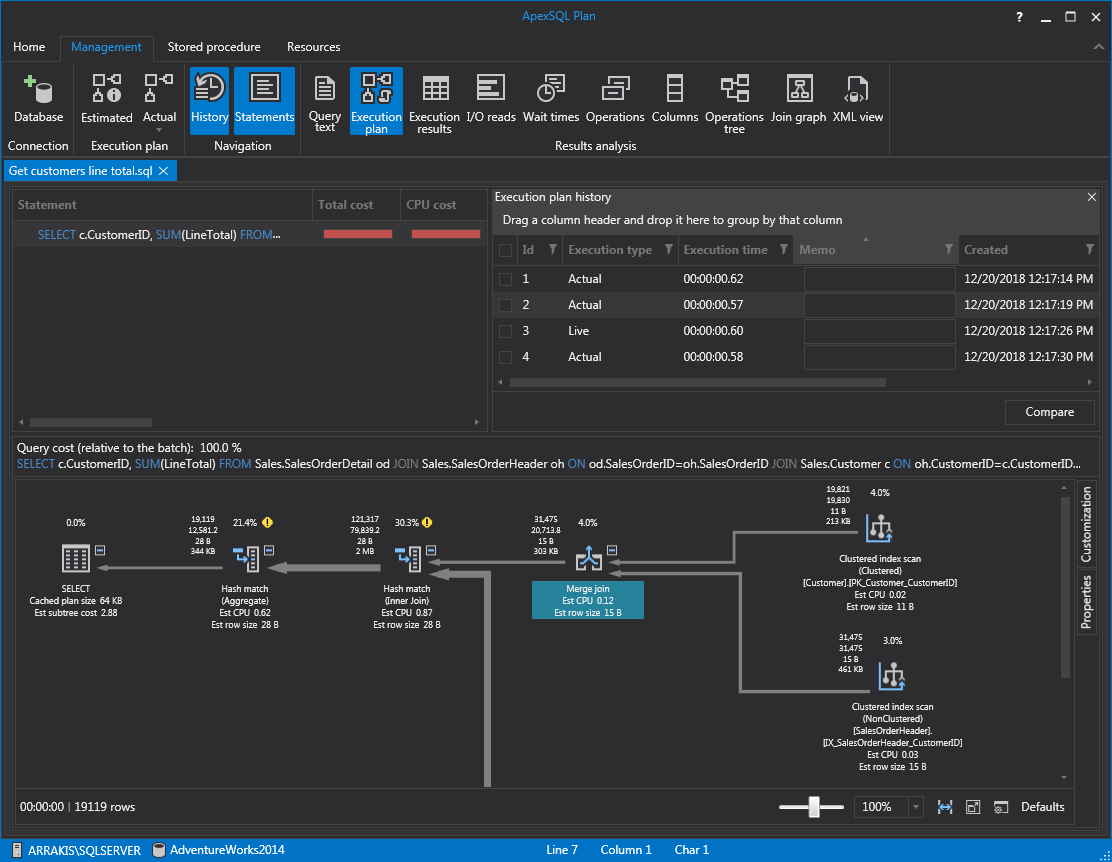
The Execution plan history tab is used to display the history of different versions of query executions for the current application tab:
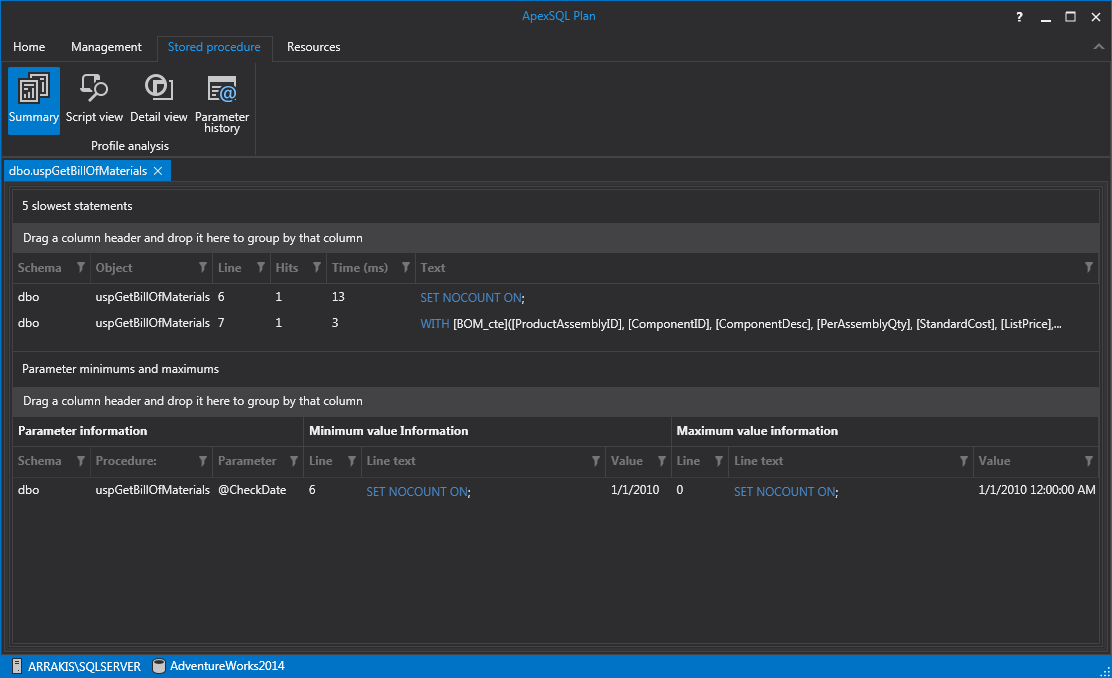
The Stored Procedure Summary tab displays combined information about Stored Procedure statements from Detail view tab and parameter execution from Parameter history tab:
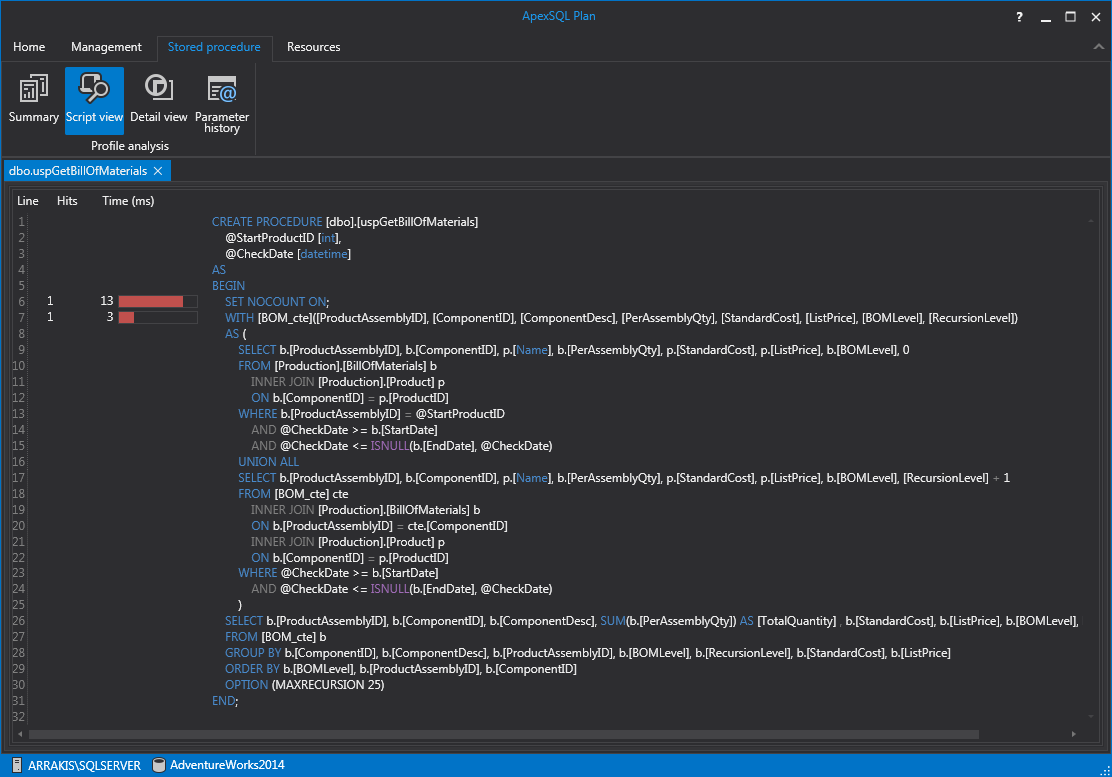
The Script view displays full query text for a Stored Procedure with execution times per statement:
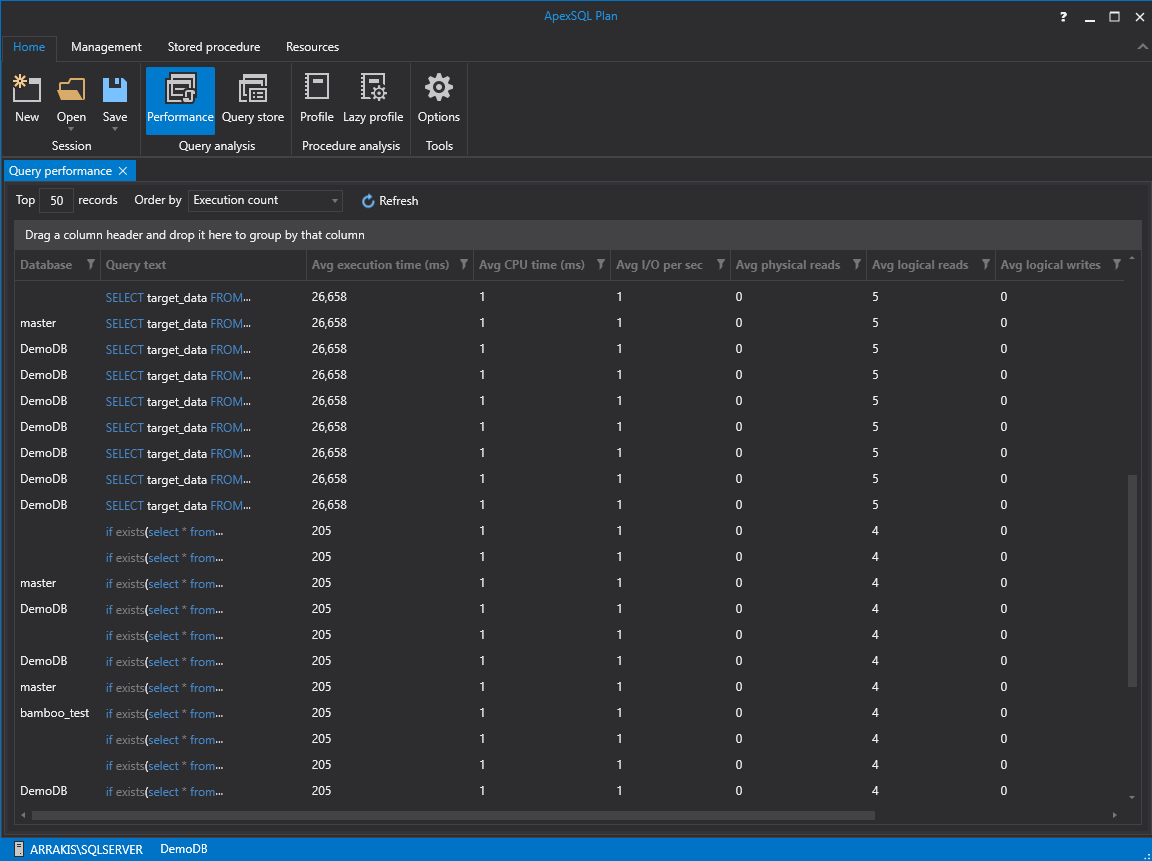
The Query performance tab displays the slowest queries recently executed by defined criteria and collected from SQL Server with provided all important details:
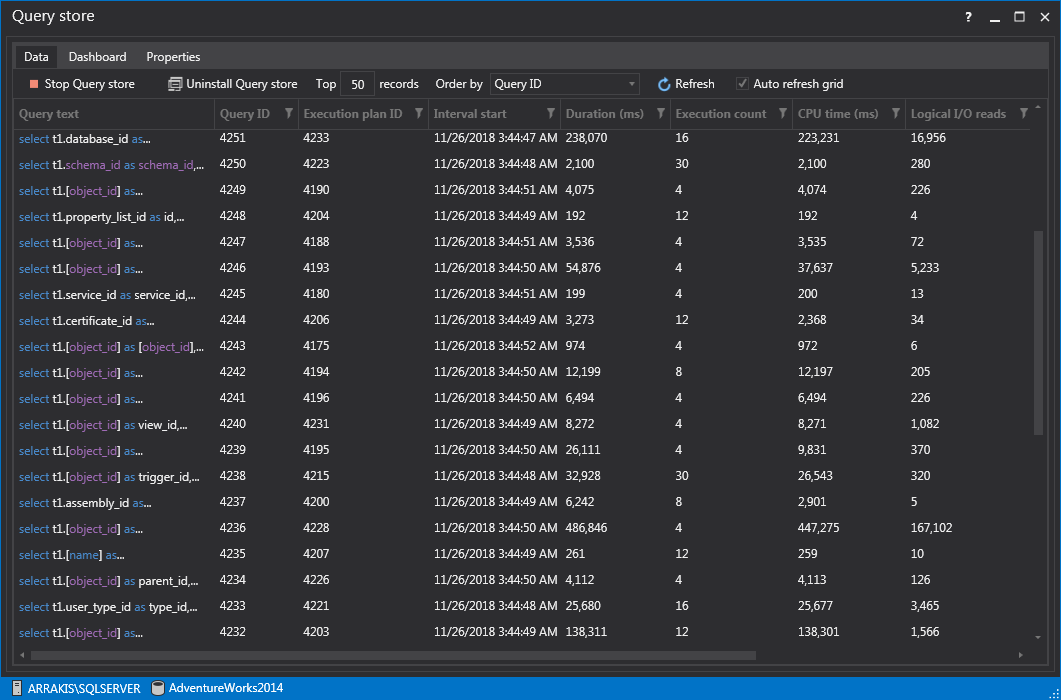
The Query store tab is used for reviewing query execution data collected from SQL Server Query store. This feature is supported for SQL Server 2016 version and higher. Support for older SQL Server versions is available with built-in Open Query Store installation
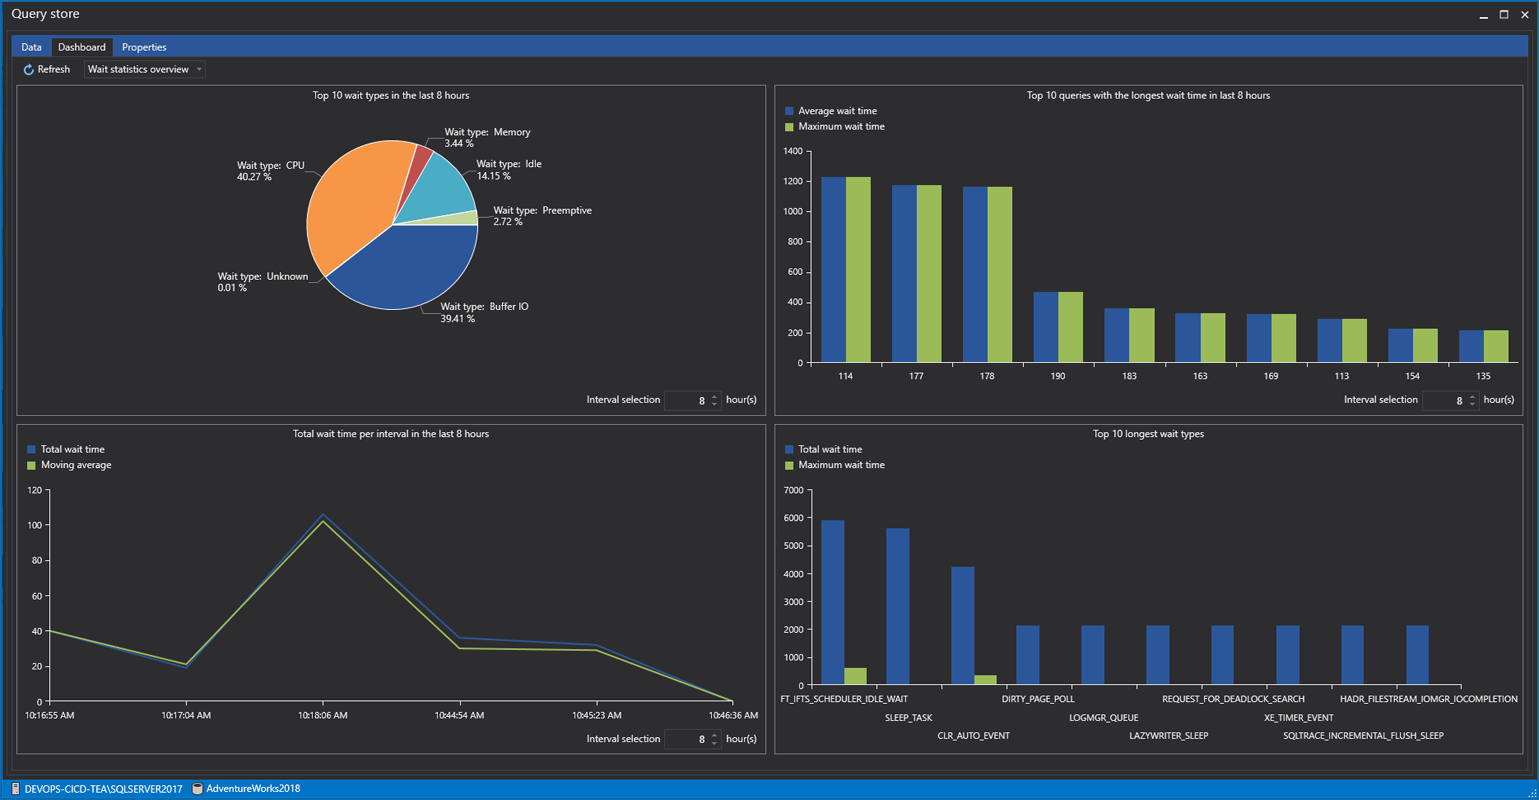
Dashboard provides graphical presentation of gathered query statistics:
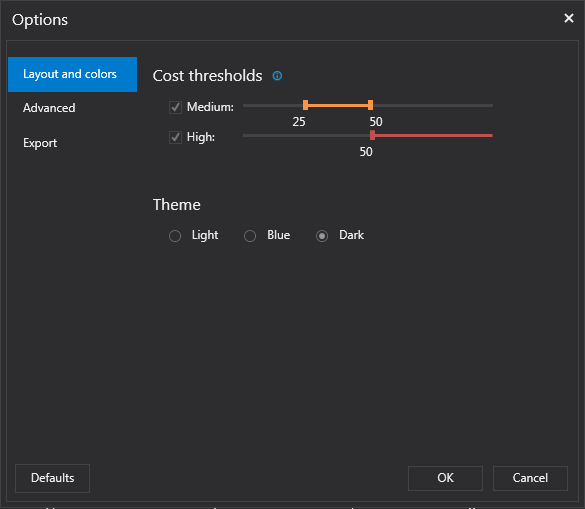
The Layout and colors tab in the Options window is used for setting up cost threshold values and selecting the desired GUI theme of ApexSQL Plan:
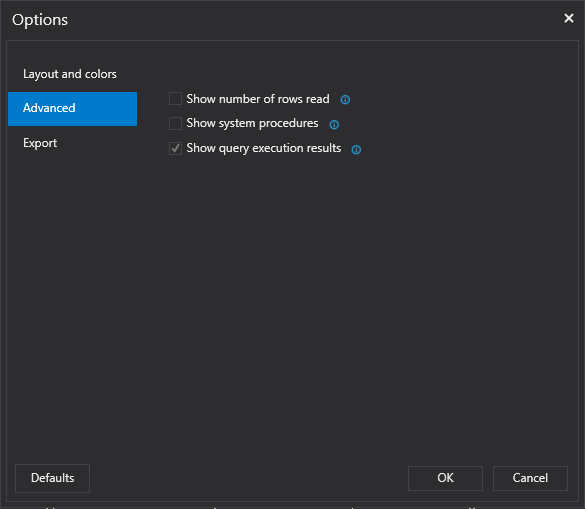
The Advanced tab in the Options window is used for managing available information:
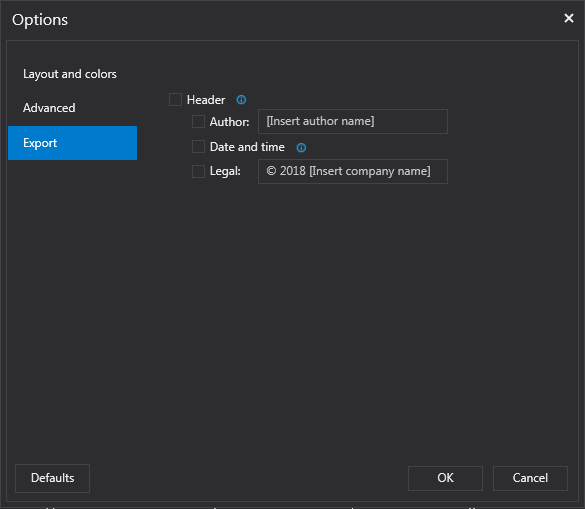
Export tab provides options to insert header information to exported files:
The Deadlock tab is shown when a deadlock file is opened. This tab is used for analyzing deadlock diagrams to identify the cause of a deadlock:
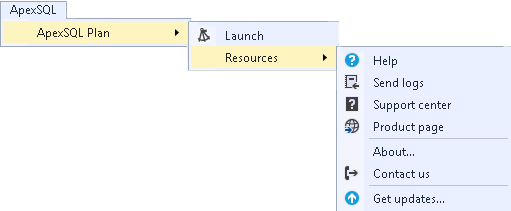
The main menu of ApexSQL Plan add-in for SQL Server Management Studio:
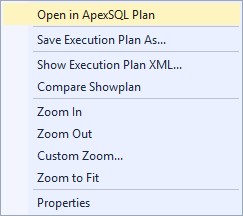
The Execution plan tab context menu with action button for ApexSQL Plan in the Query editor window in SQL Server Management Studio:
January 9, 2019


