In the next release of ApexSQL Monitor 2017 R1, planned for Q1 this year, we’ll be introducing a new Web user interface and along with it a new design for AlwaysOn Availability Group performance monitoring
The new graphical presentation of the AlwaysOn environment allows for displaying the complete topology of all AlwaysOn Availability Groups that share the same availability replicas as well as Windows Server Failover Cluster (WSFC) environment that’s hosting the SQL Server AlwaysOn AGs
We used mockups for the article as the final UI is still being developed
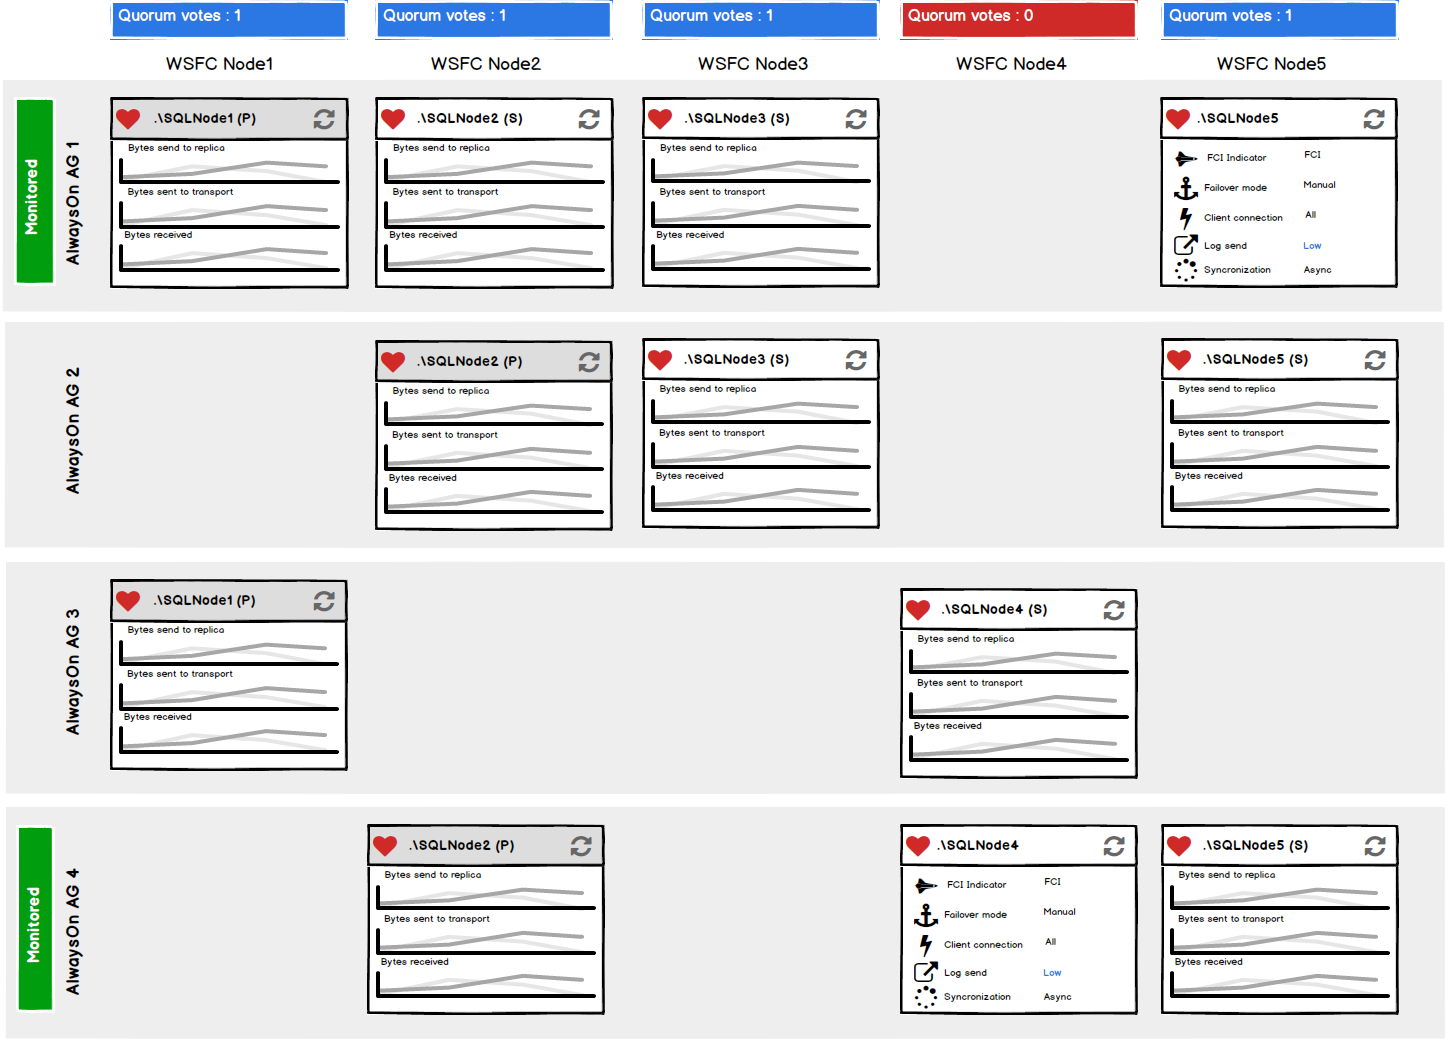
The AlwaysOn Availability Group topology is graphically conveyed via the AlwaysOn dashboard as shown below
The AlwaysOn dashboard will be capable of resolving and providing the full WSFC and AlwaysOn structure holistically, including AlwaysOn listeners that are not added for monitoring, though only the replicas and WSFC that are part of the added AlwaysOn Availability Group will be monitored. The AlwaysOn group that are explicitly added for monitoring will be marked with a green “Monitored” tag. The AlwaysOn AGs that are not added will be greyed out and no performance data will be collected and displayed for them
The AlwaysOn dashboard allows for access to important information about the monitored AlwaysOn Availability Groups including:
- Availability Groups (AG) and Failover Cluster Instance (FCI) base replicas that are distributed across the Windows Server Failover Cluster (WSFC) nodes
- Windows Server Failover Cluster (WSFC) nodes quorum vote state and number
- Identification of the primary replicas for each AlwaysOn AG
- insights into the replica health and in the replica failover state
- Relationship between the AlwaysOn AG and the Failover Cluster Instance (FCI) if any
- Data volume between the replicas
- Data rate between the replicas
Each row in the diagram matrix represents one AlwaysOn availability group, while each column represents one WSFC node that hosts the AlwaysOn replicas
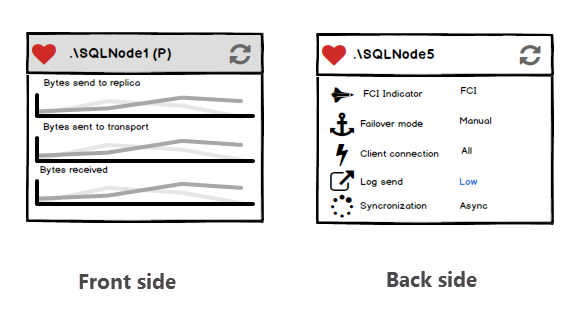
The AlwaysOn dashboard diagram introduces two types of the AlwaysOn replica panels for displaying the most important data for each replica

Each panel in the AlwaysOn dashboard utilizes the front (primary) side and the back (secondary) side, each loaded with the data related to AlwaysOn replica they represent
The information about the replica health, replica name and the replica role (primary or secondary) is available in both side of the panels
The front side of the panel displays the real-time charts for Bytes send to replica, Bytes sent to transport and Bytes received AlwaysOn performance metrics, allowing the immediate perception about the data volume on that replica
The back panel is the indicator panel and it provides the following information:
- FCI indicator – shows whether the replica is SQL Server Failover Cluster Instance (FCI) or regular SQL Server instance
- Failover mode – indicates whether the AlwaysOn replica is set in manual or automatic failover mode
- Client connection – shows the configured connection modes for the replica. The client connection icons for the primary and Secondary replica are different, due to different nature of primary and secondary replica client connections
- Log send/Recovery queue status – this indicator resembles the Log send and Recovery queue metrics status. The indicator can have four states/colors that resembles the alert threshold values defined for those metrics
- Synchronization mode – shows whether the availability replica is configured to run in Synchronous-commit or Asynchronous-commit mode
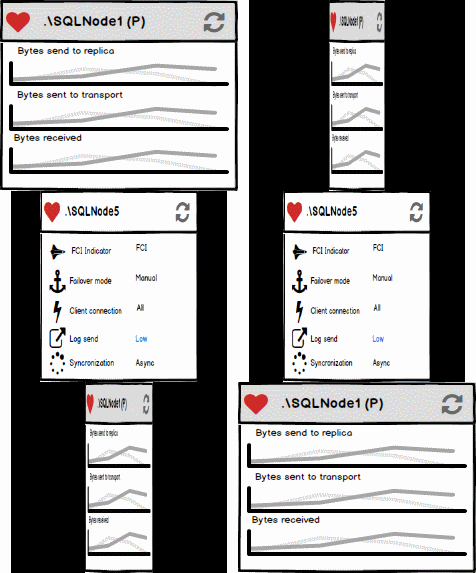
Each panel can be easily flipped.

January 31, 2017


