


We at ApexSQL are proud to present a redesigned ApexSQL Monitor’s custom reports feature
New Custom reports
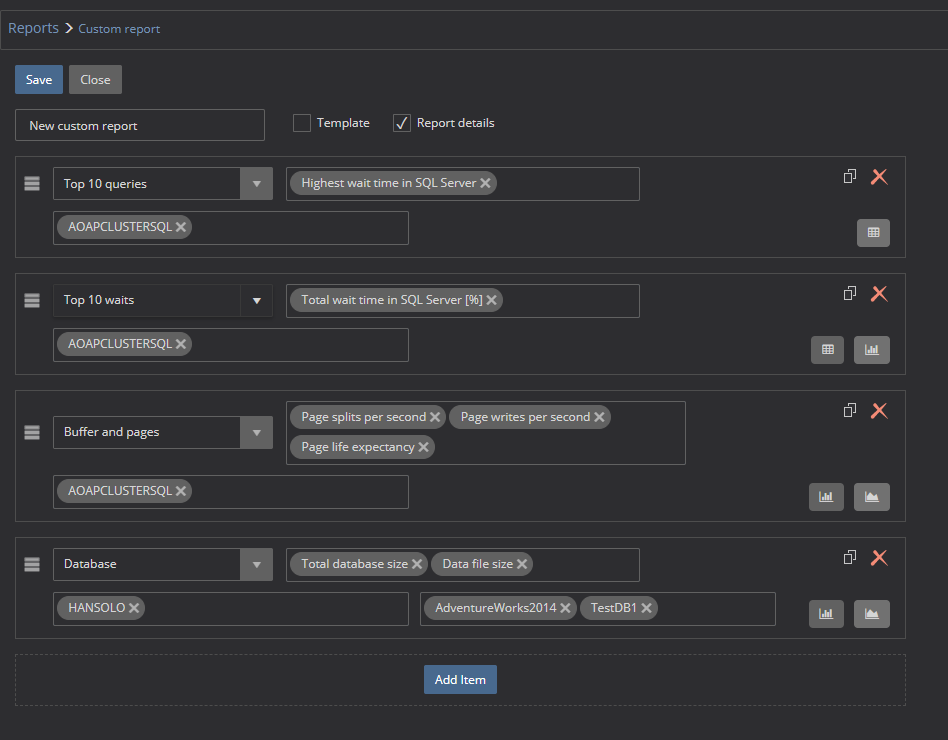
In the redesigned custom reports, we’ve introduced more advanced and modern UI that grants users more freedom and granularity in reports customization. Also, new reports are fully interactive which improve performance issues analytics and troubleshooting abilities
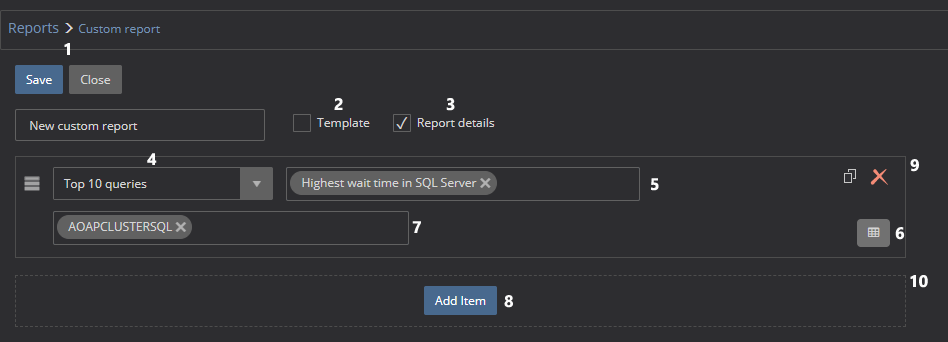
UI topography:
- Save and Close buttons
- Template checkbox – use the created report as a template for new reports
- Report details checkbox – adds report details table in report
- Category drop-down list – filers resources
- Resource multi-select (select and combine multiple resources into each reporting segment independently)
- Show as type menu now adds a table along to new chart types as part of the report
- Instance multi-select allows selecting monitored instances to be used as a source for each reporting segment independently
- Add Item button – creates a new report segment
- Report segment. Each report can contain multiple independently designed report segments
- New report segment adds a new segment into report
New report items
The functional design and UI for reports are redesigned significantly to ensure much better user experience and report organization., That allows intuitive and fast reports layout creation in the WYSIWYG (what you see is what you got) manner.
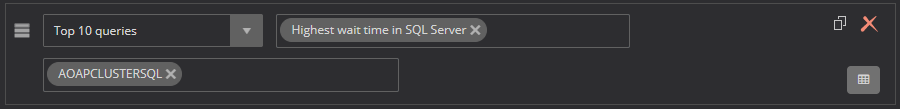
The first step in creating the new report is adding the report segment by merely clicking the Add item

Every new report segment consists of own controls for detailed report segment management.
New custom reports introduce report resources as an essential element. The advantage of such a design is that resources are now not just selection of performance metrics, but predefined ApexSQL reports or combination of metrics and reports can now be used as a resource for the reporting segment. The list of available resources is determined by the selected category to prevent any potential mistake in the logical combining of the resources.
One or multiple monitored instances can be selected for each reporting segment allows the full freedom in report creation that is limited just to the report. This approach grants not only improved reporting performance but allows a more comfortable way of identifying the most problematic instances and issues.
However, if a template option is selected, the instance cannot be selected, thus creating a report template that can be later used for reporting on monitored instances that are selectable at the moment of the report generation
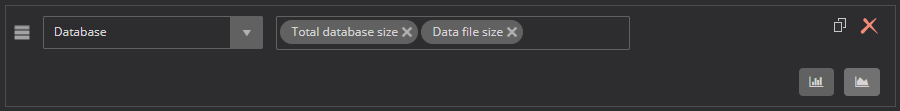
Another innovation introduced with new custom reports is improved granularity. When the database category is selected, the user can select not only the monitored SQL Server instance but also multiple databases from the scope of selected SQL Server instances, and ApexSQL Monitor intelligently associates the database to the parent SQL Server instance selected.
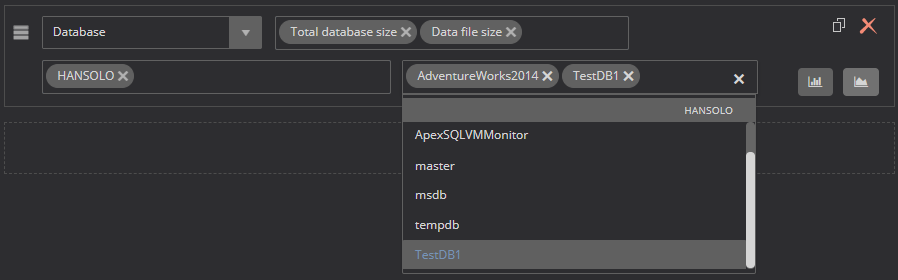
At the top right corner, controls for deleting and coping report segments are added. Now, each reporting segment can be easily duplicated as a source for the new report segment creation or deleted when not needed anymore.
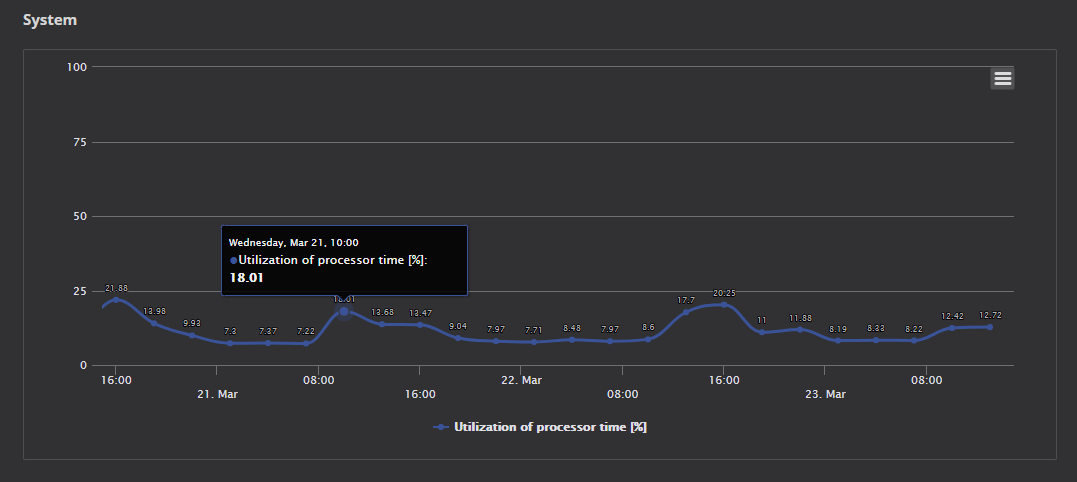
Improved and interactive charts
Another innovation, are brand new and improved charts. There are now more chart types to allow representing an increased variety of report resources. New charts in the generated final report are interactive now, which allows focussing only on the chart segment of the particular interest with providing additional information on data via tooltip.
February 23, 2018


