


We are glad to announce that we have released the initial version of ApexSQL Analyze, the newest member of ApexSQL Developer family equipped with a new and enhanced engine used for graphical dependency analysis.
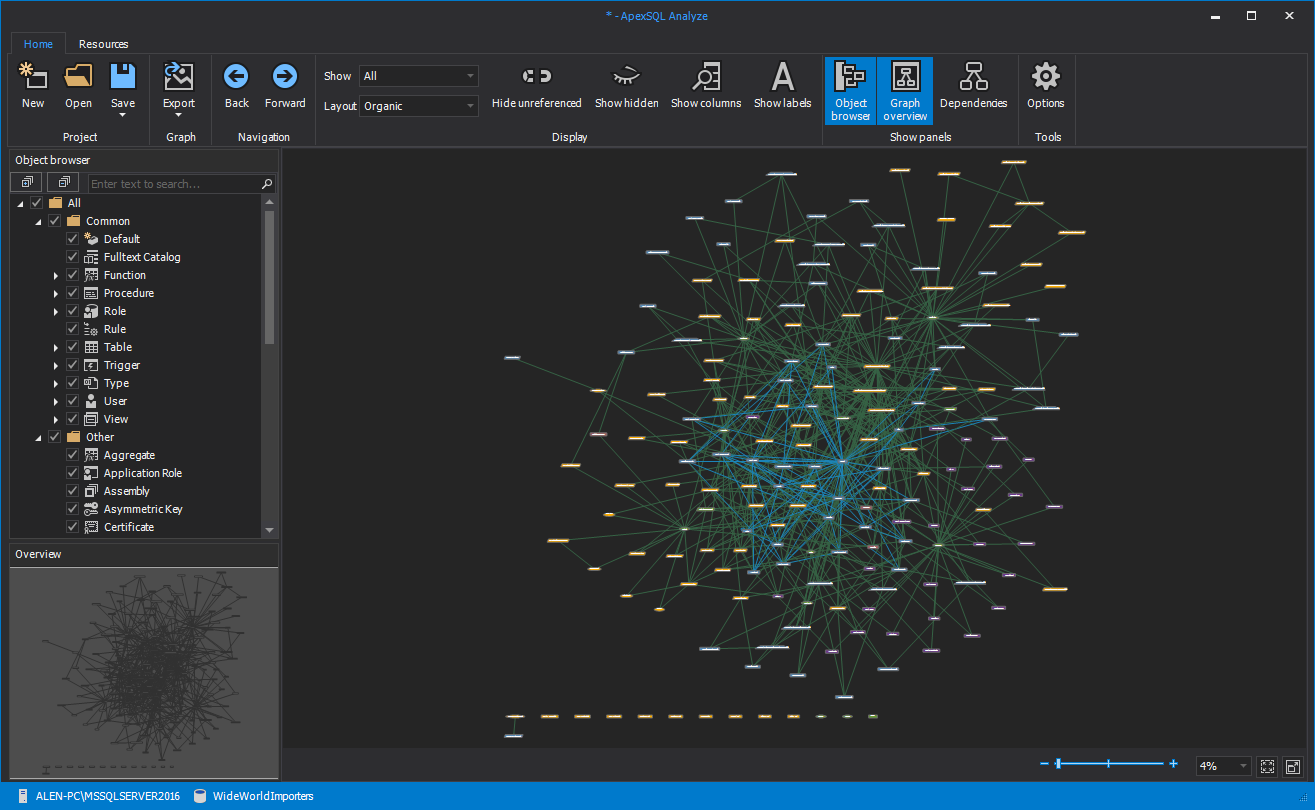
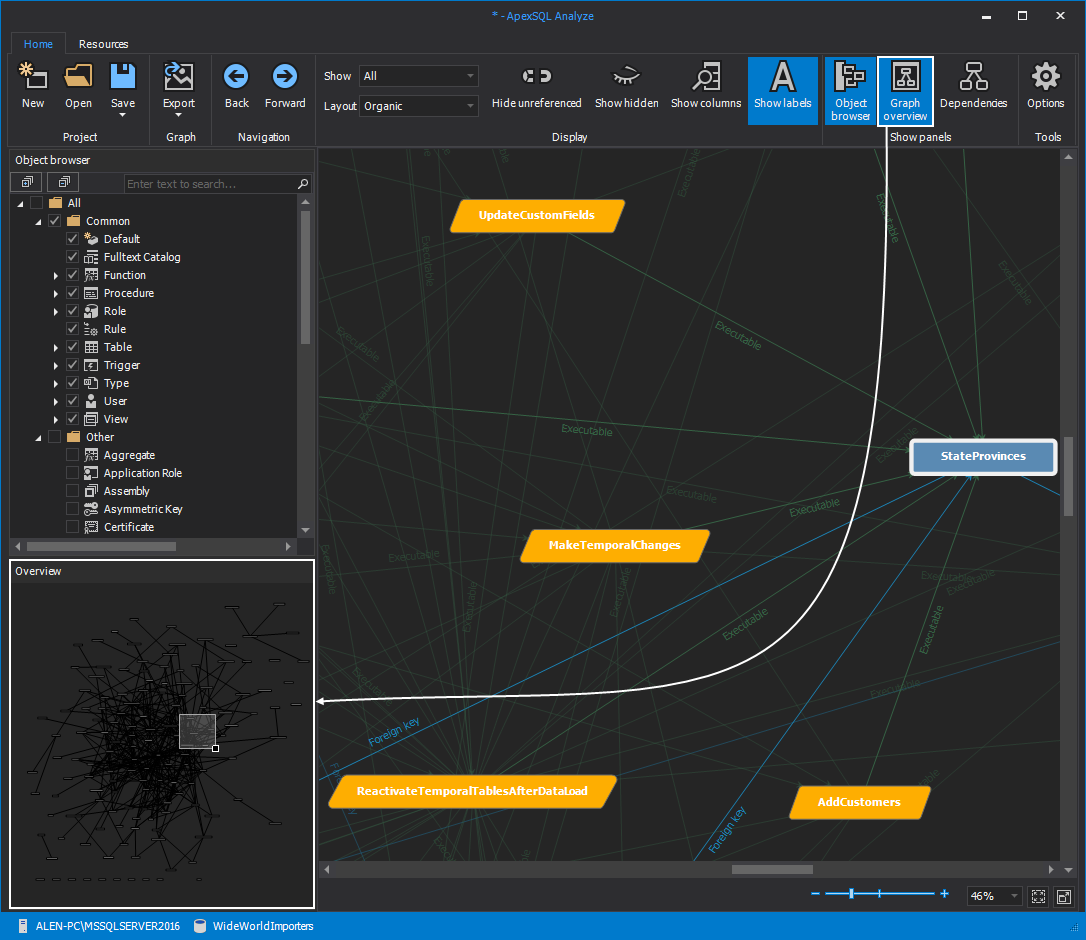
ApexSQL Analyze displays graphical dependencies between database objects in an organized, interactive visual format that offers various navigation and customization options.
The new and enhanced engine of ApexSQL Analyze user interface offers improved object appearance and manipulation.
Customizing the graphical dependency diagram appearance can be done by using the action buttons from the Display section in the main ribbon bar. This includes customizing the layout mode, show/hide unreferenced objects, object columns and dependency labels.
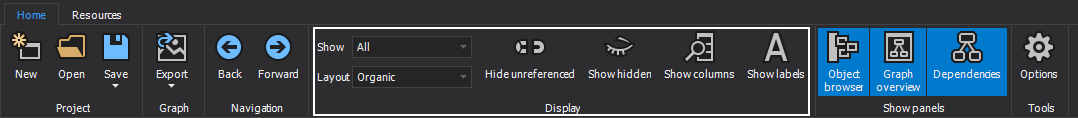
Another key option for interactive object manipulation is the Object browser panel that is located on the left side of the main window of ApexSQL Analyze. It can also be enabled or disabled anytime by selecting the Object browser button from the main ribbon bar in the Show panels group. All objects from the Object browser panel are grouped by type and can also be used to view objects up to a column level.
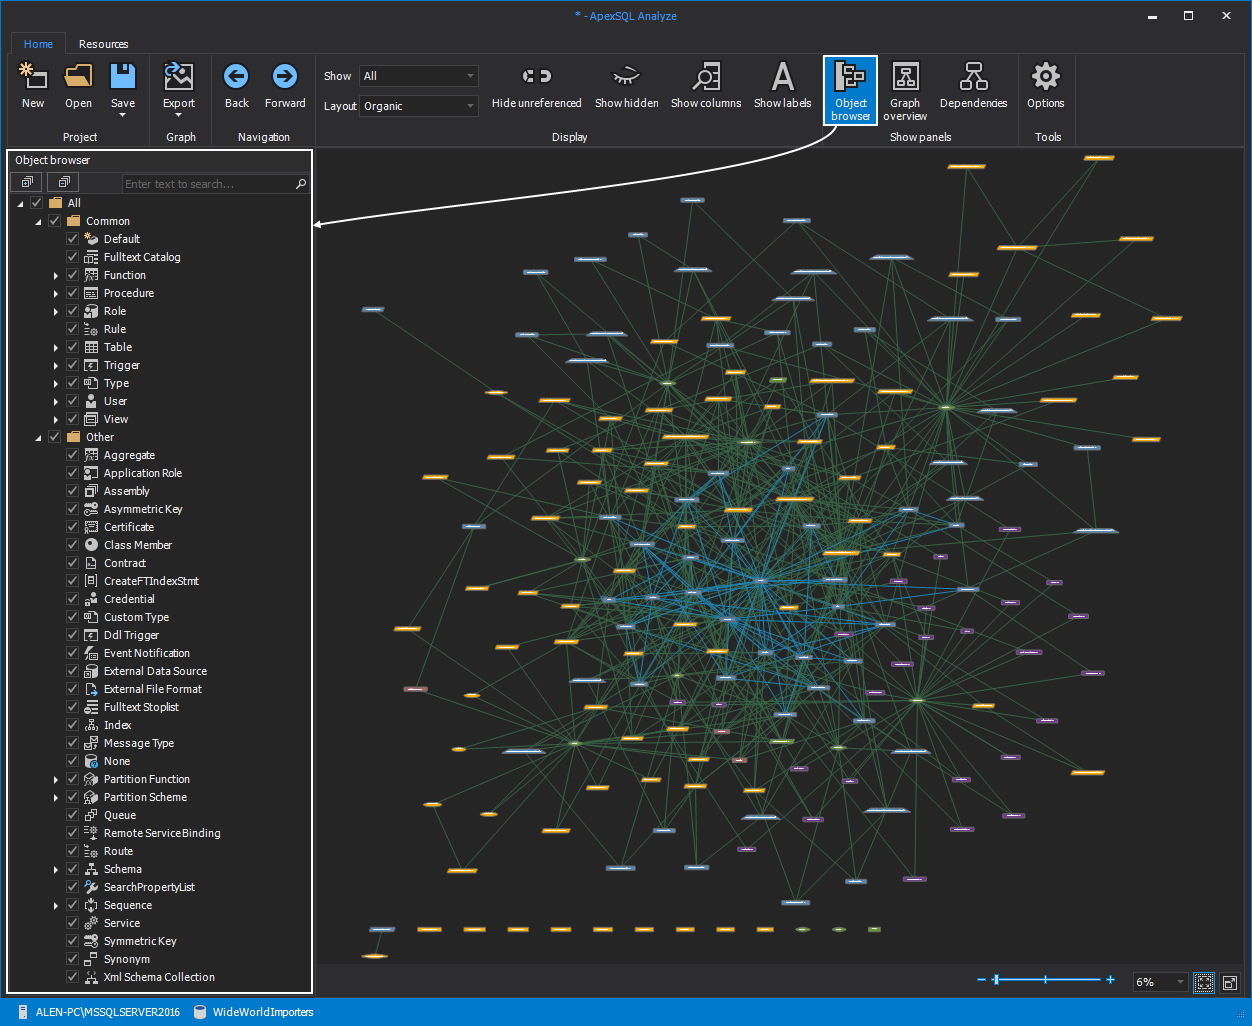
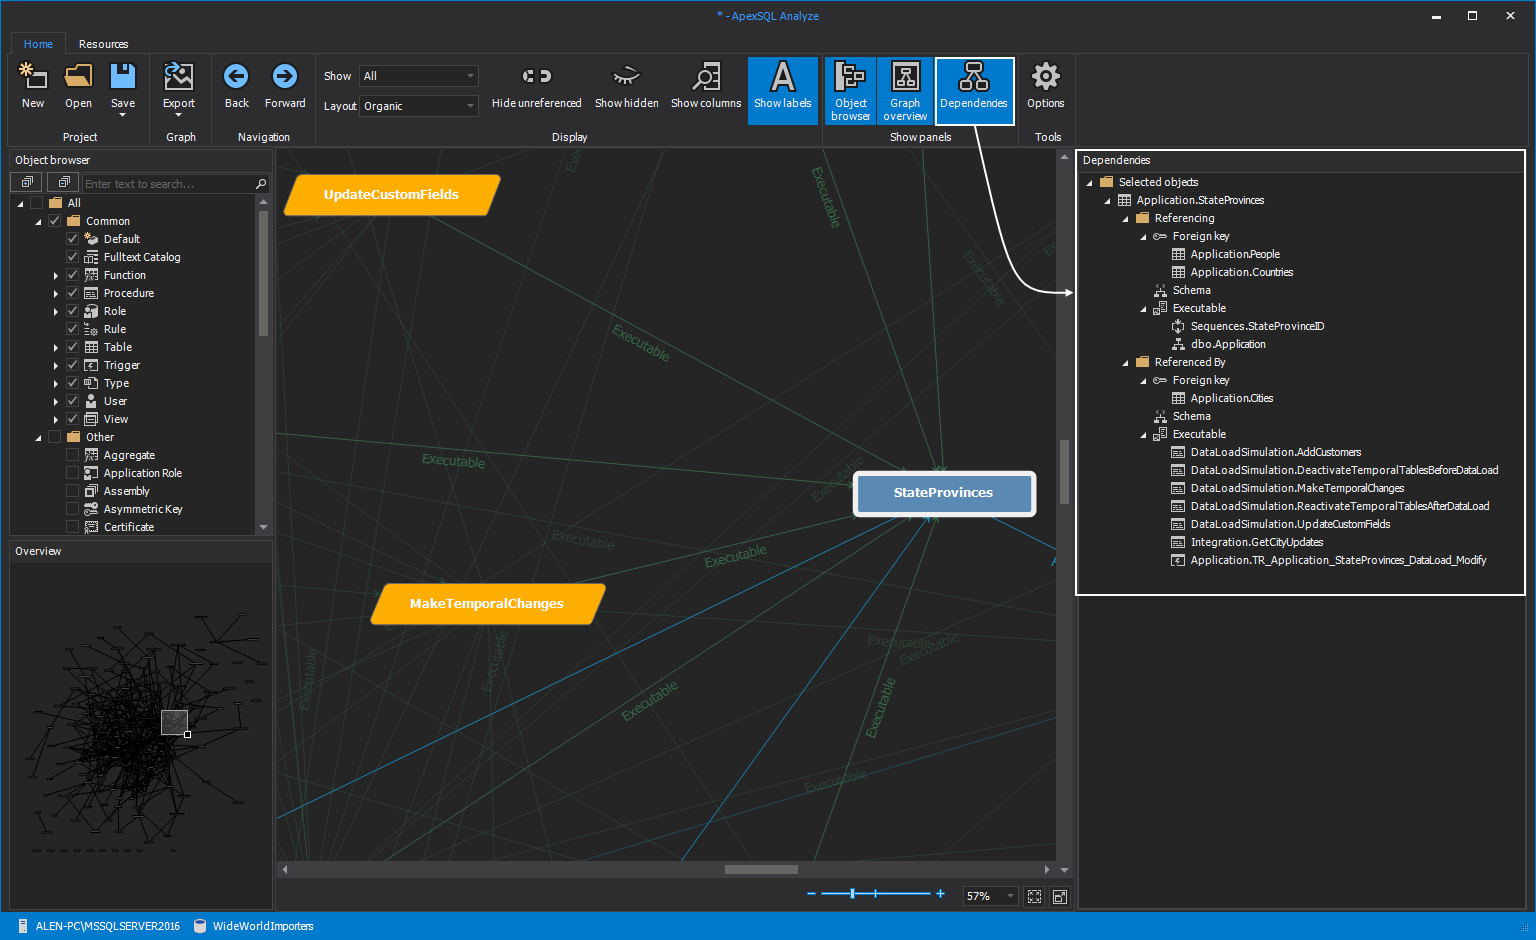
Selected object dependencies are displayed in the Dependencies panel which can be enabled or disabled by clicking the Dependencies button from the main ribbon bar.
Dependency diagrams can be quite huge and the size depends on the complexity of the database. That’s why ApexSQL Analyze is equipped with a few tools that can help in navigating around vast diagrams.
The Overview panel can be used as a minimap of object locations. It has a focused area that can be dragged for navigation and resized to determine the zoom level of the displayed diagram in the main window.
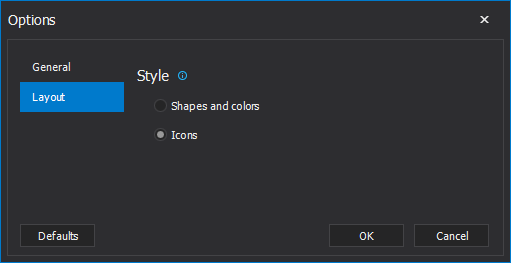
ApexSQL Analyze can also customize dependency diagrams by using two different layout style themes, “Shapes and colors” and “Icons“.
These options can be found in the Layout tab in the Options window:
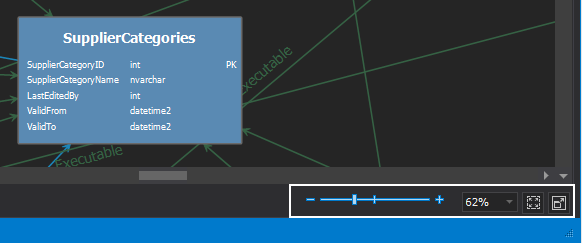
In the picture below, SQL object columns are shown using “Icons” layout style:
![]()
Additionally, the zoom options above the status bar can be used for the same purpose but with additional options for fitting the whole diagram to the application window and going into full screen mode.
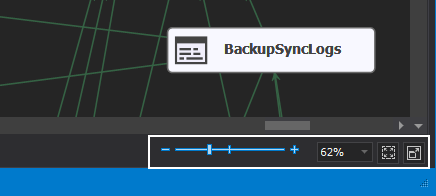
Additionally, the zoom options above the status bar can be used for the same purpose but with additional options for fitting the whole diagram to the application window and going into full-screen mode.
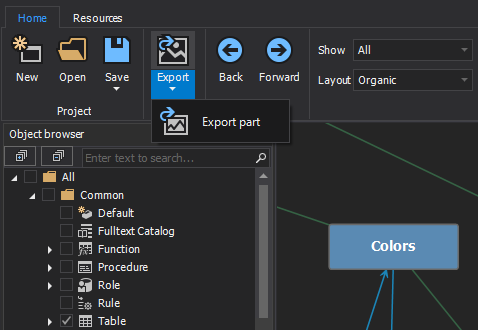
When it comes to exporting, ApexSQL Analyze can be used to export graphical dependency diagrams into BMP, JPEG and PNG formats by clicking the Export button from the main ribbon bar.
ApexSQL Analyze can also export a selected part of the graph if the whole diagram is not required. This can be done by clicking the Export part button and then select the desired part of the diagram by dragging the selection area, using the left mouse click.
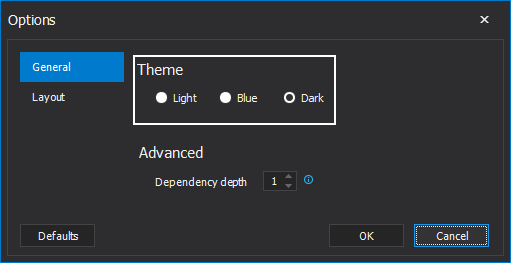
Another new addition to ApexSQL are the new GUI themes that provide the new SSMS 17 look and feel. The theme settings can be accessed in the General tab of the Options window.
To keep informed of new features and upcoming product releases, please see What’s next.
December 13, 2017


